Influence of Grain Size and Reflection Wave on Tsunami Deposit
その他のタイトル 津波堆積物の粒径や反射波の影響に関する水理実 験データを用いた土砂移動モデルの検証
著者 山本 阿子, 高橋 智幸, 原田 賢治, 櫻庭 雅明, 野 島 和也
journal or
publication title
社会安全学研究 = Journal of societal safety sciences
volume 9
page range 3‑19
year 2019‑03‑31
URL http://hdl.handle.net/10112/00017148
SUMMARY
・ To・ improve・ tsunami・ prediction,・ it・ is・ important・ to・ consider・ paleo・ tsunami・ records.・
Tsunami・ deposits・ can・ provide・ many・ paleo・ tsunami・ records;・ however,・ the・ formation・
mechanism・ of・ tsunami・ deposits・ remains・ unclear.・ Furthermore,・ numerical・ analysis・
focusing・ on・ tsunami・ sediment・ in・ the・ inundation・ area・ has・ fewer・ verification・ examples.・
Therefore,・in・this・study,・we・conducted・hydraulic・experiments・to・elucidate・the・formation・
mechanism・ of・ tsunami・ deposits.・ The・ hydraulic・ experiments・ considered・ the・ influence・ of・
grain・ size・ and・ reflection・ wave.・ In・ addition,・ we・ investigated・ the・ characteristics・ of・ sand・
deposits・ depending・ on・ sand・ composition・ and・ topography・(i.e.,・ natural・ embankment).・ It・
was・confirmed・that・the・amount・of・sand・deposit・decreased・toward・the・top・of・the・run-up・
area.・ However,・ for・ the・ case・ of・ mixed・ sand・ which・ has・ several・ grain・ sizes,・ it・ was・ found・
that・the・mixing・ratio・influenced・the・composition・ratio・of・the・sand・deposit・in・the・middle・
of・the・slope・area.・For・the・case・of・the・reflection・wall,・it・was・observed・that・characteristic・
sand・ deposits・ were・ formed・ by・ the・ return・ flow.・ We・ evaluated・ existing・ sand・ transport・
models・using・the・obtained・data.・The・results・of・the・numerical・experiments・confirmed・the・
high・reproducibility・of・the・existing・models・for・the・case・with・the・return・flow・(i.e.,・with・a・
reflection・ wall).・ However,・ for・ the・ case・ without・ return・ flow・(without・ a・ reflection・ wall),・
it・ was・ clear・ that・ reproducibility・ was・ affected・ by・ grain・ size.・ Furthermore,・ it・ was・
Validation of Sediment Transport Model Using Hydraulic Experiment Data to Assess the Influence of
Grain Size and Reflection Wave on Tsunami Deposit
津波堆積物の粒径や反射波の影響に関する 水理実験データを用いた土砂移動モデルの検証
関西大学 社会安全研究科
山 本 阿 子
Graduate・School・of・Societal・Safety・
Sciences,・Kansai・University Ako YAMAMOTO
関西大学 社会安全研究科
高 橋 智 幸
Graduate・School・of・Societal・Safety・
Sciences,・Kansai・University Tomoyuki TAKAHASHI 静岡大学 防災総合センター
原 田 賢 治
Center・for・Integrated・Recearch・and・Education・
of・Natural・Hazards,・Shizuoka・University Kenji HARADA
日本工営株式会社
櫻 庭 雅 明
NIPPON・KOEI・Co.,・Ltd.・
Masaaki SAKURABA
日本工営株式会社
野 島 和 也
NIPPON・KOEI・Co.,・Ltd.・
Kazuya NOJIMA
1.Introduction
・ Underestimation・ of・ the・ magnitude・ of・
tsunamis・ could・ result・ in・ their・ occurrence・
causing・greater・damage・than・might・otherwise・
be・ expected.・ Examination・ of・ the・ records・ of・
many・paleo・tsunamis・is・necessary・to・mitigate・
or・prevent・tsunami-related・damage.・However,・
huge・ tsunamis・ such・ as・ the・ 2011・ Tohoku・
tsunami・occur・infrequently,・and・there・is・a・limit・
to・the・accuracy・of・estimations・of・tsunami・scale・
based・on・historical・records・such・as・documents・
and・ stone・ monuments.・ Coastal・ tsunami・
sediments・that・contain・records・of・many・paleo・
tsunamis・ have・ been・ investigated・ using・
advanced・ coring・ and・ analytical・ techniques・ to・
estimate・ their・ frequency・ of・ occurrence・ and・
relative・ scales
[1,2].・ However,・ quantitative・
estimations・of・scale・have・not・been・undertaken・
previously・ because・ the・ formation・ mechanism・
of・ tsunami・ deposits・ remains・ unclear.・
Considerable・quantities・of・data・were・collected・
to・follow・the・2011・Tohoku・tsunami,・e.g.,・video,・
observations,・measurements・of・the・distribution・
and・ structure・ of・ the・ sand・ deposits・ in・
inundation・ areas.・ Based・ on・ field・ research・ of・
the・deposits・of・the・2011・Tohoku・tsunami,・Abe・
et・ al.
[3]・ reported・ detailed・ data・ on・ sediment・
grain・ size,・ volume,・ and・ distance・ from・ the・
shoreline.
・ One・ method・ used・ for・ the・ analysis・ of・ sand・
deposits・ is・ numerical・ simulation・ of・ sediment・
transport・ by・ tsunamis.・ Takahashi・ et・ al.
[4]・ proposed・ a・ sediment・ transport・ model・
(hereafter,・ the・ 2000・ model),・ which・ can・ be・
applied・ even・ under・ nonequilibrium・ conditions・
of・suspended・sediment・concentration,・as・found・
in・a・tsunami,・because・the・suspended・load・and・
the・ bed・ load・ are・ handled・ separately.・
Suspended・ load・ is・ sand・ which・ transport・ as・
suspending.・Bed・load・is・sand・which・transport・
on・the・bottom.・This・model・was・applied・using・
the・ data・ of・ the・ 1960・ Chilean・ tsunami・ in・
Kesennuma.・ However,・ it・ was・ found・ to・
underestimate・ the・ amount・ of・ sand・
transportation・under・the・conditions・of・the・local・
topography.・ This・ model・ has・ since・ been・
improved;・however,・its・application・to・the・data・
of・ the・ 2011・ Tohoku・ tsunami・ still・ resulted・ in・
underestimation・ of・ the・ amount・ of・ sand・
transported
[5].・Takahashi・et・al.
[6]・proposed・an・
improved・ model・(hereafter,・ the・ 2011・ model),・
that・focused・on・the・coefficients・of・the・bed・load・
and・ the・ suspended・ load・ in・ the・ equation・ of・
motion・ in・ the・ 2000・ model.・ In・ this・ model,・ the・
coefficient・for・different・grain・sizes・was・derived・
by・ hydraulic・ experimentation;・ however,・
verification・using・other・grain・sizes・and・mixed・
sand・compositions・has・not・been・conducted.・It・
is・necessary・to・collect・tsunami・source・data・for・
more・ accurate・ estimation・ of・ tsunami・
magnitude.・ However,・ techniques・ for・ the・
estimation・ of・ a・ tsunami・ source・ based・ on・ the・
inverse・analysis・of・a・tsunami・deposit・have・yet・
confirmed・ that・ the・ amount・ of・ sand・ deposit・ was・ overestimated・ near・ the・ top・ of・ the・
run-up・area.・Thus,・we・considered・some・problems・of・overcome・this・model.
Key words
Tsunami・deposit,・uniform・sand,・mixed・sand,・bore・wave,・reflection・wall
to・ be・ developed.・ Furthermore,・ many・ existing・
models・have・targeted・the・ocean・area・with・little・
verification・of・such・models・in・run-up・areas.・In・
addition,・ Jaffe・ et・ al.
[7]・ revealed・ the・ problems・
associated・ with・ forward・ analysis・ and・ inverse・
analysis・ in・ the・ simulation・ of・ sediment・
transport・ by・ tsunamis.・ To・ resolve・ the・
problems,・ they・ demonstrated・ the・ need・ for・
additional・quantitative・data・from・research・and・
experiment.・ Estimation・ of・ a・ tsunami・ source・
based・on・sediment・deposits・requires・definition・
of・the・relationship・between・sand・grain・size・and・
the・ flow・ velocity・ and・ water・ level・ of・ the・
tsunami.・ Both・ Hasegawa・ et・ al.
[8]・ and・ Harada・
et・al.
[9,10]・have・conducted・hydraulic・experiments・
on・ sediment・ transport・ and・ the・ formation・ of・
deposits・ in・ the・ run-up・ areas・ of・ tsunamis.・
Their・work・elucidated・that・the・characteristic・
structure・ of・ the・ deposits・ is・ affected・ by・ grain・
size・and・the・magnitude・of・the・exerting・force.・
However,・ the・ effects・ of・ mixed・ sand・
composition,・ topography,・ and・ structures・ have・
not・ been・ considered.・ Yamamoto・ et・ al.
[11]・
conducted・ hydraulic・ experiments・ using・ three・
types・of・mixed・sand・and・three・grain・sizes・of・
uniform・sand.・In・their・hydraulic・experiments,・
not・only・were・the・effects・of・grain・size・and・the・
conditions・of・the・exerting・force・examined,・but・
also・ structures・ like・ reflection・ walls・ were・
installed・to・change・the・flow・conditions.・Their・
findings・ revealed・ the・ deposits・ formed・ unique・
structures・ depending・ on・ the・ flow・ conditions.・
In・ this・ study,・ we・ reproduce・ the・ result・ of・
Yamamoto・et・al.
[11]・by・the・model・of・Takahashi・
et・al.
[4,6],・elucidate・the・problems,・and・suggest・
improvements・for・the・model.
2.HYDRAULIC EXPERIMENT 2.1 Methods and Conditions
・ We・conducted・hydraulic・experiments・under・
conditions・of・fixed・and・movable・beds・using・a・
two-dimensional・ water・ channel.・ A・ part・ of・
result・ is・ Yamamoto・ et・ al.
[11]・ shown・ in・ this・
experiment.・The・fixed・bed・condition・was・used・
to・ investigate・ the・ relation・ between・ flow・
condition・and・the・wave・condition.・The・movable・
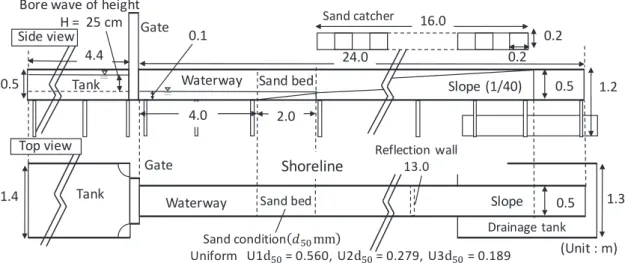
Figure 1. Experimental setup
bed・ condition・ was・ used・ to・ investigate・ the・
relation・ between・ the・ amount・ of・ sand・ deposit・
and・ the・ wave・ condition.・ Schematics・ of・ the・
experiments・and・sand・conditions・are・shown・in・
Figure 1 .
・ As・the・similarity・laws,・Shields・number・and・
ratio・of・bed・load・rate・to・suspended・load・rate・
were・ applied.・ Shield・ number・ is・ a・
dimensionless・ version・ of・ tractive・ force・ by・
grain・ size・ and・ density.・ Takahashi・ et・ al.
[12]・ studied・ shear・ stress・ on・ the・ sea・ bed・ in・
Kesennuma・bay・by・the・1960・Chilean・Tsunami.・
The・shields・number・converted・from・the・shear・
stress・ varied・ very・ frequently,・ and・ one・ order・
of・ a・ magnitude・ was・ dominant.・ Further,・
Hasegawa・ et・ al.
[13]・ showed・ that・ the・ shields・
number・ have・ to・ exceed・ 1.0・ in・ the・ tsunami・
sediment・ transport・ experiment.・ This・
experiment・set・a・target・of・exceeding・one,・and・
4.0・was・obtained.・The・latter・similarity・law・is・
controlled・ by・ the・ grain・ size・ of・ sand.・ In・ this・
experiment,・ the・ actual・ sand・ in・ sea・ was・ used,・
so・the・similarity・law・was・satisfied.
(1) Experimental equipment and method of sampling sand deposits
・ The・experimental・setup・comprised・a・water・
tank・(3・ m
3)・on・ the・ upstream・ side・ of・ a・ 24・ m・
water・ channel・ that・ was・ 0.5・ m・ wide.・ The・
water・channel・consisted・of・a・flat・section,・sand・
bed・ section,・ and・ slope・ section.・ Opening・ the・
gate・of・the・tank・generated・a・0.1・m・deep・bore・
wave・ in・ the・ flat・ section.・ The・ slope・ section・
(slope:・ 1/40)・ comprised・ an・ impermeable・
surface・roughened・using・sandpaper・(#80).・In・
the・ fixed・ bed・ condition,・ a・ sand・ bed・ section・
was・fitted・(slope:・1/20),・the・surface・of・which・
was・ also・ impermeable・ and・ roughened・ using・
sandpaper・(#80).・ Sand・ deposits・ transported・
on・ the・ slope・ by・ the・ bore・ wave・ were・ caught・
by・ a・ sand・ catcher.・ The・ sand・ catcher・
comprised・a・wooden・frame・with・stainless・steel・
plates・dividing・sections・at・equal・intervals・(0.2
×・ 0.2・ m),・ as・ used・ by・ Harada・ et・ al.
[9,10].・
Dropping・ the・ sand・ catcher・ onto・ the・ slope・
stopped・ the・ movement・ of・ the・ deposit・ and・
allowed・collection・of・samples・of・the・deposit・of・
equal・area.・We・employed・two・timings・to・catch・
the・sand・deposit:・one・when・the・wave・reached・
the・ top・ of・ the・ run-up・ area・ and・ the・ other・
when・ the・ return・ flow・ had・ gone.・ The・
deployment・position・was・set・from・the・shoreline・
to・the・top・of・the・run-up・area.・The・sample・of・
sand・ deposit・ collected・ from・ each・ section・ was・
measured・ for・ dry・ weight.・ For・ the・ case・ of・
mixed・sand・composition,・sieving・of・grain・sizes・
was・conducted・after・drying.
(2) Method of measurement for fixed bed condition
・ Water・level・was・measured・using・ultrasonic・
wave・height・meters,・and・the・flow・velocity・was・
measured・using・both・electromagnetic・velocity・
meters・and・propeller・velocity・meters.・For・the・
fixed・bed・condition,・we・measured・flow・velocity・
and・ water・ level・ at・ many・ points・ because・ we・
needed・to・record・detailed・flow・conditions.
・ The・ electromagnetic・ velocity・ meters・
measured・at・two・points:・1.0・and・5.0・m・(sand・
bed・ center)・ from・ the・ gate.・ The・ propeller・
velocity・meters・measured・at・eight・points・from・
the・ shoreline・ to・ 20・ m・ from・ the・ shoreline・ at・
2.0・m・intervals.・However,・for・the・case・of・the・
reflection・ wall,・ measurements・ were・ acquired・
at・ eight・ points・(6.0,・ 7.1,・ 8.3,・ 8.9,・ 9.7,・ 11.1,・
11.5,・ and・ 12.3・ m)・from・ the・ gate.・ Ultrasonic・
wave・ height・ meters・ were・ used・ to・ take・
measurements・ at・ the・ points・ of・ the・ velocity・
meter・measurements.・All・measurement・points・
were・set・central・in・the・channel.・The・propeller・
velocity・ meters・ were・ set・ 1・ cm・ above・ the・
bottom・surface・to・measure・the・bottom・velocity・
on・ the・ slope.・ For・ the・ movable・ bed・ condition,・
the・ velocity・ and・ water・ level・ were・ measured・
1.0・ m・ from・ the・ gate,・ as・ well・ as・ at・ the・
shoreline・ and・ the・ center・ of・ the・ sand・ bed.・ In・
addition,・ turbidity・ meters・ were・ set・ at・ four・
points・(6.0,・ 6.2,・ 7.0,・ and・ 7.8・ m・ from・ the・
gate)・on・the・slope・near・the・shoreline.・All・case・
experiments・ were・ undertaken・ three・ times・ to・
confirm・ reproducibility.・ Furthermore,・ moving・
images・were・taken・from・the・side・of・the・sand・
bed,・ slope,・ and・ the・ top・ of・ the・ run-up・ area.・
These・ were・ used・ to・ measure・ the・ run-up・
distance・from・the・shoreline・and・to・confirm・the・
behavior・of・the・sand.
(3) Sand grain sizes and mixing ratios for
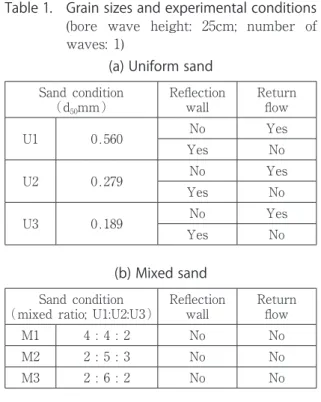
Figure 2. Grain size accumulation curves(a) Uniform sand (b) Mixed sand
movable bed condition
・ The・location・and・condition・of・the・sand・are・
shown・ in・ Figure 1 .・ In・ this・ study,・ we・
investigated・ not・ only・ uniform・ sand,・ as・ in・
previous・ studies,・ but・ also・ mixed・ sand・ which・
has・ several・ grain・ sizes.・ The・ latter・ is・ more・
representative・of・reality.
・ The・sand・was・set・in・the・sand・bed・section・
as・ three・ types・ of・ uniform・ sand・ and・ three・
types・of・mixed・sand.・ Figure 2 ・shows・their・grain・
size・ accumulation・ curves・ after・ sieving.・ The・
median・grain・size・of・sand・U1,・U2,・and・U3・was・
0.560,・0.279,・and・0.189・mm,・respectively.・The・
mixing・ratio・is・a・ratio・of・mixed・sand・in・mass・
(U1:U2:U3).・The・mixing・ratio・of・M1,・M2,・and・
M3・ were・ 4:4:2,・ 2:5:3,・ and・ 2:6:2,・ respectively.・
The・ sand・ bed・ section・ was・ completely・
submerged・with・initial・water・depth・of・0.1・m.・
The・sand・in・the・sand・bed・section・was・allowed・
to・set・by・settlement・under・submergence.
(4) Conditions of exerting forces
・ The・ sand・ conditions・ and・ exerting・ forces・
conditions・ of・ the・ experiments・ are・ listed・ in・
Table 1.・The・bore・wave・height・was・set・to・the・
water・level・difference・H・(25・cm)・between・the・
water・tank・and・the・initial・water・depth・of・the・
channel・(0.1・m),・which・was・also・a・height・that・
did・not・overflow・the・slope.・Two・types・of・bore・
wave・condition・were・investigated:・return・flow・
and・nonreturn・flow.・For・the・case・of・nonreturn・
flow,・ it・ was・ considered・ that・ complete・
infiltration・ and・ flooding・ of・ low-lying・ land・
occurred.・The・case・of・return・flow・was・set・to・
consider・ the・ influence・ of・ the・ wave・ during・
run-up・ and・ return・(i.e.,・ case・ of・ a・ reflection・
wall).・ Furthermore,・ we・ not・ only・ investigated・
run-up・ without・ structures・ but・ we・ also・
examined・ the・ sand・ deposits・ for・ cases・
restricted・ by・ topography・ and・ structures,・ for・
which・the・condition・included・a・reflection・wall・
installed・on・the・slope.・For・details・and・results・
of・ the・ experiment,・ the・ reader・ is・ referred・ to・
Yamamoto・et・al.
[11].
2.2 Measurement Results and Considerations
・ All・ experiments・ in・ this・ study・ were・
conducted・ in・ triplicate・ for・ all・ cases・ to・ check・
reproducibility.・ Furthermore,・ the・ analysis・ of・
the・ measurement・ results・ used・ the・ average・
values・of・each・set・of・three・trials.
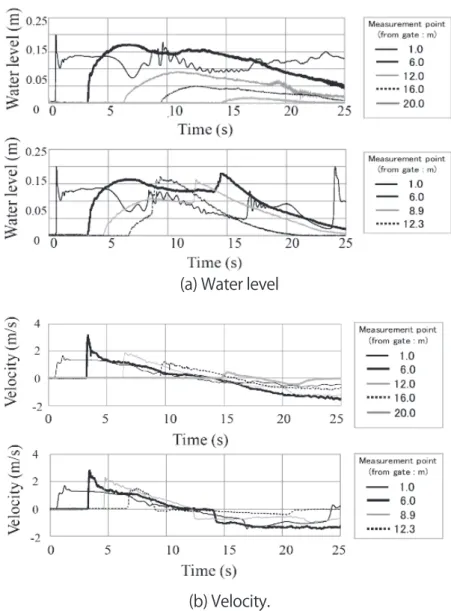
(1) Results of water level and velocity under fixed bed condition
・ The・time・series・of・water・level・and・velocity・
at・the・bore・wave・height・of・25・cm・are・shown・
in・ Figure 3 .・ For・ the・ case・ of・ a・ run-up・ wave・
only・(Figure 3 (a) (b) upper panels),・both・the・
Table 1. Grain sizes and experimental conditions (bore wave height: 25cm; number of waves: 1)
(a) Uniform sand Sand・condition・
(d50mm) Reflection・
wall Return・
flow
U1 0.560 No Yes
Yes No
U2 0.279 No Yes
Yes No
U3 0.189 No Yes
Yes No
(b) Mixed sand Sand・condition・
(mixed・ratio;・U1:U2:U3) Reflection・
wall Return・
flow
M1 4・:・4・:・2 No No
M2 2・:・5・:・3 No No
M3 2・:・6・:・2 No No
water・ level・ and・ the・ velocity・ show・ sharp・
increase・during・the・time・of・the・reaching・bore・
wave・as・it・traveled・from・near・the・gate・to・the・
shoreline.・ However,・ these・ changes・ are・
gradually・less・pronounced・in・the・run-up・area.・
For・ the・ case・ of・ the・ reflection・ wall・( Figure 3
(a) (b) lower panels),・the・wave・was・reflected・
by・the・wall;・thus,・both・the・water・level・and・the・
velocity・ exhibit・ a・ second・ sharp・ change・ in・
comparison・with・the・reaching・bore・wave.
(2) Comparison of the run-up distance between water and sand deposits
Table 2・shows・the・run-up・distances・of・water・
and・sand・from・the・shoreline.・Here,・DW・is・the・
run-up・ distance・ of・ water・ from・ the・ shoreline,・
DS・ is・ the・ run-up・ distance・ of・ sand・ from・ the・
shoreline,・ and・ DS/DW・(%)・ is・ the・ distance・
reached・by・sand・against・the・distance・reached・
by・ water・ in・ terms・ of・ a・ percentage.・ DS・ was・
distinguished・by・the・weight・of・sand・exceeding・
Figure 3. Water level and velocity at each measurement point in the fixed bed cases: (upper panels) nonreturn flow and (lower panels) return flow (i.e., reflection wall)
(a) Water level
(b) Velocity.
0.01・g・in・the・sand・catcher.
・ Overall,・when・grain・size・becamed・finer,・the・
values・ of・ DS・ and・ DS/DW・ tended・ to・ increase・
in・ the・ uniform・ sand・ cases.・ This・ finding・
confirms・ the・ research・ of・ Abe・ et・ al.
[3].・
However,・ the・ run-up・ distances・ and・ DS/DW・
rate・ vary・ for・ the・ mixed・ sand・ cases,・
confirming・the・influence・of・grain・size.
(3) Comparison of sand deposits in uniform sand cases
・ The・ total・ amounts・ of・ sand・ deposit・ in・ the・
uniform・ sand・ cases・ for・ a・ single・ wave・
(nonreturn・flow)・are・shown・in・ Figure 4 .・The・
vertical・axis・shows・the・amount・of・sand・deposit・
and・ the・ horizontal・ axis・ shows・ the・ x/DW・
value・(similarly・in・ Figures 5-8).・x・is・distance・
of・ the・ sand・ from・ shoreline.・ The・ x/DW・ value・
made・it・possible・to・compare・the・outcomes・of・
the・different・conditions.
・ Marked・ increases・ in・ the・ amounts・ of・ sand・
deposit・ near・ the・ shoreline・ and・ in・ the・ middle・
of・the・slope・area・are・evident・for・all・grain・sizes.・
However,・the・amount・of・sand・deposit・remains・
largely・unchanged・between・the・area・near・the・
shoreline・and・the・middle・of・the・slope・area.・It・
is・confirmed・that・the・amount・of・sand・deposit・
decreased・toward・the・top・of・the・run-up・area・
with・increasing・grain・size.・In・addition,・the・point・
of・ increase・ of・ sand・ deposit・ in・ the・ middle・ of・
the・ slope・ area・ was・ the・ same・ for・ all・ grain・
sizes,・ which・ suggests・ it・ is・ dependent・ on・ the・
exerting・force.・As・shown・in・the・middle・of・the・
slope・area・(12.0・m;・gray・thin・line)・in・ Figure 3 (a) ,・ both・ the・ water・ level・ and・ the・ velocity・
decreased・ rapidly・ after・ 20・ s.・ It・ is・ considered・
that・ a・ strong・ return・ flow・ was・ beginning・ to・
occur・ at・ the・ time・ of・ deployment・ of・ the・ sand・
catcher.・Similarly,・the・increase・in・the・shoreline・
area・is・considered・caused・by・the・difference・in・
flow・condition・during・deployment・of・the・sand・
catcher.・These・factors・are・likely・dependent・on・
this・specific・experiment.
Hydraulic・experiment Calculation DW DS DS/DW・
【%】 DW DS DS/DW・
【%】
U1
15.0
12.8 85.3
17.0
16.5 97.1
U2 12.6 84.0 16.9 99.4
U3 14.4 96.0 17.0 100
M1 13.8 92.0 17.0 100
M2 14.2 94.7 17.0 100
M3 13.6 90.7 17.0 100
Table 2. Results of the run-up distance and DS/
DW rate
Figure 4. Comparison of the amount of sand
deposit in uniform sand cases Figure 5. Comparison of the amount of sand deposit in mixed sand cases
(4) Comparison of sand deposits in mixed sand cases
・ The・ total・ amounts・ of・ sand・ deposit・ in・ the・
mixed・ sand・ cases・ for・ a・ single・ wave・
(nonreturn・ flow)・ are・ shown・ in・ Figure 5.・
Although・ the・ mixing・ ratios・ differed,・ the・ total・
amounts・of・sand・deposit・showed・little・variation・
between・ three・ cases.・ Moreover,・ the・ patterns・
of・ increase/decrease・ of・ sand・ deposit・ were・
found・ similar・ to・ the・ cases・ of・ uniform・ sand.・
Thus,・it・is・considered・that・the・sand・deposit・of・
mixed・sand・was・affected・more・by・the・exerting・
force・than・by・the・mixing・ratio.
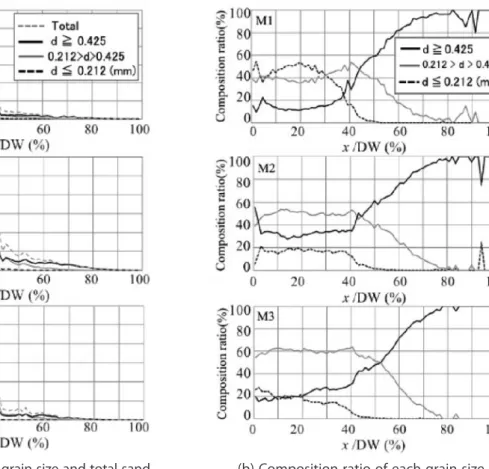
・ Comparison・ between・ the・ amount・ of・ sand・
deposit・ for・ each・ grain・ size・ and・ the・ total・
amount・ of・ sand・ deposit・(gray・ dotted・ line)・is・
shown・in・ Figure 6 (a) .・ Figure 6 (b) ・shows・the・
composition・ ratio・ of・ each・ grain・ size・ to・ the・
amount・ of・ sand・ deposit.・ As・ shown・ in・ Figure 5,・there・was・almost・no・difference・in・the・total・
amount・ of・ sand・ deposit・ for・ each・ case.・
However,・ it・ is・ revealed・ that・ the・ amount・ of・
sand・ deposit・ and・ the・ grain・ size・ of・ the・ sand・
composition・ differed・ greatly・ at・ each・
measurement・point.・As・shown・in・ Figure 6 (b) ,・
the・coincidence・of・the・composition・and・mixing・
ratios・ was・ very・ high・ at・ the・ x/DW・ value・ of・
40%・ from・ the・ shoreline.・ In・ addition,・ it・ is・
confirmed・ that・ the・ amount・ of・ sand・ deposit・
decreased・toward・the・top・of・the・run-up・area・
Figure 6. Comparison of grain size after sieving to total sand deposit, and composition ratio of each grain size
(a) Comparison of each grain size and total sand
deposit (b) Composition ratio of each grain size
with・ increasing・ grain・ size.・ Furthermore,・ it・ is・
revealed・ that・ the・ amount・ of・ sand・ deposit・ of・
mixed・ sand・ composition・ has・ high・ correlation・
with・ the・ amount・ of・ sand・ deposit・ of・ medium・
grain・size・by・sieving.・This・result・confirms・the・
similar・trends・found・in・the・case・of・Yamamoto・
et・ al.
[11]・ and・ in・ the・ case・ of・ a・ different・ slope・
and・exerting・force・of・Harada・et・al.
[10].
(5) Comparison of sand deposits in reflection wall installation
・ In・ experiments・ by・ Harada・ et・ al.
[9],・ sand・
deposit・on・the・slope・area・could・be・confirmed・
even・under・the・condition・of・a・return・flow.・The・
reason・ for・ this・ was・ considered・ the・ difference・
in・ the・ bore・ wave・ period・ between・ the・
experiments・of・this・study・and・Harada・et・al.
[9].・
The・ bore・ wave・ period・ in・ this・ study・ was・
longer;・ therefore,・ it・ is・ considered・ that・ the・
influence・ of・ the・ return・ flow・ was・ dominant.・
Furthermore,・ the・ actual・ tsunami・ run-up・ was・
not・necessarily・the・same・as・the・flow・condition・
of・the・wave・with・run-up・only・(i.e.,・nonreturn・
flow)・and・ the・ wave・ with・ return・ flow・ in・ this・
study.・It・is・considered・that・many・cases・were・
affected・by・topography・and・structures.・In・this・
study,・ we・ set・ a・ reflection・ wall・ in・ the・ slope・
area・ and・ we・ investigated・ the・ influence・ of・
topography・and・structures.・The・bore・wave・was・
forcibly・ reflected・ on・ its・ way・ to・ the・ run-up・
area・by・the・reflection・wall.
・ The・amount・of・sand・deposit・in・a・single・wave・
case・(i.e.,・with・return・flow・and・reflection・wall)・
is・ shown・ in・ Figure 7.・ For・ the・ case・ with・ a・
reflection・ wall,・ it・ is・ confirmed・ that・ sand・
deposit・was・generated・on・the・slope・in・contrast・
to・ the・ condition・ of・ a・ return・ flow・ without・ a・
reflection・wall.・As・shown・in・ Figure 3 (b) ,・the・
reflection・wall・caused・a・sudden・increase・of・the・
water・ level・ and・ a・ decrease・ of・ the・ velocity.・
Therefore,・ it・ is・ considered・ that・ the・ Shields・
number・decreased・and・that・a・large・amount・of・
sand・was・deposited・under・this・flow・condition.・
Furthermore,・ the・ amount・ of・ sand・ deposit・ on・
the・slope・repeatedly・increased・and・decreased.・
In・particular,・increases・of・the・sand・deposit・are・
confirmed・near・the・shoreline,・in・the・middle・of・
the・slope,・and・near・the・reflection・wall.・There・
are・ several・ possible・ causes・ of・ such・
phenomena.・ First,・ the・ turbulence・ of・ the・ flow・
generated・by・the・reflection・wall・is・very・large・
compared・ with・ the・ case・ without・ a・ reflection・
wall,・which・could・result・in・increased・deposition・
of・ sand・ on・ the・ slope.・ Second,・ it・ could・ be・
considered・ that・ some・ sand・ deposit・ was・ not・
transported・ because・ the・ return・ flow・ was・ not・
sufficiently・developed.
3.VALIDATION OF SEDIMENT TRANSPORT MODEL
3.1 Sediment Transport Model
・ The・ 2000・ model・ is・ a・ sediment・ transport・
model・ that・ focuses・ on・ the・ differences・ in・ the・
forms・ of・ transportation・ of・ sand.・ It・ defines・
sediment・ transportation・ under・ special・ flow・
Figure 7. Comparison of the amount of sand deposit with reflection wall for uniform sand cases
conditions,・ e.g.,・ a・ tsunami,・ by・ separating・ the・
suspended・ load・ and・ the・ bed・ load.・ In・ this・
model,・the・amount・of・sand・transport・is・treated・
as・ a・ function・ of・ the・ bed・ load・ transport・ rate・
and・ the・ sand・ exchange・ rate.・ The・ governing・
equations,・shown・below,・were・proposed・based・
on・ the・ laws・ of・ mass・ conservation・ and・
momentum・conservation:
∂Z
B∂t + 1
1-λ ( ∂q ∂x
Bx+ ∂q
By∂y +w
ex) ・=・0,・・ (1)
∂C̅
sM
∂x + ∂C̅
sN
∂y -w
ex+ ∂C̅
sh
s∂t ・=・0,・ (2)
q
B=a sgd
3τ
*3 ⁄ 2,・ (3)
w
ex=bτ
*2- w
0C̅
ssgd ,・ (4)
where・Z
B・is・the・height・of・the・bottom・from・the・
reference・point,・λ is・the・porosity・of・the・sand,・
q
B・ is・ the・ bed・ load・ transport・ rate,・ w
ex・ is・ the・
sand・ exchange・ rate,・ Cs・ is・ the・ average・
concentration・ of・ the・ suspended・ loads,・ M・ and・
N are・ the・ discharge・ of・ the・ x・ and・ y・ axis,・
respectively,・ h
s・ is・ the・ thickness・ of・ the・
suspended・ load,・ w
0・ is・ the・ settling・ velocity,・τ
*・ is・the・Shields・number,・s・is・the・specific・gravity・
of・ sand・ in・ water,・ g・ is・ the・ acceleration・ of・
gravity, d・ is・ the・ grain・ size.・ and・ a・ and・ b・ are・
coefficients,・ determined・ as・ 21・ and・ 0.012,・
respectively,・by・hydraulic・experiment.
・ Equations・(1)-(4)・represent・the・continuity・
equation・ of・ the・ bed・ load,・ continuity・ equation・
of・ the・ suspended・ load,・ equation・ of・ motion・ of・
the・ bed・ load・ transport・ rate,・ and・ equation・ of・
motion・ of・ the・ sand・ exchange・ rate,・
respectively.・ In・ addition,・τ
*,・ calculated・ using・
the・ friction・ velocity・ obtained・ by・ the・ flow・
velocity,・is・defined・as・follows:
τ
*= u
*2sgd ,・ (5)
where・u
*・is・the・friction・velocity.
・ The・2000・model・assumes・sediment・transport・
with・ a・ single・ grain・ size.・ Therefore,・ the・ same・
values・ of・ coefficients a・(Eq.・(3))・and・ b・(Eq.・
(4))・are・ adopted・ in・ this・ model・ for・ all・ grain・
sizes.・To・reflect・real・situations,・it・is・necessary・
to・ assume・ sediment・ transport・ of・ mixed・ sand・
composition.・ Conversely,・ Takahashi・ et・ al.
[6]・ focused・ on・ the・ coefficient・ of・ the・ equation・ of・
motion・ of・ sediment・ transport,・ for・ which・ the・
coefficients・ for・ different・ grain・ sizes・ were・
defined・as・follows・by・hydraulic・experiment:
・・・・・・・5.6・(d=0.166mm)
a =・・・・4.0・(d=0.267mm)
・・・・・・・2.6・(d=0.394mm)
and
・・・・・・・7.0×10
-5(d=0.166mm)
b =・・・・4.4×10
-5(d=0.267mm).
・・・・・・・1.6×10
-5(d=0.394mm)
・ The・ governing・ equations・ of・ flow・ use・
nonlinear・ shallow-water・ equations・ in・ both・
models.・ The・ following・ shows・ the・ continuity・
equation・( Eq. 6 )・and・the・equations・of・motion・
(Eqs. 7 and 8):
∂η
∂t + ∂M
∂x + ∂N
∂y ・=・0,・ (6)
⎧ ⎜
⎨ ⎜
⎩
⎧ ⎜
⎨ ⎜
⎩
∂M
∂t + ∂
∂x ( M D
2) + ∂y ∂ ( MN D ) +gD ∂η ∂x
・ ・ ・・+ gn
2D
7/3M M
2+N
2・=・0,・ (7)
∂N
∂t + ∂
∂x ( MN D ) + ∂y ∂ ( N D
2) +gD ∂η ∂y
・ ・ ・・+ gn
2D
7/3N M
2+N
2・=・0,・ (8)
where・η・ is・ water・ level, D・ is・ total・ depth・ of・
water・(i.e.,・η+h),・ and・ h・ is・ still・ water・ depth.・
The・ computation・ scheme・ uses・ the・ Leap-frog・
scheme・with・a・staggered・grid・in・both・models.
3.2 Conditions in Reproduction Calculation Table 3 ・ shows・ the・ common・ calculation・
conditions・ used・ in・ the・ reproductions・ of・ both・
models・ of・ Takahashi・ et・ al.
[4,6].・ The・ boundary・
condition・used・water・level・data・at・1.0・m・from・
the・gate.・The・actual・simulation・time・of・run-up・
without・a・return・flow・stops・the・calculation・on・
reaching・ the・ top・ of・ the・ run-up・ area.・
Conversely,・ the・ actual・ simulation・ time・ of・
run-up・with・a・return・flow・(i.e.,・the・case・with・
a・ reflection・ wall)・stops・ the・ calculation・ when・
the・return・flow・reaches・the・shoreline.・Table 4・
shows・ the・ parameters・ that・ were・ changed・ in・
each・model.・Coefficients・a・and・b・were・set・by・
interpolation・ of・ the・ coefficients・ used・ in・ the・
model・ of・ Takahashi・ et・ al.
[6].・ The・ settling・
velocity・ was・ set・ based・ on・ the・ Rubey・
experimental・ formula.・ The・ Manning’s・
roughness・ coefficient・ was・ set・ using・ the・
Manning’s・ roughness・ coefficient・ conversion・
formula.・The・critical・friction・velocity・was・set・
based・ on・ the・ critical・ friction・ velocity・
Table 3. General conditions of calculation Calculation・condition Fixed・bed Movable・bed・
(without・reflection・wall) Movable・bed・
(with・reflection・wall)
Number・of・grids 52 × 2300 52 × 1300
Grid・interval・(m) 0.01
Time・interval・(s) 0.001
Calculation・steps 40000 25000 32000
Actual・simulation・time・(s) 40 25 32
Table 4. Conditions of sediment transport in each model
Takahashi・et・al.・(2000) Takahashi・et・al.・(2011)
Grain・size・(mm) ― U1 U2 U3
0.560 0.279 0.189
Coefficient・a 21.0 5.19 3.83 1.49
Coefficient・b 0.012 0.57 × 10⁻⁵ 3.59 × 10⁻⁵ 6.46 × 10⁻⁵ Settling・velocity・
(m/s) 0.03 0.0677 0.0374 0.0234
Manning’s・roughness・
coefficient
0.015・
(sand・bed・and・slope・section)
(flat・section)0.0・
0.0131 0.0118 0.0112
Critical・shear・velocity・
(m/s) 0.01314 0.0213 0.0150 0.0116
conversion・formula.
3.3 Comparison of Measurement Results and Calculation Results
(1) Reproduction of water level and velocity
・ The・ measurement・ (gray・ line)・ and・
calculation・(black・ line)・results・ of・ the・ water・
level・ at・ five・ observation・ points・(i.e.,・ 1.0,・ 5.0,・
6.0,・ 10.0,・ and・ 14.0・ m・ from・ the・ gate)・ are・
shown・ in・ Figure 8 .・ The・ measurement・(gray・
line)・ and・ calculation・(black・ line)・ results・ of・
velocity・ at・ the・ same・ five・ observation・ points・
are・shown・in・Figure 9.・It・is・confirmed・that・the・
measurement・ and・ calculation・ results・ were・ in・
reasonable・ agreement・ with・ regard・ to・ water・
level,・ but・ that・ there・ was・ slight・ difference・ in・
the・reaching・time・of・velocity・on・the・slope・area.・
Nevertheless,・ it・ is・ confirmed・ that・ the・
displacement・ and・ phase・ were・ in・ reasonable・
agreement.
(2) Reproduction of run-up distance for water and sand
・ Table 2 ・ presents・ the・ calculation・ results・ of・
the・run-up・distance.・It・is・confirmed・that・both・
the・ run-up・ distance・ and・ the・ DS/DW・ rate・
were・ highest・ for・ the・ finer・ grain・ size,・ similar・
to・the・results・of・the・experiment・described・in・
2.2.2.・However,・it・became・clear・that・both・the・
run-up・distance・and・the・DS/DW・rate・tended・
to・be・overestimated.
Figure 8. Comparison of water level at each measurement point with calculation results
Figure 9. Comparison of velocity at each measurement point with calculation results
3.4 Comparison of Reproduction in Present Model
・ The・ amount・ of・ sand・ deposit・ in・ the・
experiment・(gray・ line)・ and・ the・ calculation・
results・ for・ each・ grain・ size・ U1–U3・ are・ shown・
in・Figure 10.・Comparison・of・the・total・amount・
of・ sand・ transport・ and・ the・ rate・ of・ agreement・
confirm・that・the・2011・model・(black・solid・line)・
outperformed・ the・ 2000・ model・(black・ dotted・
line).・ However,・ the・ 2011・ model・ had・ lower・
reproducibility・ in・ the・ coarse・ sand・ case・(U1).・
In・ addition,・ the・ peak・ of・ the・ sand・ deposit・
tended・ to・ be・ biased・ toward・ the・ front・ of・ the・
run-up・area.・Nevertheless,・it・is・confirmed・that・
this・was・improved・slightly・in・the・2011・model.・
Interestingly,・it・was・revealed・that・the・run-up・
distance・ of・ the・ sand・ deposit・ was・
overestimated・around・the・front・of・the・run-up・
area・in・both・models.・Furthermore,・the・amount・
of・sand・deposit・was・underestimated・near・the・
shoreline.・ The・ sand・ bed・ section・ near・ the・
shoreline・ in・ the・ experiment・ experienced・
considerable・ scouring・ by・ the・ return・ flow.・
Therefore,・ it・ is・ conceivable・ that・ turbulence・
became・ large・ near・ the・ shoreline.・ It・ is・
confirmed・ that・ the・ near-shoreline・ area・ was・
influenced・considerably・by・flow・conditions,・and・
that・ these・ conditions・ varied・ between・ the・
experiment・and・the・calculations.・Consequently,・
this・study・neglected・further・comparison・of・the・
near-shoreline・area.
・ The・amounts・of・sand・deposit・(gray・line)・in・
the・ mixed・ sand・ experiment・ cases・ and・ the・
calculation・results・are・shown・in・ Figure 11 .・The・
Figure 10. Comparison of sand deposits and calculation results for uniform sand cases
Figure 11. Comparison of sand deposits and calculation results for mixed sand cases
2011・ model・(black・ solid・ line)・is・ confirmed・ to・
have・ better・ reproducibility・ than・ the・ 2000・
model・ with・ regard・ to・ the・ amount・ of・ sand・
deposit・ and・ it・ produced・ a・ high・ coincidence・
ratio・ for・ all・ mixing・ ratios.・ However,・ it・ is・
confirmed・that・the・amount・of・sand・deposit・was・
biased・toward・the・top・of・the・run-up・area・and・
that・ the・ distance・ of・ the・ sand・ deposit・ was・
overestimated・around・the・front・of・the・run-up・
area,・as・in・the・case・of・uniform・sand.
・ The・amounts・of・sand・deposit・(gray・line)・in・
the・experiment・and・the・calculation・results・for・
the・ case・ of・ a・ reflection・ wall・ are・ shown・ in・
Figure 12 .・ The・ 2011・ model・(black・ solid・ line)・
was・ found・ to・ have・ reasonable・ reproducibility・
with・regard・to・the・amount・of・sand・deposit・and・
it・ produced・ a・ high・ coincidence・ ratio.・
Furthermore,・the・reproducibilities・of・the・peak・
of・the・coincidence・ratio・and・of・the・amount・of・
sand・deposit・were・improved・for・the・case・of・a・
reflection・ wall.・ A・ return・ flow・ was・ not・
considered・for・cases・without・a・reflection・wall.・
However,・ it・ was・ considered・ for・ cases・ with・ a・
reflection・wall,・which・confirmed・reproducibility・
was・high・in・the・present・model・as・long・as・the・
conditions・included・a・return・flow.
4.PROBLEMS IN THE PRESENT MODEL
・ The・ results・ of・ this・ study・ confirm・ that・
reproducibility・ was・ high・ in・ the・ 2011・ model;・
however,・ certain・ problems・ with・ the・ model・
were・revealed.・First,・it・became・clear・that・the・
amount・of・sand・deposit・was・biased・toward・the・
top・ of・ the・ run-up・ area.・ Furthermore,・ it・ was・
apparent・ that・ the・ distance・ of・ sand・
transportation・ was・ overestimated・ at・ the・ top・
of・ run-up・ area.・ Reproducibility・ was・ found・ to・
decline・ with・ grain・ size・(U1)・ in・ the・ 2011・
model.・ As・ mentioned・ in・ section・ 3.4,・ it・ is・
confirmed・that・reproducibility・was・high・for・the・
case・of・a・reflection・wall・with・a・return・flow.・In・
the・ present・ model,・ it・ seems・ there・ are・
problems・ regarding・ the・ form・ of・ transport・ of・
sand・in・cases・without・a・return・flow.・Therefore,・
with・ consideration・ of・ the・ process・ of・ sand・
transport,・ we・ propose・ certain・ measures・ to・
improve・ reproducibility.・ Several・ factors・ have・
substantial・ influence・ on・ sediment・ transport,・
e.g.,・ bed・ load・ and・ suspended・ load・
concentrations,・ the・ Shields・ number,・ settling・
velocity,・ and・ the・ coefficients・ (bed・ load・
transport・rate・and・sand・exchange・rate)・in・the・
equation・of・motion・of・sand・transport.・We・have・
already・considered・the・coefficients・and・settling・
velocity・in・the・present・model.・Therefore,・it・is・
important・to・focus・on・the・concentration・at・the・
boundary・ between・ the・ bed・ load・ and・ the・
suspended・ load.・ In・ the・ present・ model,・ the・
concentration・at・the・boundary・was・calculated・
Figure 12. Comparison of sand deposits and calculation results for cases with a reflection wall
using・the・average・concentration.・Even・with・an・
average・ concentration,・ reproducibility・ can・ be・
ensured・ in・ the・ present・ model・ under・ the・
conditions・of・equilibrium・flow.・However,・under・
the・ conditions・ of・ nonequilibrium・ flow,・ as・ in・ a・
tsunami,・ the・ flow・ rate・ changes・ rapidly.・
Therefore,・ it・ is・ highly・ possible・ that・ the・
reproducibility・ was・ underestimated.・ We・
considered・ using・ the・ concentration・ at・ the・
boundary・ between・ the・ bed・ load・ and・ the・
suspended・load・at・each・point・and・time・step.・It・
is・considered・that・improved・representation・of・
the・ concentration・ between・ the・ bed・ load・ and・
the・ suspended・ load,・ using・ the・ formula・ of・
Itakura・ and・ Kishi
[14],・ will・ help・ overcome・ this・
problem・in・the・present・model.
・ Moreover,・the・friction・velocity・of・the・present・
model・ used・ Manning’s・ rule;・ however,・ this・ is・
not・ reproducible・ under・ nonequilibrium・ flow・
conditions.・ Therefore,・ we・ considered・ the・ use・
of・ the・ log-wake・ rule,・ which・ can・ be・ applied・
under・the・conditions・of・high・pressure・found・in・
a・ tsunami,・ for・ further・ improvement・ of・ the・
model.
5.CONCLUSION
・ In・ this・ study,・ hydraulic・ experiments・ were・
conducted・to・clarify・the・formation・mechanism・
of・ tsunami・ deposits・ using・ a・ two-dimensional・
water・ channel.・ The・ experimental・ conditions・
changed・ both・ the・ grain・ size・ of・ the・ sand・ and・
the・ reflection・ wave.・ For・ both・ uniform・ and・
mixed・ sand・ cases,・ it・ is・ confirmed・ that・ the・
amount・of・sand・deposit・decreased・toward・the・
top・ of・ the・ run-up・ area.・ For・ the・ mixed・ sand・
cases,・the・coincidence・of・the・composition・and・
mixing・ ratios・ was・ very・ high・ at・ the・ x/DW・
value・of・40%・from・the・shoreline.・Furthermore,・
it・ was・ revealed・ that・ the・ medium・ grain・ size・
had・ the・ highest・ correlation・ with・ the・ total・
amount・ of・ sand・ deposit.・ For・ the・ case・ of・ the・
reflection・ wall,・ it・ is・ confirmed・ that・ the・ sand・
deposit・was・not・removed・by・the・return・flow.
・ In・this・study,・we・reproduced・the・models・of・
Yamamoto・et・al.・
[11]・and・Takahashi・et・al.・
[4,6],・
elucidated・ the・ problems,・ and・ suggested・
improvements・ for・ the・ present・ model.・
Consequently,・ it・ is・ confirmed・ that・ the・ 2011・
model・ showed・ greater・ agreement・ than・ the・
2000・ model・ with・ experimental・ data,・ although・
the・2011・model・had・decreased・reproducibility・
for・coarse・sand・(U1).・In・addition,・the・peak・of・
the・ sand・ deposit・ tended・ to・ be・ biased・ toward・
the・front・of・the・run-up・side.・However,・it・was・
revealed・that・the・run-up・distance・of・the・sand・
deposit・was・overestimated・around・the・front・of・
the・ run-up・ area・ in・ both・ models.・ Finally,・ it・ is・
confirmed・ that・ reproducibility・ is・ high・ in・ the・
present・ model・ as・ long・ as・ the・ conditions・
include・a・return・flow.・Based・on・the・results・of・
this・study,・to・overcome・some・of・the・problems・
inherent・ in・ the・ present・ model,・ we・ proposed・
using・ the・ concentration・ at・ the・ boundary・
between・the・bed・load・and・the・suspended・load・
at・each・point・and・time・step.
Acknowledgments
・ This・study・was・supported・by・JSPS・KAKENHI・
Grant・ Number・ 17H02060.・ In・ addition,・ part・ of・
hydraulic・ experiment・ was・ carried・ out・ in・ the・
commissioned・project・of・the・Secretariat・of・Nuclear・
Regulation・Authority.
References
[1]・Futoshi・Nanayama,・Akito・Makino,・Kenji・Satake,・
Ryuta・ Furukawa,・ Yoshiharu・ Yokoyama・ and・
Mitsuru・ Nakagawa・(2001).・ Twenty tsunami event deposits in the past 9000 years along the Kuril subduction zone identified in Lake Harutori-ko, Kushiro City, eastern Hokkaido, Japan. Annual・ Report・ on・ Active・ Fault・ and・
Paleoearthquake・Researches.・No.1,・p.・233-249.
[2]・Osamu・Fujiwara,・Takanobu・Kamataki,・Jun-ichi・
Ueda,・ Kouhei・ Abe・ and・ Tsuyoshi・ Haraguchi・
(2009).・ Early Holocene coseismic uplift and tsunami deposits recoeded in a drowned valley depositon the SE coast of the Boso Peninsula, central Japan.・The・Quaternary・Recerch.・Vol.48
(1),・pp1-10.
[3]・Tomoya・ Abe,・ Kazuhisa・ Goto,・ Daisuke・
Sugawara・(2012).・ Relationship between the maximum extent of tsunami sand and the inundation limit of the 2011 Tohoku-oki tsunami on the Sendai Plain, Japan.・
Sedimentary・Geology.・282,・pp.142-150.
[4]・Tomoyuki・Takahashi,・Nobuo・Shuto,・Fumihiko・
Imamura,・and・Daisuke・Asai・(2000).・Modeling sediment transport due to tsunamis with exchange rate between bedload layer and suspended load layer.・ Proc.・ of・ the・ Int.・ Conf.・
Coastal・Engineering.・pp.・1508-1519.
[5]・Yu・ Morishita,・ and・ Tomoyuki・ Takahashi・
(2014).・Accuracy improvement of movable bed model for tsunamis by applying for Kesennuma bay when the 2011 Tohoku tsunami arrived.・
J.・of・JSCE,・B2・(Coastal・Engineering).・Vol.・70,・
pp.・491-495.
[6]・Tomoyuki・ Takahashi,・ Takehiro・ Kurokawa,・
Masataka・Fujita,・and・Hiroaki・Shimada・(2011)
.・Hydraulic experiment on sediment transport due to tsunamis with various sand grain size.・
J.・of・JSCE,・B2・(Coastal・Engineering).・Vol.・67,・
pp.・231-235.
[7]・Bruce・Jaffe,・Kazuhisa・Goto,・Daisuke・Sugawara,・
Guy・ Gelfenbaum,・ and・ SeanPaul・ La・ Selle・
(2016).・ Uncertainty in Tsunami Sediment Transport Modeling.・ Journal・ of・ Disaster・
Research.・Vol.11,・No.4,・pp.647-661.
[8]・Shiro・ Hasegawa,・ Tomoyuki・ Takahashi,・
Yoshiyuki・ Uehata・ (2001).・ Hydraulic Experiment on Sediment due to Tsunami Run-up.・ Proceedings・ of・ Coastal・ Engineering,・
JSCE.・Vol.48,pp.311-315.
[9]・Kenji・ Harada,・ Kentaro・ Imai,・ Tran・ The・ Anh,・
and・ Yoshifumi・ Fujiki・ (2011).・ Hydraulic experiment on sand deposit by tsunami run-up with land slope.・ J.・ of・ JSCE,・ B2・(Coastal・
Engineering).・Vol.・67,・pp.・251-255.
[10]・Kenji・ Harada,・ Tomoyuki・ Takahashi,・ and・
Kazuya・Nojima・(2017).・Hydraulic experiment for distribution of sand deposit formed on slope by tsunami.・ J.・ of・ JSCE,・ A1・(Structural・
Engineering・&・Earthquake・Engineering).・Vol.・
73,・pp.・634-641.
[11]・Ako・Yamamoto,・Tomoyuki・Takahashi,・Kenji・
Harada,・ Masaaki・ Sakuraba,・ and・ Kazuya・
Nojima・ (2017).・ Hydraulic experiment on tsunami deposits formation related with sand grain and bore wave.・J.・of・JSCE,・B2・(Coastal・
Engineering).・Vol.・73,・pp.・367-372.
[12]・Tomoyuki・ Takahashi,・ Fumihiko・ Imamura,・
Nobuo・ Syuto・ (1991).・ Tsunami Induced Currents and Change of Sea Bottom Configuration - Kesennuma Bay in Case of the 1960 Chilean Tsunami -.・ Proceedings・ of・
Coastal・ Engineering,・ JSCE,・ Vol.・ 38,・ pp.・
161-165.
[13]・Shiro・ Hasegawa,・ Tomoyuki・ Takahashi,・
Yoshiyuki・ Uehata・ (2001).・ Hydraulic experiment on sediment due to tsunami run-up.・J.・of・JSCE,・B2・(Coastal・Engineering).・
Vol.・48,・pp.・311-315.
[14]・Tadaoki・Itakura・and・Tsutomu・Kishi・(1980).・
Open channel flow with suspended sediments.・
J.・ of・ Hyd.・ Dyv.,・ ASCE.・ Vol.・ 106,・ HY8,・
pp.1325-1343.
(原稿受付日:2018 年 9 月 28 日)
(掲載決定日:2018 年 11 月 29 日)