カーボンナノチューブ光触媒
を利⽤した⼈⼯光合成技術
岡⼭⼤学 ⼤学院環境⽣命科学研究科
研究教授 ⾼⼝ 豊
2020年9⽉17⽇(⽊)14:30〜14:55
1
岡⼭⼤学⼤学院環境⽣命科学研究科 ⾼⼝ 豊
⼈⼯光合成 = 光エネルギーを化学エネルギーに変換する反応
2
本多・藤嶋効果
(1972)
H
2
O
O
2
C.B.
V.B.
e
-h
+
H
2
H
+
Pt
2H
2
O
ΔG = +237 kJ/mol
2H
2
+ O
2
TiO
2
光触媒粒⼦
CH
4
+ 2O
2
→ CO
2
+ 2H
2
O
ΔG = 847 kJ/mol
同じ光触媒反応でも
有機物分解反応とは異なる
副⽣⽔素や⽔蒸気改質などによる⽔素製造⽅法では、
⽔素1トンあたり 10トン以上の CO
2
を排出
水素社会を構築する上での根本的な課題は、
安価で大量のCO
2
フリー水素を安定供給すること。
パリ協定に基づく成長戦略としての長期戦略(2019年6月11日閣議決定)
エネルギー的に登り坂(アップヒル)な反応を使って化学エネルギーを得る
現行技術の課題
太陽光水素製造技術
(実用化できていない)
VS
岡⼭⼤学⼤学院環境⽣命科学研究科 ⾼⼝ 豊
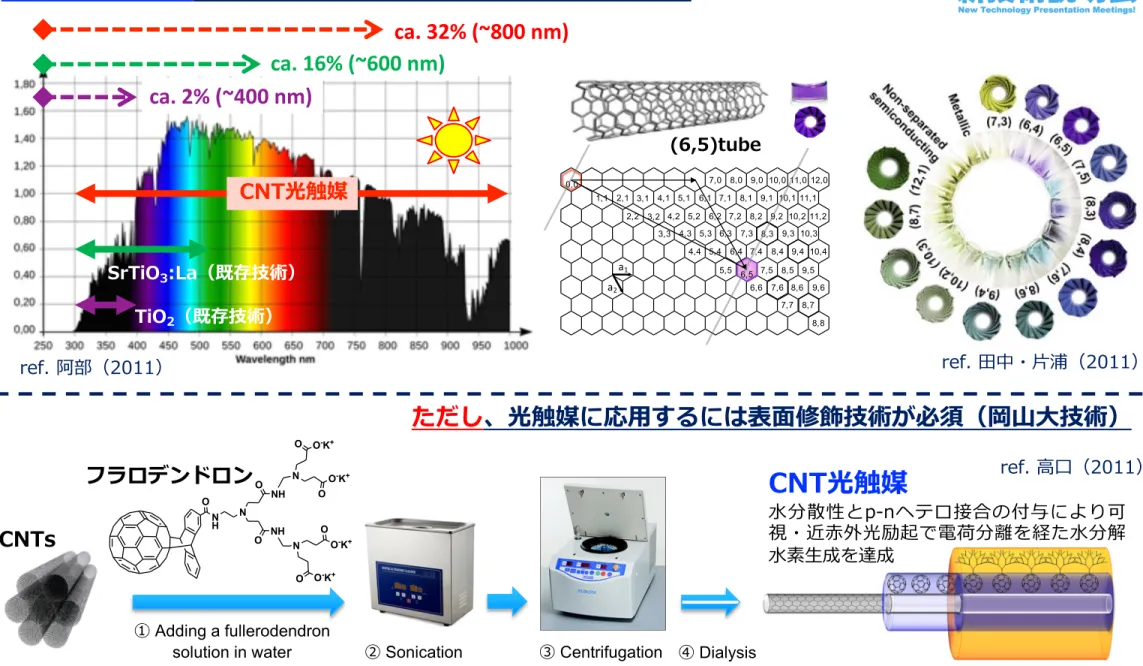
ありふれた元素で光触媒の活性波⻑域を拡⼤する技術が求められている
3
太陽光⽔素製造コスト
= ⽔の価格 ✕ 太陽光エネルギー⽔素変換効率(STH)✕ 装置価格(含 ランニングコスト)
⽬標値︓⽔素ステーション引き渡し価格 100円/Nm
3
(2030年)
製造コスト 30円/Nm
3
(2030年)→ 20円/Nm
3
→ 13.3円/Nm
3
(2050年)
現状は、
褐炭を原料として400~500円/Nm
3
太陽光⽔素で、1000円以上/Nm
3
太陽光⽔素製造装置に許される価格は12,000円/m
2
以下
現状、唯⼀実現可能性があるのは光触媒シート
(refs. 堂免ら 2019, 2017, 2016)
部品点数の多い太陽電池を⽤いての実現は困難
課題
1. 活性波⻑域が530 nm以下と狭く、STHが1%程度と低い → ⽬標値 10%
2. 希少元素の使⽤量を極⼒削減し、触媒の安定⼤量供給を可能にする必要がある
岡⼭⼤学⼤学院環境⽣命科学研究科 ⾼⼝ 豊
半導体性カーボンナノチューブを⽔素発⽣光触媒として利⽤する
4
0,0 7,0 8,0 9,0 10,0 11,0 12,0 1,1 2,1 3,1 4,1 5,1 6,1 7,1 8,1 9,1 10,1 11,1 2,2 3,2 4,2 5,2 6,2 7,2 8,2 9,2 10,2 11,2 3,3 4,3 5,3 6,3 7,3 8,3 9,3 10,3 4,4 5,4 6,4 7,4 8,4 9,4 10,4 5,5 7,5 8,5 9,5 6,6 7,6 8,6 9,6 7,7 8,7 8,8 a1 6,5 a2DOS
Energy
E
11(970 nm)
E
22(560 nm)
V
1V
2C
2C
1suggesting that all adsorbable nanotubes had been separated. In Figure 3a and b, we present the optical absorption spectra and PL maps of the seven separated (n, m) single species, which are indicated in the chiral map (Figure 3d). Because of their different optical absorption wavelengths, each of the sorted (n, m) species exhibited a distinct color (Figure 3c). The separation indices for the (n, m) SWCNTs were identical to
those obtained using the overloading method,17in which the
separation index is primarily determined by the largest of the three C−C bond curvatures. This result suggests that the effect of temperature on the adsorbability of SWCNTs onto the gel is also strongly dependent on the bond curvature.
The purity of the (n, m) fractions separated by temperature-controlled gel chromatography was evaluated using the
Figure 3. Characterization of the purest (n, m) single-chirality fractions separated at different temperatures (corresponding to Col 1 fractions in Figure 2 and Figure S7 (Supporting Information)). (a) Optical absorption spectra normalized at S11peaks, shifted vertically for comparison and ranked according to the separation index. (b) Photoluminescence (PL) spectral maps. (c) The solution pictures and corresponding structural models. (d) Location on a chiral map. The optical absorption spectrum and PL map of the initial HiPco-SWCNTs are shown in a and b for comparison.
Table 1. Evaluation of the Chirality Purity of the Sorted (n, m) SWCNT Fractions
(n, m) (6, 4) (6, 5) (7, 5) (8, 3) (8, 4) (7, 6) (8, 6) separation temperature (°C) 10 12 14 15 16 20 26 purest fractiona Col 1 Col 1 Col 1 Col 1 Col 1 Col 1 Col 1
purity (%) present technique 66 91 58 52 71 73 65 two-step method17 46 93 88 56 63 94 89
aCol = Column.
Nano Letters Letter
dx.doi.org/10.1021/nl400128m | Nano Lett. 2013, 13, 1996−2003
1999
(6,5)tube
ref. ⽥中・⽚浦(2011)
CNTs
① Adding a fullerodendron
solution in water
③ Centrifugation
N H O N NH NH O O N O-K+ O-K+ O O N O-K+ O-K+ O O