Prognosis after Lower Extremity Amputation in Patients with Diabetes
Keiko ASAO , Masato MATSUSHIM A, Keishi MARUM O, Mitsuru UCHIDA, and Hidesuke SHIM IZU
Division of Diabetes and Endocrinology, Department of Internal Medicine, The Jikei University School of Medicine
Department of Public Health and Environmental Medicine, The Jikei University School of Medicine
Department of General Medicine, The Jikei University School of Medicine Department of Orthopedics, The Jikei University School of Medicine
Department of Plastic and Reconstructive Surgery, The Jikei University School of Medicine
ABSTRACT
Objectives: To evaluate rates of mortality and second lower extremity amputation (LEA) in patients with diabetes and to investigate predictors of survival and second LEA.
Design : A hospital‑based retrospective cohort study.
Patients: Forty‑two patients with diabetes who had undergone LEA and 168 who had not at three university hospitals in Japan from 1993 through 1998.
Methods: Follow‑up until January 1, 2000, with clinical information abstracted from medical records.
Results: The patients who had undergone LEA were 31 men and 11 women with a mean age of 65.2 years and an average duration of diabetes of 19.4 years. During follow‑up,13 patients died and 13 underwent a second LEA. The crude mortality and second‑LEA rates per 1,000 patient‑
years were 112.5 (95% confidence interval: 51.3 to 173.7) and 257.8 (147.6 to 368.1), respectively.
The standardized mortality ratio was 5.4 (2.9 to 9.3). Life‑table analysis showed that 1‑year cumulative risks of death and second LEA were 20.0% (7.6% to 32.4%)and 27.6% (12.9% to 42.2%), respectively. Multivariate Cox proportional hazard models showed hazard ratios of death of 5.1 (2.3 to 11.2),unadjusted,and 4.2 (1.7 to 10.2),adjusted,for age,sex,and known duration of diabetes, and 4.0 (0.9 to 17.3)further adjusted for a significant potential confounder among patients who had undergone LEA compared with those who had not. The co‑morbidity remaining in the model was a history of stroke, with a relative risk of 4.6 (1.3 to 16.4). Mortality in patients undergoing LEA was significantly higher for those 60 years or older and those with a history of stroke. The second‑
LEA rate was significantly higher for patients receiving dialysis and patients with a history of stroke.
Conclusions: Patients with diabetes are at high risk for LEA. Primary prevention of LEA is
extremely important. (Jikeikai Med J 2003; 50: 131‑40)
Key words: amputation, diabetic foot, mortality, second amputation
Received for publication, June 9, 2003
浅尾 啓子,松島 雅人,丸毛 啓史,内田 満,清水 英佑
Mailing address: Keiko ASAO, Division of Diabetes and Endocrinology, Department of Internal Medicine, The Jikei University School of Medicine, 3‑25‑8, Nishi‑Shimbashi, Minato‑ku, Tokyo 105‑8461, Japan.
Email: keasao@jikei.ac.jp
131
INTRODUCTION
An estimated 6.9 million Japanese have diabetes . Although some studies have found a low incidence of lower extremity amputation (LEA) in Japanese patients with diabetes , LEA severely decreases patientsʼ quality of life. Outcomes in Japanese patients who have undergone LEA have been stud- ied , but the rate of second LEA and its predictors have not been well documented. The aims of this study were to evaluate mortality and rates of second LEA in patients with diabetes and to investigate predictors of survival and of second LEA.
RESEARCH DESIGN AND METHODS
Subjects
The setting of this study was three hospitals affiliated with The Jikei University School of Medi-
cine. Forty‑two patients with diabetes who under- gone LEA once were identified through a review of all 24,910 operation records of the divisions of orth- opedics and the divisions of plastic and reconstructive surgery in these hospitals from January 1993 through June 1998. The level of LEA was classified as fol-
lows: digits other than the great toe, the great toe, through metatarsals, transmetatarsal joints, through the ankle or the tarsus, below the knee, through the knee, above the knee, and the hip and hindquarter.
“Major amputation” was defined as amputation through the ankle or tarsus or above. Amputations were major in 25 patients and minor in 17 patients.
History of diabetes was determined by a review of operation records and medical records.
A total of 18,934 patients with diabetes who had visited the outpatient clinic of the three hospitals at least once in the same year as the LEAs were perfor- med were extracted,with permission of the university hospital, from electronic hospital records for insur- ance claims. Diabetes was confirmed by medical records. Patients who had undergone LEA were excluded. Of these patients with diabetes, 168 were randomly selected to yield a 1‑to‑4 ratio for compari- son with 42 patients who had undergone LEA.
Prognostic factors
The duration of diabetes,treatments for diabetes,
the presence of diabetic complications, and co‑mor- bidities, including hypertension, coronary artery dis- ease, and stroke, were abstracted from the medical records. Diabetic retinopathy was classified as the progression of retinopathy to proliferative diabetic retinopathy or as worse. Diabetic nephropathy was classified as requiring dialysis or not. Diagnoses of hypertension, coronary artery disease, and stroke were recorded. For patients who had not undergone LEA, information about diabetic complications was collected from medical records from within 1 year of the LEA in the corresponding patient ; information about co‑morbidities was collected from when the corresponding individuals received LEA.
Follow‑up
To study rates of mortality and second LEA,
follow‑up was ended on the date of target events or on January 1, 2000, whichever was earlier. Information regarding whether the patient was alive or had under- gone a second LEA was retrieved from medical records. If patients had transferred to other hospi- tals or clinics or had not visited the hospitals before January 1,2000 for follow‑up,they were sent a questi-
onnaire asking about their present health status.
Follow‑up was completed for all subjects. To avoid ties in failure time,patients not undergoing LEA were randomly assigned a starting date for follow‑up in the year when the corresponding patients underwent LEA.
The second‑LEA rate included only second LEAs but not later ones, regardless of whether they were ipsilateral or contralateral.
Statistical analysis
Rates of mortality and second LEA were calcu-
lated as the numbers per 1,000 patient‑years.
Patient‑years were calculated from the date of the first LEA to the closing date. Crude mortality rates were calculated for patients who had and had not undergone LEA. The standardized mortality ratios
for both groups were also calculated for comparison with the mortality rate of the general Japanese popu- lation in 1995 . The rates and ratios were calculated with a 95% confidence interval (CI). Life table analyses and log‑rank tests were used.
To examine predictors of death and second LEA, log‑rank tests were performed for variables of demo- graphic characteristics, diabetic complications, and co‑morbidities. Variables to be included in the final Cox model were selected with a stepwise procedure.
Statistical analysis of data was done with the SAS computer package(SAS Institute,Inc.,Cary,NC, USA) . The level of statistical significance was set at the type I error of 0.05.
RESULTS
Patient characteristics
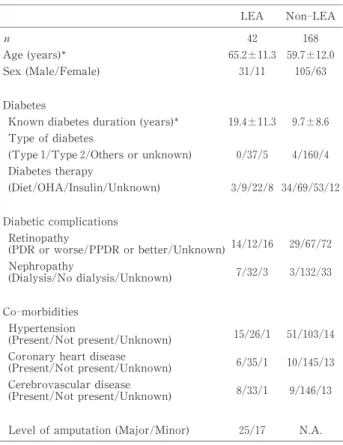
The 42 patients who had undergone LEA were 31 men and 11 women. The mean age and known diabetes duration at the start of follow‑up were 65.2 years and 19.4 years,respectively. Patients who had undergone LEA tended to be older,to be males,and to have a shorter duration of known diabetes than did patients who had not undergone LEA (Table 1).
Mortality and second‑LEA rates
Of the 42 patients who had undergone LEA, 13
died and 13 underwent a second LEA (Table 2)in the 115.6 patient‑years of follow‑up for survival and the 81.4 patient‑years of follow‑up for second LEA. For patients who had undergone LEA,the crude mortality
Table 2. Mortality and second‑LEA rates
Mortality LEA
(n=42) No LEA (n=168) Observed patient‑years for survival 115.6 542.5 Survival Status (Alive/Deceased/Unknown) 29/13/0 155/13/0
Crude mortality rates (/1,000 patient‑years) 112.5 (51.3‑173.7) 22.1 (9.6‑34.6) Adjusted mortality rates (/1,000 patient‑years) 132.8 (14.5‑251.1) 23.0 (10.5‑35.5) Standardized mortality ratio 5.4 (2.9‑9.3) 1.4 (0.8‑2.5)
Second LEA
Observed patient‑years for second LEA 81.4 N.A.
Second LEA (Yes/No/Unknown) 15/27/0 N.A.
Laterality (Ipsilateral/Contralateral) 9/4 N.A.
Second‑LEA rate (/1,000 patient‑years) 257.8 (147.6‑368.1) N.A.
95% CI
Table 1. Patient characteristics
LEA Non‑LEA
n 42 168
Age (years) 65.2±11.3 59.7±12.0
Sex (Male/Female) 31/11 105/63
Diabetes
Known diabetes duration (years) 19.4±11.3 9.7±8.6 Type of diabetes
(Type 1/Type 2/Others or unknown) 0/37/5 4/160/4 Diabetes therapy
(Diet/OHA/Insulin/Unknown) 3/9/22/8 34/69/53/12
Diabetic complications Retinopathy
(PDR or worse/PPDR or better/Unknown)14/12/16 29/67/72
Nephropathy
(Dialysis/No dialysis/Unknown) 7/32/3 3/132/33
Co‑morbidities Hypertension
(Present/Not present/Unknown) 15/26/1 51/103/14
Coronary heart disease
(Present/Not present/Unknown) 6/35/1 10/145/13
Cerebrovascular disease
(Present/Not present/Unknown) 8/33/1 9/146/13
Level of amputation (Major/Minor) 25/17 N.A.
mean±S.D.; OHA : Oral hypoglycemic agent ; PDR : proliferative diabetic retinopathy; PPDR : pre- proliferative diabetic retinopathy
and second‑LEA rates for the entire follow‑up period were 112.5 (95% C.I : 51.3 to 173.7)and 257.8 (147.6 to 368.1), respectively, per 1,000 patient‑years. The standardized mortality ratios were 5.4 (2.9 to 9.3)
(Table 2). Life‑table analysis showed that the cumu- lative risks of death were 20.0% (7.6% to 32.4%)and 33.8% (18.7% to 48.8%),and those of second LEA were 27.6% (12.9% to 42.2%) and 43.2% (25.3% to 61.1%),
respectively, for 1 and 3 years of follow‑up (Fig.1).
To exclude postsurgical mortality,the same ana- lyses were performed excluding the 30 days immedi- ately after the first LEA. The crude mortality rate and the second‑LEA rate more than 30 days after the
first LEA were 98.1 (40.1 to 156.0)and 371.2 (236.1 to 506.2), respectively, per 1,000 patient‑years.
Patients who had undergone LEA had a signifi- cantly higher mortality rate than did patients who had not undergone LEA (p<0.0001; Fig.1, upper panel).
The unadjusted hazard ratio of death was 5.1 (95%
CI : 2.3 to 11.2) using a Cox proportional hazard model. After adjusting for age, sex, and known duration of diabetes, the hazard ratio became 4.2 (1.7 to 10.2). After further adjusting for co‑morbidities selected with a stepwise procedure,the relative risk of death was 4.0 (0.9 to 17.3)for patients who had under- gone LEA compared with those who had not. The
Fig.1. Cumulative risk of death in patients with diabetes who had and had not undergone LEA (upper panel)and cumulative risk of second LEA (lower panel). The mortality rate was significantly higher in patients who have undergone LEA (p<0.0001).
Fig.2. The cumulative risk of death by characteristics in patients individuals who had undergone LEA. From the left to right, top to bottom, the survival curves are shown by: level of amputation, sex, age, duration of known diabetes, diabetic retinopathy, diabetic nephropathy, history of hypertension, history of coronary heart disease, and history of stroke. Mortality was significantly higher in patients 60 years or older ( p=
0.02) and in patients with a history of stroke (p=0.03). PPDR : preproliferative diabetic retinopathy;
PDR : proliferative diabetic retinopathy; CHD : coronary heart disease.
Fig.3. The cumulative risk of second LEA by characteristics. From the left to right,top to bottom,the survival curves are shown by: level of amputation, sex, age, duration of known diabetes, diabetic retinopathy, diabetic nephropathy, history of hypertension, history of coronary heart disease, and history of stroke.
Mortality was significantly higher in patients receiving dialysis (p=0.01)and in patients with a history of stroke (p=0.03). PPDR : preproliferative diabetic retinopathy; PDR : proliferative diabetic retinopathy;
CHD : coronary heart disease.
co‑morbidity remaining in the model was a history of stroke, with a relative risk of 4.6 (1.3 to 16.4). The same analysis restricted to the period after the 30th day from the first LEA produced similar results.
Predictors of death and second LEA
Life‑table analysis showed that mortality rate after LEA was significantly higher in patients 60 years or older (p=0.02)and in patients with history of stroke (p=0.03, Fig.2). The variables of age, sex, level of LEA, known diabetes duration, retinopathy, nephropathy, hypertension, coronary heart disease, and stroke were not selected with the stepwise proce- dure for a multivariate Cox proportional hazard model.
Life‑table analysis showed that the second‑LEA rate was significantly higher in patients receiving dialysis (p=0.01) and in patients with a history of stroke (p=0.003, Fig.3). No variables of clinical
characteristics showed statistical significance for a multivariate Cox proportional hazard model with the stepwise procedure.
DISCUSSION
This study investigated the rates of mortality and second LEA in Japanese patients with diabetes who had undergone LEA. The 1‑ and 3‑year cumulative risks of death were 20.0% and 33.8%, respectively.
Previous studies of LEA in diabetes in various coun- tries (Table 3) have consistently found a high risk of death, comparable to the results of the present study.
We found that 1‑ and 3‑year cumulative risks of second LEA were 27.6% and 43.2%, respectively, which were also comparable to findings of earlier studies (Table 4).
Although these data were essential for setting priorities for health policy and estimating the needs of facilities, they must be interpreted with caution.
Table 3. Studies since 1992 of mortality after LEA in patients with diabetes
Reference Year Mortality rate Location Number of patients
Stewart 1992 Median 44 months Scotland 445
Deerochanawong 1992 Median 22 months U.K. 48
Eneroth 1992 1‑year 41% Sweden 70
2‑year 51%
Lee 1993 55.5/1,000 py U.S.A. 156
Apelqvist 1993 1‑year 20% Sweden 123
3‑year 41%
5‑year 73%
Lavery 1996 36.3/1,000 py The Netherlands 3,133
Lavery 1997 32.9/1,000 py U.S.A. 4,861
Ebskov 1998 1‑year 32% Denmark 3,516
1998 3‑year 55%
Pohjolainen 1998 1‑year 38% Finland 287
2‑year 53%
5‑year 80%
Frykberg 1998 Median 19 months U.S.A. 27
Larsson 1998 1‑year 15% Sweden 189
3‑year 38%
5‑year 68%
Faglia 2001 1‑year 70% Italy 27
3‑year 50%
Present study 2003 1‑year 20.0% Japan 42
3‑year 33.8%
Date of publication, age‑adjusted mortality rate, py: patient‑years, ADA : Ame- rican Diabetes Association
First, prognosis might be strongly affected by the indication of surgical procedure, conservative ther- apy, and preventive care for the diabetic foot before or after LEA. Because this study was retrospective, decision making for LEA and other treatments was not standardized. Second,the prognosis may also be affected by the subjectsʼother characteristics,such as age. Finally, the definition of LEA and its outcome may not be comparative. Despite such a lack of comparability, on the basis of repeated observations of poor prognosis, we cannot overemphasize the importance of the problem ; as Logan said,“feet have hearts too” .
The relevant question then becomes to what extent is the poor prognosis due to LEA and to what extent to diabetes? We found a standardized mortal- ity ratio of 5.4, after a mean follow‑up period of 2.8 years. Ebskov has reported mortality ratios of 8.4 for the first year and 4.1 for the second year after LEA . Apelqvist et al. have reported mortality ratios of 5.0,4.4,and 3.9 for the first,second,and third years after the first LEA . The standardized mor-
tality ratio is useful because it takes into account age‑
and sex‑specific mortality in the general background population. We found that patients who had under- gone LEA were 5.1 times more likely to die than were patients who had not undergone LEA. However,the difference in mortality was no longer significant after significant co‑morbidity had been adjusted for. One interpretation of this result is that co‑existing car- diovascular diseases contribute to the poor prognosis after LEA. Few previous reports have provided such a comparison.
We found that the mortality rate after LEA was higher in patients 60 years or older or with a history of stroke and that the rate of second LEA was higher in patients receiving dialysis or with a history of stroke. Although these factors may also reflect on the indication of LEA, it is still useful for identifying patients at high risk for death after LEA. We did not find any differences in mortality or second‑LEA rates between major and minor amputation, which have been suggested by other studies .
Our study had four major limitations: small sam- ple size; possible inaccuracy of clinically relevant information, including glycemic control; lack of information on causes of death ; and its having been hospital‑based. The small sample size was due, at least in part,to the low incidence of LEA in Japanese patients . Our subjects were abstracted from a large number of operation records, which yielded the lar- gest published series of Japanese patients with diabetes who had undergone LEA. Clinical informa- tion may not have been accurate because it was collected retrospectively. For example, glycemic control, which could be measured with glycosylated hemoglobin, was not analyzed, because glycosylated hemoglobin assay requires standardization . How-
ever, this limitation is, again, hard to overcome.
Because of the low incidence of LEA, prospective studies are impractical despite the possibility of pro-
viding more accurate information than do retrospec- tive studies. In our study,we could not collect infor- mation about all causes of death. Other studies have suggested that major causes of death are cardiovas- cular diseases and infection , but additional
Table 4. Studies since 1992 of second‑LEA rate in patients with diabetes
Reference Year Laterality Second‑LEA rate Location Number of patients
Deerochanawong 1992 Ipsilateral 3‑year 32% U.K. 48 Contralateral 3‑year 6%
Larsson 1998 Either 1‑year 14% Sweden 189
3‑year 30%
5‑year 49%
Faglia 2001 3‑year 0% Italy 27
Present study 2003 Either 1‑year 27.6% Japan 42 3‑year 43.2%
Date of publication
studies of causes of death are needed. Because our study was performed at three university hospitals, bias may have been present and either overestimated prognosis owing to high quality of care or underes-
timated prognosis owing to referral of difficult cases.
Little data is available about diabetic foot prob- lems in Asia . Our description of mortality patterns and clinically significant results is the first step toward decreasing the rate of LEA in Japanese patients with diabetes.
Acknowledgements: This study is supported by a Grant‑in‑Aid for Scientific Research (11770204),Min-
istry of Education,Culture,Sports,Science and Tech- nology,Japan. The authors acknowledge Dr.Naoko Tajimaʼs guidance and advice for this project. The authors thank Drs. Youichi Sakamoto, Junichi Yo- koyama, Katsuyuki Fujii, Kunihiro Kurihara, Keizou Fukumoto, Kanae Shimizu, Michihiko Maruyama, and Hironari Sano for their support, and all doctors and staff in the Division of Orthopedics, the Division of Plastic and Reconstructive Surgery, and the Divi- sion of Internal Medicine of The Jikei University Hospitals, The Jikei University Kashiwa Hospital, and The Jikei University Daisan Hospital. The authors thank Dr.Arthur Miller for his help in prepa- ration of the manuscript.
REFERENCES
1. Ministry of Health, Labor and Welfare Japan. Summary of Survey for Diabetes (in Japanese). http://www1.mhlw.
go.jp/toukei/tounyou/. 1998.
2. Keen H, Jarrett RJ. The WHO multinational study of vascular disease in diabetes: 2. Macrovascular disease prevalence. Diabet Care 1979 ; 2: 187‑95.
3. Kida Y, Kashiwagi A, Kodama M, Nishio Y, Abe N, Tanaka Y,et al. Functional and life prognosis in diabet- ics with gangrene: studies on 29 diabetics with gangrene out of 606 inpatients diabetics (in Japanese). Tonyobyo (J Jpn Diabet Soc) 1989 ; 32: 295‑300.
4. Nakamura Y, Kobayashi I. A clinical review of nine diabetic foot patients hospitalized during the past seven years: clinical characteristics,therapeutic effect of PGE1, and prognosis (in Japanese). Kita‑Kantoh Igaku 1992;
42: 379‑85.
5. Segawa I,Shimizu K,Ohashi H,Kinoshita Y,Sato K,Kato M. A Study of twenty‑four cases of diabetic gangrene(in
Japanese). J Jpn Diabet Soc 1989 ; 32: 737‑42.
6. Seki H, Maruyama T, Kaneko M, Amagai H. A review of twenty‑eight cases of diabetic gangrene (in Japanese).
Iryo 1988; 42: 706‑10.
7. Takeda A. Complication on the lower extrimity: diabet- ic gangrene (in Japanese). In : Abe M,Goto Y,Hirata Y, editors. Clinical diabetes lecture Vol.5. Tokyo : Kane- hara‑Shuppan ; 2002. p.105‑10.
8. Ministry of Health, Labor and Welfare Japan. Deaths and death rates by sex, calendar year, and age (in Japanese). http://wwwdbtk.mhlw.go.jp/toukei/youran/
data13/1‑31.htm. 2000.
9. Esteve J, Benhamou E, Raymond L. Techniques for the analysis of cancer risk. Statistical methods in cancer research, volume IV : Descriptive epidemiology. Lyon : International Agency for Research on Cancer; 1994.p.49‑
105.
10. SAS Institute Inc. The SAS System for Windows. Cary, NC : SAS Institute Inc.; 1999.
11. Shaw JE,Vileikyte L,Connor H,Boulton AJ. The diabet- ic foot 1994. Diabet Med 1995; 12: 88‑90.
12. Ebskov LB. Relative mortality in lower limb amputees with diabetes mellitus. Prosthet Orthot Int 1996; 20:
147‑52.
13. Lee JS,Lu M,Lee VS,Russell D,Bahr C,Lee ET. Lower‑
extremity amputation. Incidence, risk factors, and mor- tality in the Oklahoma Indian Diabetes Study. Diabetes 1993; 42: 876‑82.
14. Nelson RG,Gohdes DM,Everhart JE,Hartner JA,Zwemer FL, Pettitt DJ, et al. Lower‑extremity amputations in NIDDM.12‑yr follow‑up study in Pima Indians. Diabetes Care 1988; 11: 8‑16.
15. Lavery LA, Van Houtum WH, Armstrong DG. In- stitutionalization following diabetes‑related lower extremity amputation. Am J Med 1997; 103: 383‑8.
16. Group TG. Epidemiology of lower extremity amputation in centres in Europe,North America and East Asia. The global lower extremity amputation study group. Br J Surg 2000; 87: 328‑37.
17. Jeppsson JO, Kobold U, Barr J, Finke A, Hoelzel W, Hoshino T, et al. Approved IFCC reference method for the measurement of HbA1c in human blood. Clin Chem Lab Med 2002; 40: 78‑89.
18. Stewart CP, Jain AS, Ogston SA. Lower limb amputee survival. Prosthet Orthot Int 1992; 16: 11‑8.
19. Boulton AJ. The diabetic foot : a global view. Diabetes Metab Res Rev 2000; 16 Suppl 1S2‑S5.
20. Deerochanawong C, Home PD, Alberti KG. A survey of lower limb amputation in diabetic patients. Diabet Med 1992; 9 : 942‑6.
21. Eneroth M, Persson BM. Amputation for occlusive arte- rial disease. A prospective multicentre study of 177 amputees. Int Orthop 1992; 16: 383‑7.
22. Apelqvist J,Larsson J,Agardh CD. Long‑term prognosis for diabetic patients with foot ulcers. J Intern Med 1993;
233: 485‑91.
23. Lavery LA, van Houtum WH, Harkless LB. In‑hospital
mortality and disposition of diabetic amputees in The Netherlands. Diabet Med 1996; 13: 192‑7.
24. Lavery LA, van Houtum WH, Armstrong DG, Harkless LB, Ashry HR, Walker SC. Mortality following lower extremity amputation in minorities with diabetes mellitus.
Diabetes Res Clin Pract 1997; 37: 41‑7.
25. Ebskov LB. Diabetic amputation and long‑term survival.
Int J Rehabil Res 1998; 21: 403‑8.
26. Pohjolainen T,Alaranta H. Ten‑year survival of Finnish lower limb amputees. Prosthet Orthot Int 1998; 22: 10‑
6.
27. Frykberg RG, Arora S, Pomposelli FB, Jr., LoGerfo F.
Functional outcome in the elderly following lower extrem- ity amputation. J Foot Ankle Surg 1998; 37: 181‑5.
28. Larsson J, Agardh CD, Apelqvist J, Stenstrom A. Long‑
term prognosis after healed amputation in patients with diabetes. Clin Orthop 1998; (350): 149‑58.
29. Faglia E, Favales F, Morabito A. New ulceration, new major amputation, and survival rates in diabetic subjects hospitalized for foot ulceration from 1990 to 1993: a 6.5‑
year follow‑up. Diabetes Care 2001; 24(1): 78‑83.