A STUDY ON MODEL FRAMEWORK OF PEDESTRIAN LEVEL OF SERVICE ASSESSMENT FOR TRAFFIC AND NON-TRAFFIC FUNCTIONS ON
STREETS IN TOURISM SITES - A CASE IN MELAKA, MALAYSIA
NABILA BINTI ABDUL GHANI
A dissertation submitted in fulfilment of the requirements for the award of the degree of
Doctor of Tourism Science
Department of Tourism Science Tokyo Metropolitan University
SEPTEMBER 2017
TOKYO METROPOLITAN UNIVERSITY
DISSERTATION FOR A DEGREE OF DOCTOR OF TOURISM SCIENCE TITLE:
A Study on Model Framework of Pedestrian Level of Service Assessment for Traffic and Non-Traffic Functions on Streets in Tourism Sites - A Case in Melaka,
Malaysia
AUTHOR:
Nabila binti Abdul Ghani EXAMINED BY:
Prof. Tetsuo SHIMIZU
Prof. Hiroyuki ONEYAMA
Assoc. Prof. Taketo NAOI
Assoc. Prof. Yu OKAMURA
QUALIFIED BY
THE GRADUATE SCHOOL OF URBAN ENVIRONMENTAL SCIENCES Dean
SEPTEMBER 2017
ACKNOWLEDGEMENT
I would like to express my deepest gratitude to my supervisor, Prof. Tetsuo Shimizu for his assistance, guidance, and patience supervise my work and made it possible for me to complete this dissertation. My appreciation and thanks also go to my examiners, Prof. Hiroyuki Oneyama, Assoc. Prof. Taketo Naoi and Assoc. Prof.
Yu Okamura. I also appreciate the comments and suggestions from Prof. Susumu Kawahara, Dr. Yukiko Katagiri, Dr. Naoki Furukawa, Dr. Hisatoshi Ai, Dr. Mitsuru Noda and Dr. Norie Hirata.
To all my friends that supported me throughout my study especially Tuangkarn Watthanaboon, Nicholas Marpaung, Nguyen Van Truong, Dr. Safizahanin Mokhtar, Dr. Yongwon Lee, Dr. Muna Maryam Azmy, Dr. Noordyana Hasan, Khanal Bishnu, Toshi Ogura, Huda Farhana Mohamad Muslim, Foo Yensin, Nur Laili Ab Latif, Ngo Kang Min, Phung Thi Hong Luong, Ummeh Saika, Nozomi Nakagawa, Ai Okada, Kei Enchi, Ms. Ayako Miyata, Ms. Yuka Hasegawa, Dr. Eranga Ranaweerage and all students from the culture-based and nature-based, Department of Tourism Science, Tokyo Metropolitan University. Thank you very much.
I would like to acknowledge Tokyo Metropolitan Government and Tokyo
Metropolitan University for providing the Asian Human Resources Fund to perform
this study. Thank you for the help and cooperation of students from Universiti
Teknologi Malaysia for conducting the survey. Special thanks go to my beloved
parents Abdul Ghani bin Abdullah and Zakiah Md Said and for the whole family which
never failed to support, encourage and inspire me both in my study and in life. No
words are adequate to express my gratitude to them.
ABSTRACT
In promoting a sustainable tourism development in urban areas, the introduction of measures to minimize the use of the cars from street networks in tourism sites and to prioritize pedestrians is required. To support such a tourism sites transportation plan measures, it is essential to develop a method to evaluate the level of service that pedestrians could enjoy while walking on the street network.
In the level of service evaluation for vehicles, a method of classifying the service levels into six levels using speed and density as indicators is adopted, but safety, comfort and accessibility required by the users. It is because the level of service is described roughly by these two indicators. Although there is still no practical method, basically the same concept as above can be applied to the evaluation of the pedestrian level of service in a street network in a commercial area or a residential area. On the other hand, in the tourism sites, the idea that assumes low speed is enjoyable, people with higher density can feel lively, and it is not a structure that can be evaluated only by a monotonic relationship between speed and density.
In this paper, as an initial effort to solve the problems above, we analyzed the street network in the Melaka city center, Malaysia which is a historical tourism site that also has commercial functions, and analyzed the traffic functions by the tourist pedestrians. It primarily aims to propose the level of service evaluation framework of non-traffic function through quantitative analysis using psychological data of pedestrians.
This paper consists of six chapters. Chapter 1 discusses the background and purpose of the study. In Chapter 2, we review previous research on the pedestrian level of service evaluation framework for traffic functions and discuss the position of this paper compared with the previous methods.
In Chapter 3, we focus on tourism functions as non-traffic functions and
present a model framework that simultaneously evaluates the level of service by tourist
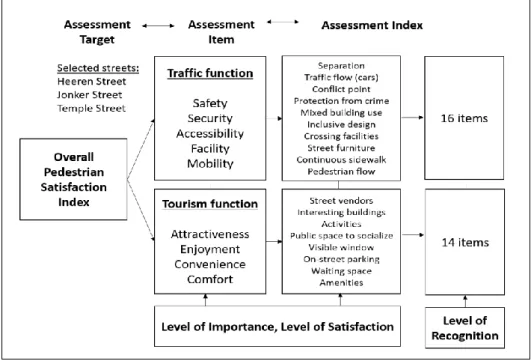
pedestrians with traffic functions. We select the five indicators of safety, security,
accessibility, facility and mobility as traffic functions, four indicators of attractiveness, enjoyment, convenience and comfort as tourism functions. We applied a method to classify it into five levels by calculating the total score P-index by substituting physical observation values such as traffic volume and sidewalk maintenance rate, and psychological observation values such as satisfaction level into the conversion formula. In order to examine the characteristics of the pedestrian level of service judged by this method, as a result of attempting to evaluate the level of service during walking on a street constituting the network to be analyzed using physical observation values limited only to the traffic function. The pedestrian level of service in the three main streets where tourists concentrate is low, suggesting the necessity of considering tourism functions in P-index.
In Chapter 4, we propose a level of service evaluation method for tourist pedestrians using psychological observations. Specifically, we conducted a questionnaire survey of tourists, who walked on three major streets and asked about 5 levels of satisfaction, recognition, and importance for nine indicators for each street.
The geometric mean of the evaluation values of these three elements was regarded as high satisfaction in each indicator, and the geometric mean of satisfactory level by the traffic function and the tourism function, respectively, and it was converted to the full scale of 100 points. This is a method of classifying them as five levels, assuming things as satisfaction indicators of each function. We analyze the relationship between the index calculated in this way and the 5-point evaluation value of the satisfaction level for the traffic function and the tourism function as a whole in the questionnaire survey and verify the validity of the proposed method. The result of this chapter is that the correlation between the satisfaction index of the traffic function and the tourism function is high in every street and that the correlation between the response value of the satisfaction level of each service item in both functions is high, and confirmed the validity of the proposed method.
In Chapter 5, we propose a level of service evaluation method for tourist
pedestrians using psychological observation values by a method different from that in
Chapter 4. Specifically, unlike the fourth chapter, using the structural equation
modeling (SEM) analysis with explanatory variables of satisfaction level of each
indicator to the traffic functions and tourism functions. It is a statistical method that
includes the structure of the level formation and its factors. The result of this chapter is that there are possibilities that the level of service evaluation structure may differ between 2 streets with many strolling target resources on the sidewalk along the street and the remaining 1 street among the 3 streets, that the satisfactory level of the indicator and the traffic function. And the value of the path factor to the latent factor which can be regarded as the total satisfaction of the tourism function are different from each other and the possibility that the evaluation method not considering the coefficient as in Chapter 4 is inappropriate in this analysis target. It is suggested that it is high.
Chapter 6 presents the conclusions of the research and the points to increase the practicality of this method.
In the above, this paper has the novelty that the concept of pedestrian level of
service evaluation method, which simultaneously takes into consideration the traffic
functions and tourism functions in the tourism sites street network, was specifically
presented for the first time in Japan and abroad.
TABLE OF CONTENTS
ACKNOWLEDGEMENT ABSTRACT
TABLE OF CONTENTS LIST OF TABLES LIST OF FIGURES
1 INTRODUCTION TO RESEARCH 1
1.1 Background of Research 1
1.2 Research Objectives 5
1.3 Research Questions 5
1.4 Thesis Organization 6
2 PEDESTRIAN LEVEL OF SERVICE IN TRAFFIC-RELATED
STUDIES AND TOURISM-RELATED STUDIES 9
2.1 Pedestrian Level of Service and Traffic-Related Studies 9 2.1.1 The First Structure of Pedestrian LOS: Quantitative
Evaluation 11
2.1.2 The Second Structure of Pedestrian LOS: Qualitative
Evaluation 11
2.1.3 The Third Structure of Pedestrian LOS: Quantitative and
Qualitative 18
2.1.4 The Advantages and Disadvantages of PLOS Evaluation
Structure 23
2.1.5 Limitations of the Current Assessment Methods on PLOS 25
2.2 Pedestrian Level of Service and Tourism-Related Studies 27
2.2.1 Tourist Walking Experiences 27
2.2.2 Crowding Literature 29
2.3 Definition of Traffic-Related Studies and Tourism-Related Studies
Components use in this Study 30
2.4 Chapter Summary 38
3 RESEARCH METHODOLOGY AND PHYSICAL EVALUATION FOR
TRAFFIC-RELATED FUNCTION 39
3.1 Research Methodology 41
3.1.1 Study Area 41
3.1.2 Selection of Streets 44
3.1.3 Questionnaire Survey 48
3.2 The Model Framework 48
3.3 The Pedestrian Index Method (P-Index) for Physical Evaluation 50
3.3.1 Mobility indicator 51
3.3.2 Safety indicator 53
3.3.3 Facility indicator 55
3.3.4 Accessibility indicator 57
3.4 Discussion 65
3.5 Chapter Summary 69
4 SIMPLE MULTIPLIER TYPE FOR PSYCHOLOGICAL
EVALUATION (TYPE 1) 70
4.1 Type 1 Model Assessment: Multiplier Type 72
4.1.1 Pedestrian Satisfaction Index for Traffic-Related Street
Function 75
4.1.2 Pedestrian Satisfaction Index for Tourism-Related Street
Function 78
4.1.3 Results and Discussion 84
4.2 Relationship between Pedestrian Satisfaction Traffic Score and
Pedestrian Satisfaction Tourism Score 92
4.3 Validity Check of the Proposed Multiplier Type ISR and Meaning of Summing Up the Overall Satisfaction for Traffic and Tourism
Functions 94
4.3.1 Check R-squared (R
2) for Pedestrian Satisfaction Traffic and
Pedestrian Satisfaction Tourism 94
4.3.2 Check R-squared (R
2) between Two Factors Within Traffic
and Tourism Functions 95
4.3.3 Weak Correlation Between Factors 97
4.3.4 Check the Effect of Factors to the Satisfaction by Box Plot
Distribution 100
4.4 Overall Pedestrian Satisfaction Index (OPSI) and Demographic
Characteristics 103
4.4.1 Background of respondent 104
4.4.2 Statistical technique to compare OPSI score with two groups
using the Mann-Whitney U Test 105
4.4.3 Statistical technique to compare OPSI score with three groups using the Kruskal Wallis H Test 110 5 PSYCHOLOGICAL RESPONSES AND STRUCTURAL EQUATION
MODELING (TYPE 2) 112
5.1 Data Analysis 114
5.1.1 Exploratory Factor Analysis (EFA) 114
5.1.2 Confirmatory Factor Analysis (CFA) 118
5.2 Results 118
5.3 Discussion 122
5.3.1 Difference Street by Street 125
5.3.2 Difference Group by Group 129
5.3.3 Path Analysis using Structural Equation Model (SEM) 134
5.3.4 The Effect of SEM Result 141
5.4 The Relationship Between Psychological Responses and Physical 146
6 CONCLUSION 156
6.1 Conclusion 156
6.1.1 Psychological Evaluation Indices 156
6.1.2 Factors Affecting Pedestrian Satisfaction 157 6.1.3 Relationship of Pedestrian Satisfaction to Traffic and
Tourism-Related Functions 157
6.1.4 The Differences of Psychological Responses by Street-Based
and Group-Based Analysis 159
6.2 Study Limitation 160
6.3 Application in academic and practical viewpoint 160
6.4 Chapter Summary 161
REFERENCES 163
A APPENDIX: Questionnaire Survey 169
LIST OF TABLES
TABLE NO. TITLE PAGE
Table 2-1 Pedestrian Level of Service Criteria (HCM, 2000) 11 Table 2-2 Pedestrian LOS Performance Measure Point System
(Dixon, 1996)
12 Table 2-3 Pedestrian Level of Service Ratings (Dixon, 1996) 13 Table 2-4 Pedestrian Level of Service Ratings (Jaskiewicz, 1999) 13 Table 2-5 Assessment Model to Determine LOS for Pedestrians
(Gallin, 2001)
14 Table 2-6 Pedestrian Level of Service Ratings (Gallin, 2001) 15 Table 2-7 Pedestrian Level of Service Ratings (Asadi-Shekari,
2011)
17 Table 2-8 Summary of selected factors and indicators (Talavera-
Garcia, 2015)
17 Table 2-9 Quality of Pedestrian Level of Service (Talavera-
Garcia, 2015)
18 Table 2-10 Pedestrian Level of Service Categories (Landis, 2001) 19 Table 2-11 Attributes and levels of sidewalk (Muraleetharan, 2005) 20 Table 2-12 Pedestrian Level of Service Categories (Tan, 2007) 21 Table 2-13 Pedestrian Level of Service Categories (Hidayat, 2011) 22 Table 2-14 Summary of Advantages and Disadvantages of PLOS
Methods
23 Table 2-15 Detailed Components Covers by Existing PLOS
Evaluation Structure
31 Table 2-16 Definition of Traffic-Related Function and Tourism-
Related Functions Used in This Study
35
Table 2-17 The Research Gap 38
Table 3-1 Selected Street Segments in Melaka WHS 44
Table 3-2 Characteristics of Street Function 46
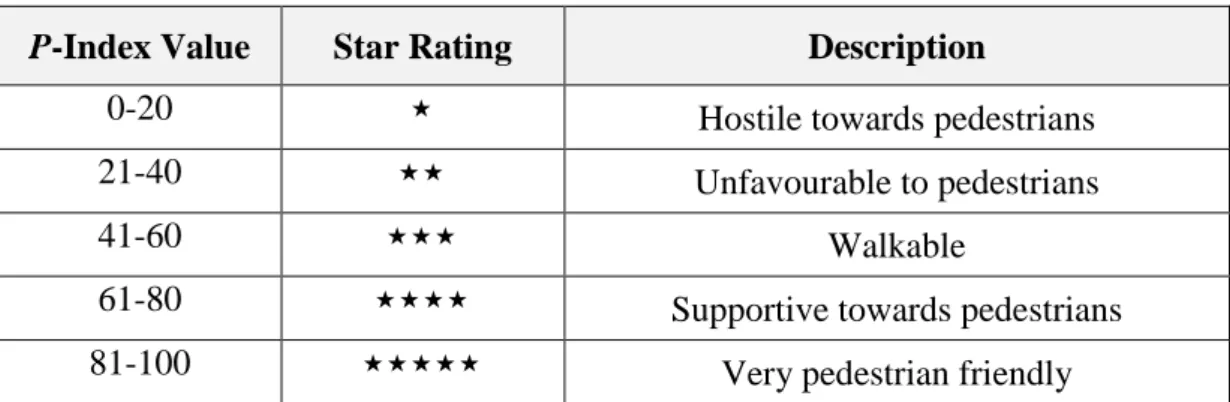
Table 3-3 Interpretation of the P-Index Value 51
Table 3-4 Mobility Indicator (M) 52
Table 3-5 Safety Indicator (S) 54
Table 3-6 Facility Indicator (F) 56
Table 3-7 Accessibility Indicator (A) 57
Table 3-8 Interpretation of the Indicator Values 59 Table 3-9 Summary of P-Index (P) for All Street Segments in
Melaka WHS
60 Table 3-10 Overall Assessment of Pedestrian Facilities in Melaka
WHS
61 Table 3-11 Sensitivity of Coefficient (b) Settings 63 Table 4-1 Interpretation of the Overall Pedestrian Satisfaction
Index (OPSI) Value
75 Table 4-2 Interpretation of the Pedestrian Satisfaction Index for
Traffic-related Street Function
77 Table 4-3 Interpretation of the Pedestrian Satisfaction Index for
Tourism-related Street Function
79
Table 4-4 Selected Indicators 81
Table 4-5 Recognition Level 82
Table 4-6 Summary of Pedestrian Satisfaction Index for Selected Streets in Melaka WHS
84
Table 4-7 Sensitivity Check of coefficient (bi) 85
Table 4-8 Mean Score of Recognition Level, Satisfaction Level and Importance Level for Traffic Function
87 Table 4-9 Mean Score of Recognition Level, Satisfaction Level
and Importance Level for Tourism Function
88 Table 4-10 Steps in Calculating the Index for Heeren Street 89
Table 4-11 R-Squared Value for the Streets 95
Table 4-12 R-Squared (R
2) for ISR Tourism 95
Table 4-13 R-Squared (R
2) for ISR Traffic 96
Table 4-14 Sample Profiles 104
Table 4-15 The Result of Mann-Whitney U Test to compare OPSI score between two independent groups in demographic characteristics
109
Table 4-16 The Result of Kruskal Wallis H Test to compare OPSI score between three groups in demographic
characteristics
111
Table 5-1 KMO and Bartlett’s Test for Heeren Street 115
Table 5-2 Pattern Matrix for Heeren Street 115
Table 5-3 KMO and Bartlett’s Test for Jonker Street 116
Table 5-4 Pattern Matrix for Jonker Street 116
Table 5-5 KMO and Bartlett’s Test for Temple Street 117
Table 5-6 Pattern Matrix for Temple Street 117
Table 5-7 The Categories of Model Fit and Their Level of Acceptance
118 Table 5-8 The Standardized Estimates and Squared Multiple
Correlation for Heeren Street
119 Table 5-9 The Standardized Estimates and Squared Multiple
Correlation for Jonker Street
120 Table 5-10 The Standardized Estimates and Squared Multiple
Correlation for Temple Street
121 Table 5-11 The Chi Square Difference Group by Group 133 Table 5-12 The Regression Path Coefficients and its Significance
for Heeren Street
136 Table 5-13 The Regression Path Coefficients and its Significance
or Jonker Street
138 Table 5-14 The Regression Path Coefficients and its Significance
for Temple Street
140 Table 5-15 Summary of Hypothesis Test for All Streets in the
Study Area
141 Table 5-16 Summary of The Effect of SEM Result on Satisfaction
Level for All Streets in the Study Area
144
Table 5-17 The Observable Countable Physical for Each Street 146
LIST OF FIGURES
FIGURE NO. TITLE PAGE
Figure 1-1 Conventional Level of Service System for Vehicle and Pedestrian
3 Figure 1-2 The Relationship between Speed and Density 3 Figure 1-3 Pedestrian in Tourist Site and Level of Service 4
Figure 1-4 Thesis Organization 8
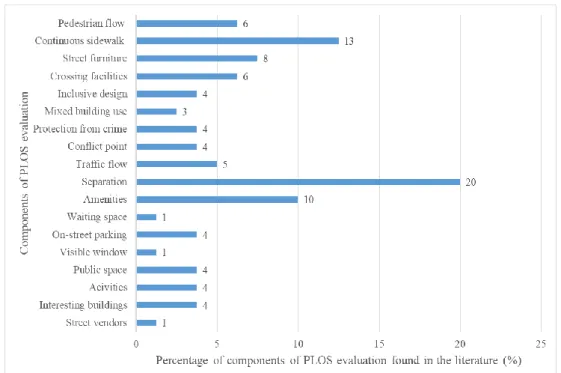
Figure 2-1 Components of PLOS Evaluation Found in the Literature
34
Figure 3-1 Study Framework for Chapter 3 40
Figure 3-2 Map of Melaka, Malaysia 42
Figure 3-3 Melaka Core Zone and Buffer Zone 42
Figure 3-4 Tourist Arrivals to Melaka before and after UNESCO WHS Listing
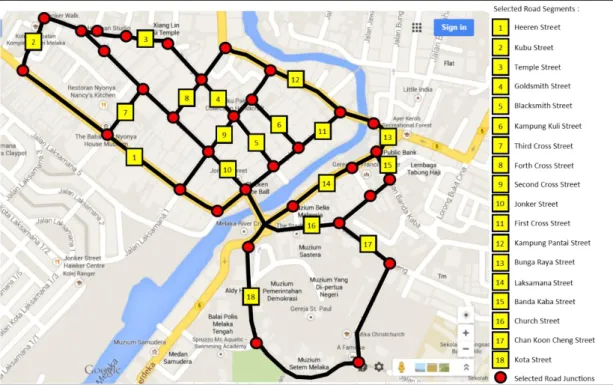
43 Figure 3-5 Selected Street Segments and Junctions in the Core
Zone of Melaka WHS for the Physical Study
45 Figure 3-6 Selected Streets in the Core Zone of Melaka WHS for
the Psychological Study
46 Figure 3-7 Theoretical Framework for Type 1 Assessment 49 Figure 3-8 Land Use Map of Old Quarter Area and Civic Area of
Melaka WHS
58 Figure 3-9 Ratings of Pedestrian Index for Selected Street
Segments in the Core Zone of Melaka World Heritage Site
65
Figure 4-1 Study Framework for Chapter 4 71
Figure 4-2 Conversion Method from Score to Interval System 73
Figure 4-3 Pedestrian Satisfaction Score on Traffic and Tourism for Heeren Street
92 Figure 4-4 Pedestrian Satisfaction Score on Traffic and Tourism
for Jonker Street
93 Figure 4-5 Pedestrian Satisfaction Score on Traffic and Tourism
for Temple Street
93
Figure 4-6 R-squared and Correlation 94
Figure 4-7 Attractiveness (AT) and Convenience (CN) point-based score (Heeren Street)
97 Figure 4-8 Attractiveness (AT) and Comfort (CM) point-based
score (Heeren Street)
98 Figure 4-9 Security (SC) and Mobility (MB) point-based score
(Heeren Street)
98 Figure 4-10 Attractiveness (AT) and Convenience (CN) point-based
score (Jonker Street)
99 Figure 4-11 Attractiveness (AT) and Comfort (CM) point-based
score (Jonker Street)
99 Figure 4-12 Attractiveness (AT) and Convenience (CN) point-based
score (Temple Street)
100
Figure 4-13 Tourism Factors (Heeren Street) 101
Figure 4-14 Tourism Factors (Jonker Street) 101
Figure 4-15 Tourism Factors (Temple Street) 101
Figure 4-16 Traffic Factors (Heeren Street) 102
Figure 4-17 Traffic Factors (Jonker Street) 102
Figure 4-18 Traffic Factors (Temple Street) 102
Figure 5-1 Study Framework for Chapter 5 113
Figure 5-2 SEM Model for Heeren Street 119
Figure 5-3 SEM Model for Jonker Street 120
Figure 5-4 SEM Model for Temple Street 121
Figure 5-5 SEM Model for Heeren Street (Art and Cultural Street) 122
Figure 5-6 SEM Model for Jonker Street (Shopping Street) 123
Figure 5-7 SEM Model for Temple Street (Religious Street) 124
Figure 5-8 The Standardized Path Coefficients for Every Path in the Model for Heeren Street
134 Figure 5-9 The Standardized Path Coefficients for Every Path in
the Model for Jonker Street
137 Figure 5-10 The Standardized Path Coefficients for Every Path in
the Model for Temple Street
139 Figure 5-11 The Significant Indicator for All Street After Running
Statistical Analysis EFA, CFA and SEM Path Analysis
142
Figure 5-12 Attractiveness (Street Vendors) 149
Figure 5-13 Attractiveness (Interesting Buildings) 149
Figure 5-14 Enjoyment (Cultural Activities) 150
Figure 5-15 Enjoyment (Public Space) 150
Figure 5-16 Convenient (Visible Window) 151
Figure 5-17 Convenient (On-street Parking) 151
Figure 5-18 Comfort (Waiting Space) 152
Figure 5-19 Comfort (Amenities) 152
Figure 5-20 Safety (Traffic Volume) 153
Figure 5-21 Security (Protection from Crime) 153
Figure 5-22 Accessibility (Mixed Building Use) 154
Figure 5-23 Facility (Street Furniture) 154
Figure 5-24 Mobility (Pedestrian volume) 155
CHAPTER 1
1
INTRODUCTION TO RESEARCH
1.1 Background of Research
Pedestrian facilities are an important aspect in the design of traffic management systems because it also has implications on the overall traffic system, especially in the city center. Assessment of pedestrian facilities is important to determine how well a facility is fulfilling its intended objectives. The issues with pedestrian planning are due to an absence of an objective method to assess the provision of pedestrian walkways, an inadequate planning, and design for pedestrian spaces as well as an inaccurate assessment of the needs of and requirements of a pedestrian especially in tourism destination or tourist site. Hence, there is a need to assess whether the facilities are pedestrians friendly.
The conventional pedestrian level of service for traffic function express good street as low density, high speed and smoother traffic, and bad street as high density, low speed and congested. However, assessing the pedestrian level of service for both traffic function and non-traffic function in tourism site is much more complicated.
Dense pedestrian or congested/crowded condition would be worse in the viewpoint of
traffic function but might be attractive in the viewpoint of tourism function. Therefore,
this study proposed a combined traffic- and tourism-related pedestrian level of service
for a comprehensive assessment of street conditions in tourism site.
2 Assessing walking conditions is much more difficult than assessing vehicular roadways. Those methods are widely available for automobile, but unfortunately not for the infrastructure of non-motorized modes. The most common approach in assessing the quality of pedestrian facilities is by Pedestrian Level of Service (PLOS).
PLOS expresses the degrees that the sidewalk facilities satisfy the pedestrians’
demands of safety and comfort of pedestrian users. Measurement of these factors is necessary to evaluate the pedestrian facilities. One of the most important issues is related to knowing the minimum number of indicators needed to accurately estimate pedestrian satisfaction or perceived level of service. Although there are several existing methods of PLOS for street evaluation, a more integrated approach incorporating more walking needs is still required.
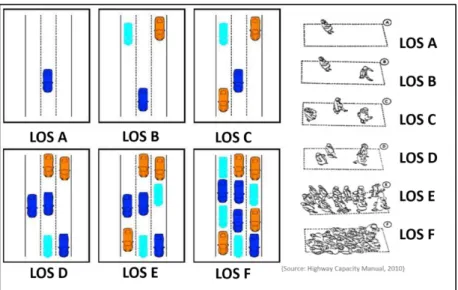
Figure 1-1 shows the conventional level of service (LOS) system which is mainly used in the transport field for vehicle LOS. This method as proposed by Highway Capacity Manual use car flow concept. LOS indices es from A to F is mainly applied to the car traffic flow on the highway. The Highway Capacity Manual calculates quantitatively pedestrian LOS based on density and speed. Density is the number of cars in a unit section. If the density is high, the LOS is F, which means very congested. This concept of conventional vehicle LOS is used to evaluate pedestrian LOS. This method has been criticized because pedestrians were treated like vehicles and not describing the actual situation of walking environment.
For example, in a tourism site, if the pedestrian flow is high and achieves the
LOS F, it is congested. However, sometimes, congestion may have a very positive
psychological response for the non-traffic function (tourism aspect). Of course, for the
traffic aspect, congestion should be avoided. If we only consider the traffic function,
walking speed should be higher, but for tourism attraction, walking speed should not
be so high. Pedestrians, who walk slowly still can enjoy the environment. So, we can
observe some physical parameter. Traffic parameters which we can observe give a
quite different response, function by function. So, this is one of the challenges in this
kind of study.
3
Figure 1-1 Conventional Level of Service System for Vehicle and Pedestrian
Figure 1-2 The Relationship between Speed and Density
Figure 1-2 shows the relationship between speed and density. If a driver driving a car in a congested situation, he cannot have a high speed. So, if the congestion increase, a speed decrease. The relationship between speed and density are shown as in the figure. This system is very simple, just consider speed and density to define LOS A to F. LOS A is the best and LOS F is the worst. When driving, the driver expects that traffic should be safe, smooth and time-saving. The most important are high speed.
If density becomes larger, safety condition becomes worst. If speed is higher, the driver
can enjoy fast service and less time to the destination. This kind of indices mostly well
related to our psychological response. Therefore, this kind of idea is very simple to
use.
4 However, the Highway Capacity Manual method fails to consider the quality of the human experience. For example, in Figure 1-3, we can’t consider pedestrian flow same as vehicle flow that only moves in a straight line. The pedestrian movement is dispersed and while walking, sometimes pedestrians will be blocked by some physical obstructions such as unplanned street furniture, street vendors or on-street parking. Pedestrians also may experience conflict point while walking. Some important indicators, such as qualitative factors, and facilities, are not considered in these types of models and not investigated thoroughly. So, it is very important to understand the issues.
Figure 1-3 Pedestrian in Tourist Site and Level of Service
In transportation planning, an objective or practical goal should be set. For
traffic management, some indices of the site performance should be focused. To
achieve LOS A, require a lot of money to invest. So, it is important to decide the
minimum level of the service that should at least be provided on street. But, the
problem is what kind of indices is suitable for the evaluation and how to measure the
value of the index? So, this is the motivation of this study, to propose final evaluation
system on rating PLOS and the final goal is the model can be applied to street
evaluation and the street management.
5 1.2 Research Objectives
This study aims to develop a model framework of the pedestrian level of service assessment for traffic and non-traffic functions on streets in tourism sites and to compare psychological responses and physical parameters. The objectives of this research are:
1. To propose a psychological evaluation indices for traffic-related function and tourism-related function by introducing a simple multiplier type evaluation.
2. To identify the significant factors that affected to increase the pedestrian satisfaction for different street characteristics, namely cultural street, shopping street and religious street in a tourism site in the study area.
3. To understand the relationship of pedestrian satisfaction to the traffic- related functions and tourism-related function and examine the effects by executing a structural equation modelling.
4. To identify the differences between the diversity of psychological responses by checking the factor score by street-based and group-based analysis.
1.3 Research Questions
To achieve the above research objectives, this study answers the following questions:
1. How to assess traffic-related function and tourism-related function by psychological evaluation?
2. What are the factors that are affected to increase the pedestrian satisfaction
in tourism sites?
6 3. What are the relationship and the effect of pedestrian satisfaction to the
traffic-related function and tourism-related function?
4. Is there a difference between psychological responses by different street and group preferences?
1.4 Thesis Organization
This thesis has been organized as follows: Chapter 2 reviews existing evaluation methods of the pedestrian level of service in transport-related studies found in the literature. It discusses the advantages and disadvantages of the existing method of PLOS. The second part of this chapter discusses a pedestrian level of service in tourism-related studies such as tourist walking experiences and crowding literature.
Finally, based on the review, the definition of traffic-related function and tourism- related function used in this study are explained.
Chapter 3 explained the research methodology in undertaking the survey. It includes the selection of streets in the study area and the questionnaire design. There are two surveys conducted in this study. First is the physical survey, based on physical components by counting physical condition on site. The physical condition data were observed directly on street. Eighteen (18) selected streets in Melaka World Heritage Site, Malaysia were evaluated as a case study to check the model application. The second one is a psychological survey. A questionnaire survey was conducted to domestic and international tourists who walked along the selected streets in the study area. Three (3) selected streets, namely cultural street, shopping street and religious street in Melaka were evaluated based on the tourist psychological responses. After that, a theoretical framework for the whole evaluation structure is explained.
Then, the second part of Chapter 3 shows one simple example of the whole
evaluation system if we just consider the traffic function. The detailed analysis was
shown by considering only traffic function. Pedestrian level of service are explained
by traffic function includes Safety (SF), Mobility (MB), Facility (FC) and
Accessibility (AC) indicators.
7 Chapter 4 introduced a simple multiplier type evaluation (Type 1) for traffic function and tourism function, based on the psychological response from tourist.
Satisfaction level for each function is expressed by the level of importance, recognition and satisfaction. The comprehensive overall traffic satisfaction is multiplication of importance, recognition, and satisfaction for Safety (SF), Mobility (MB), Facility (FC), Accessibility (AC) and Security (SC), while overall tourism satisfaction is multiplication of importance, recognition and satisfaction for Attractiveness (AT), Enjoyment (EN), Convenience (CN) and Comfort (CM).
Then, in this chapter 4, the relationship between pedestrian satisfaction for tourism and traffic scores (correlation) were checked. The validity of multiplier type was also checked by patterned the distribution and the effect of factors to satisfaction.
The index that had some high impact on the level of service/satisfaction evaluation were identified. Finally, the differences in scores within the group and across the group were identified.
Chapter 5 explained the results of psychological responses and the effects of significant factors were examined by executing a structural equation modelling (Type 2). In this chapter, the weight (coefficient) of each factor and assessment of model fitness were checked. The differences between the diversity of psychological responses were identified by checking the factor score by street-based and group-based analysis. SEM path analysis was used to understand the effects and relationship between the tourism-related factors, traffic-related factors and the satisfaction on three streets in the study area.
Finally, Chapter 6 concludes the findings of this study and explained the study
limitation for future research. Figure 1-4 shows the thesis organization.
8
Figure 1-4 Thesis Organization CHAPTER 1
Introduction to Research
CHAPTER 2
Pedestrian Level of Service in Traffic-related Studies and Tourism-related Studies
CHAPTER 3
Research Methodology and Physical Evaluation for Traffic-related Function
CHAPTER 4 Simple Multiplier Type for
Psychological Evaluation
CHAPTER 5 Psychological Responses
and Structural Equation Modelling
CHAPTER 6
Conclusion
CHAPTER 2
2
PEDESTRIAN LEVEL OF SERVICE IN TRAFFIC-RELATED STUDIES AND TOURISM-RELATED STUDIES
The role of this chapter is to review the model structure of other studies in evaluating the pedestrian level of service (PLOS) and compare the differences by a total model framework of the evaluation. The review starts with the identification of PLOS evaluation methods by three types of the structure proposed by previous researchers, followed by the detailed components of each model in traffic-related studies. Then, advantages and disadvantages of each model are discussed. The second part of this chapter discuss a pedestrian level of service in tourism-related studies such as tourist walking experiences and crowding literature. Finally, based on the review, the definition of traffic-related function and tourism-related function used in this study are explained.
2.1 Pedestrian Level of Service and Traffic-Related Studies
Level of Service (LOS) has been defined as a measure for explaining current
facilities, situations, equipment, and infrastructures in streets, and it also evaluates the
quality of service (Asadi-Shekari & Zaly Shah, 2011). Various LOS models have been
used to assess the requirements of pedestrians, automobiles, bicycles and public
transport. The most common approach to assessing the quality of street conditions for
pedestrians is by using the pedestrian level of service (PLOS). Gallin (2001) defined
PLOS as an overall measure of walking conditions on a route, path, or facility. This is
10 linked directly to factors that affect mobility, comfort, and safety, reflecting pedestrians’ perceptions of the degree to which the facility is ‘pedestrian friendly’.
From the literature, the assessment of PLOS can be divided into two functions;
traffic function (physical parameter) and non-traffic function (psychological parameter). The traffic function included traffic conditions (such as pedestrian volume, vehicle volume, speed) and street facility conditions (such as sidewalk width). The non-traffic function included environmental conditions (such as safety, comfort, amenity) and user perception (such as feeling, satisfaction and rating). Numerous researches deal with the assessment of the pedestrian level of service (PLOS) by using point systems and regression analyses for calculating LOS for pedestrians.
There is three common structure to evaluate the pedestrian level of service for the sidewalk. The first structure is a capacity-based model that considers the pedestrian traffic and sidewalk geometry. This flow structure model quantitatively assesses the pedestrian flow, speed, and density. Example of this conventional pedestrian level of service system is by Highway Capacity Manual (2000).
The second structure of pedestrian level of service assessment is the street characteristic-based model that considers the quality of the street environment. This model qualitatively evaluates the street side and the factors that influence the safety and comfort of pedestrians. This kind of models is based on point system evaluation.
Examples of the existing pedestrian level of service model for this type is method proposed by Dixon (1996), Jaskiewicz (1999), Gallin (2001), Sarkar (2002), Asadi- Shekari (2011) and Talavera-Garcia (2015).
The third structure considers both traffic flow operation and the street
characteristics. This kind of structure evaluates the pedestrian level of service by
computing the model into the stepwise multi variable regression analysis. Examples
of this structure are method proposed by Landis (2001), Muraleetharan (2005), Tan
(2007) and Hidayat (2011).
11 2.1.1 The First Structure of Pedestrian LOS: Quantitative Evaluation
The Highway Capacity Manual (2000) calculates pedestrian LOS based on capacity and space requirements. It defines six ranges of Level of Service (from A to F), depending on the following variables: space available per pedestrian, flow rates and speeds (refer to Table 2-1). PLOS A is free flow and maximum speed; PLOS E is the congested situation and PLOS F is no movement. The main indicator, flow rate incorporates pedestrian speed, density, and volume, which is equivalent to vehicular flow. As the volume and density increase, pedestrian speed declines. As density increases and pedestrian space decreases, the degree of mobility afforded to the individual pedestrian declines, as does the average speed of the pedestrian stream.
However, pedestrians are treated as vehicles on legs or object moving in horizontal space. HCM 2000 gives relatively little guidance on compiling the LOS of each factor into a measure of overall LOS and it does not suggest any methodology to measure them.
Table 2-1: Pedestrian Level of Service Criteria (HCM, 2000)
LOS Space
(ft2/ ped)
Flow Rate (ped/min/ft)
Speed (ft/sec)
Volume/Capacity Ratio
A > 60 ≤ 5 > 4.25 ≤ 0.21
B > 40 - 60 > 5 - 7 > 4.17 – 4.25 > 0.21 – 0.31 C > 24 - 40 > 7 - 10 > 4.00 – 4.17 > 0.31 – 0.44 D > 15 - 24 > 10 - 15 > 3.75 – 4.00 > 0.44 – 0.65 E > 8 - 15 > 15 - 23 > 2.50 – 3.75 > 0.65 – 1.00
F ≥ 8 Variable ≤ 2.50 Variable
2.1.2 The Second Structure of Pedestrian LOS: Qualitative Evaluation
The other method was made by Dixon (1996) to assess streets using a point
system. She proposed a pedestrian LOS evaluation components which involve (1)
Provision of Basic Facilities, (2) Path Conflicts, (3) Amenities, (4) Motor vehicle LOS,
(5) Maintenance Problems, and (6) Provision for multiple modes. She uses the point
12 system of 1 to 21 that results in LOS ratings from A to F (refer to Table 2-2 and Table 2-3). The PLOS ratings describe the degree to which facility provisions encourage pedestrian use. The PLOS is simple, easy to apply and useful for rating street situations, but the criteria and their weighted points are randomly chosen.
Table 2-2: Pedestrian LOS Performance Measure Point System (Dixon, 1996)
Category Criterion Points
PEDESTRIAN FACILITY PROVIDED
(Max Value = 10)
Not Continuous or Non- existent 0
Continuous on One Side 4
Continuous on Both Sides 6
Min. 1.53m (5’) Wide & Barrier Free 2 Sidewalk Width > 1.53m (5’) 1 Off-Street / Parallel Alternative Facility 1 CONFLICTS
(Max Value = 4)
Driveways & Side streets 1
Pedestrian Signal Delay 40 Sec or Less 0.5 Reduced Turn Conflict Implementation 0.5 Crossing Width 18.3m (60’) or Less 0.5
Posted Speed 0.5
Medians Present 1
AMENITIES (Max Value = 2)
Buffer Not Less Than 1m (3.5’) 1 Benches or Pedestrian Scale Lighting 0.5
Shade Trees 0.5
MOTOR VEHICLE LOS (Max Value = 2)
LOS = E, F, OR 6 or More Travel Lanes 0 LOS = D and < 6 Travel Lanes 1 LOS = A, B, C, and < 6 Travel Lanes 2 MAINTENANCE
(Max Value = 2)
Major or Frequent Problems -1
Minor or Infrequent Problems 0
No Problems 2
TDM / MULTI MODAL (Max Value = 1)
No Support 0
Support Exists 1
CALCULATIONS Segment Score 21
Segment Weight 1
Adjusted Segment Score 21
Corridor Score 21 = LOS A
13
Table 2-3: Pedestrian Level of Service Ratings (Dixon, 1996)
LOS Rating Points
A > 17
B > 14 - 17
C > 11 - 14
D > 7 - 11
E > 3 - 7
F
≤ 3Jaskiewicz (1999) proposed nine measures of PLOS (1) enclosure/definition, (2) complexity of path network, (3) building articulation, (4) complexity of spaces, (5) transparency, (6) buffer, (7) shade trees, (8) overhangs/awnings/varied roof lines, and (9) physical conditions. A simple rating system scores on a scale of 1-5 which means, 1 = very poor, 2 = poor, 3 = average, 4 = good, and 5 = excellent had been used in this method. Then, the scores are aggregated and averaged to obtain the overall LOS. The LOS A to F describe the travel environment (refer Table 2-4) as follows:
Table 2-4: Pedestrian Level of Service Ratings (Jaskiewicz, 1999)
LOS Rating Points Description
A 4.0 to 5.0 Very pleasant
B 3.4 to 3.9 Comfortable
C 2.8 to 3.3 Acceptable
D 2.2 to 2.7 Uncomfortable
E 1.6 to 2.1 Unpleasant
F 1.0 to 1.5 Very unpleasant
Model by Gallin (2001) is another method that uses a point system for PLOS.
She develops a simple model that determine how well a path segment provide the
14 pedestrian’s needs by considering design or physical factors, location factors, and user factors. These factors were classified as (1) Path Width, (2) Surface Quality, (3) Obstructions, (4) Crossing Opportunities, (5) Support Facilities, (6) Connectivity, (7) Path Environment, (8) Potential for Vehicle Conflict, (9) Pedestrian Volume, (10) Mix of Path Users, (11) Personal Security (refer to Table 2-5) and the rating of PLOS are shown in Table 2-6. Unfortunately, the weights and strengths of indicators are based on personal decisions in her model, so this model’s results are biased.
Table 2-5: Assessment Model to Determine LOS for Pedestrians (Gallin, 2001)
Category Factor Weight 0 points 1 point 2 points 3 points 4 points DesignFactors
Path Width
4 No
pedestrian path
0-1 m 1.1 – 1.5 m
1.6 – 2.0 m
More than 2m wide Surface
Quality
5 very poor quality
Poor quality
Moderate quality
Reasona ble quality
Excellent quality
Obstructi ons
3 More than 21
obstructio ns per km
Between 11 and 20 obstructi ons per km
Between 5 and 10 obstructi ons per km
Between 1 and 4 obstructi ons per km
No
obstructions
Crossing Opportuni ties
4 None
provided, difficult to cross
Some provided but poorly located
Some provided and are reasonabl y well located but more are needed
Adequate crossing facilities are provided and are reasonabl y well located
Dedicated pedestrian crossing facilities are provided at adequate frequency
Support Facilities
2 Non-
existent
Few provided and poorly located
Few provided and reasonabl y well located
Several provided and well located
Many provided and well located
Location Factors
Connectiv ity
4 Non-
existent
Poor Reasona ble
Good Excellent
15
PathEnvironm ent
2 Unpleasa nt environm ent, close to vehicular traffic
Poor environm ent, may be within 1m of kerb
Acceptab le environm ent, between 1 and 2m of kerb
Reasona ble environm ent, between 2 and 3m from kerb
Pleasant environment, pedestrians more than 3m from kerb
Potential for Vehicle Conflict
3 Severe, more than 25 conflict points per km
Poor situation, between 16 and 25 conflict points per km
Moderate , i.e. 10 to 15 potential vehicle conflict points per km
Reasona ble, 1 to 10 or less conflict points per km
No vehicle conflict opportunities
User Factors
Pedestrian Volume
3 More than 350 per day
226 to 350 per day
151 to 225 per day
81 to 150 per day
Less than 80 per day Mix of
Path Users
4 Majority of path users are non- pedestrian s
Approx.
51% to 70% of path users are non- pedestria ns
Between 21% and 50%
non- pedestria n path users
Less than 20%
non- pedestria ns
Pedestrians only
Personal Security
4 Unsafe Poor Reasona
ble
Good Excellent security provided
Table 2-6: Pedestrian Level of Service Ratings (Gallin, 2001)
LOS Rating Points Description
A Score 132 or higher Ideal condition
B Score 101 to 131 Reasonable condition
C Score 69 to 100 Basic condition
D Score 37 to 68 Poor condition
E Score 36 or lower Unsuitable condition
16 Sarkar (2002) proposed a qualitative method to compute pedestrian LOS based on six factors which are (1) Safety, (2) Security, (3) Convenience and Comfort, (4) Continuity, (5) System Coherence, (6) Attractiveness. She suggested six pedestrian service levels range from A to F, and the most pedestrian-friendly street is indicated by PLOS level A. She describes qualitative attributes of pedestrian environments but not quantified. Since it is a qualitative method, the measurement of each factor is not easy for practical application. No details were provided for measuring the indicators.
Asadi-Shekari (2011) proposed a pedestrian level of service that introduces complete streets for pedestrian based on different established guidelines in developed countries. The PLOS evaluates the following indicators: (1) Slower traffic speed, (2) Buffer and barriers (curb and furnishing zone), (3) Fewer traffic lane, (4) Mid-block crossing, (5) Landscape and tree, (6) Facility (fire hydrant), (7) Furniture (trash receptacle), (8) Footpath pavement, (9) Marking (cross-walk), (10) Corner island, (11) Sidewalk on both sides, (12) Advance stop bar, (13) Width of footpath, (14) Driveway, (15) Lighting, (16) Signing, (17) Bollard, (18) Slope, (19) Curb ramp, (20) Wheelchair accessible drinking fountain, (21) Tactile pavement (guiding), (22) Tactile pavement (warning), (23) Ramp, (24) Grade, (25) Signal, (26) Bench and seating area and (27) Drinking fountain (28) social space (café). The rating of PLOS is shown in Table 2-7.
This PLOS method can identify the minimum pedestrian facilities that should
be provided on streets based on the indicators and guidelines that she used. Although
the calculation of PLOS is quantitative on how an ideal complete street should be,
however, she categorizes the indicators in the guidelines qualitatively and subjectively
by categorized it to complete, semi complete and not complete based on her judgment.
17 Table 2-7: Pedestrian Level of Service Ratings (Asadi-Shekari, 2011) LOS
Rating
Points Interpretation
A 80-100 Highest quality (very pleasant), many important pedestrian facilities present
B 60-79 High quality (acceptable), some important pedestrian facilities present
C 40-59 Average quality (rarely acceptable), pedestrian facilities present, but there is room for improvement
D 20-39 Low quality (uncomfortable), minimal pedestrian facilities E 1-19 Lowest quality (unpleasant)
F 0 There is no standard pedestrian facility (very unpleasant)
Talavera-Garcia (2015) proposed a Quality of Pedestrian Level of Service (Q- PLOS method). She considers the quality of urban design for pedestrian and its relationship with walking needs. She considers five indicators (1) connectivity, (2) pavement width, (3) Traffic speed and number of lanes, (4) tree density and (5) commercial density based on walking needs such as accessibility, safety, comfort, and attractiveness (refer to Table 2-8 and 2-9). Although this QPLOS method considers urban design factors, it is time-consuming for macro scale factors. It did not sufficiently consider micro level infrastructure and facility detail. This method also requires GIS software to visualize the PLOS rating.
Table 2-8: Summary of selected factors and indicators (Talavera-Garcia, 2015)
Walking needs Indicator Units Comments
Accessibility Connectivity Number of intersections
Number of intersections per segment of street
Pavement width m Safety Traffic speed
and number of lanes
kmph Speed limit. At the maximum speed limit, the number of lanes are included
18
Comfort Tree density Tree/km2 This can be calculated by differentanalysis methods. In this case, we used a search radius of 20 m from each tree
Attractiveness Commercial density
Shops/km2
Table 2-9: Quality of Pedestrian Level of Service (Talavera-Garcia, 2015)
QualityLevel
Connectivity (#
intersections) (1)
Pavement width (m)
(2)
Traffic speed (km/h) and
lanes (3)
Tree density (tree/km2)
(4)
Commercial density (shops/km2)
(5) A (1) Geometric
interval classification
according to the maximum
value of connectivity
in the city
>3 - >20,000 Equal
intervals based on the maximum value
registered in the city
B (2) 3-2.25 20-30 20,000-
15,000
C (3) 2.25-1.5 50 (1 lane) 15,000-
10,000
D (4) 1.5-0.9 50 (2 lanes) 10,000-5000
E (5) <0.9 50 (3 lanes) <5000
2.1.3 The Third Structure of Pedestrian LOS: Quantitative and Qualitative
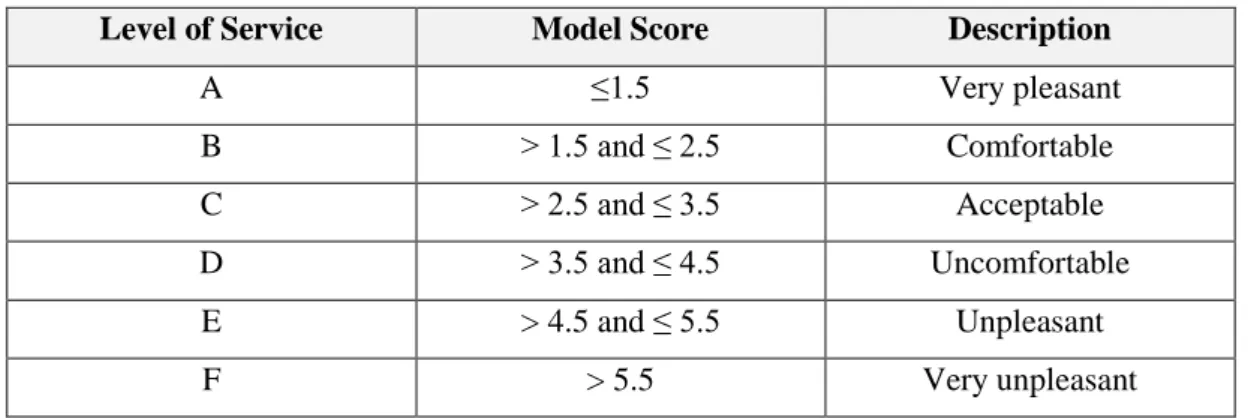
A mathematical model was proposed by Landis et. al (2001) based on five variables: (1) lateral separation of pedestrians from motor vehicle traffic, (2) presence of physical barriers and buffers, (3) outside lane traffic volume, (4) motor vehicle speed, and (5) vehicle mix. The model was developed through a multi variable regression analysis:
Ped LOS = - 1.2021 ln (W
ol+ W
l+ f
p× %OSP + f
b× W
b+ f
sw× W
s) + 0.253 ln
(Vol
15/L) + 0.0005 SPD
2+ 5.3876
19 Where:
W
ol= Width of outside lane (feet)
W
l= Width of shoulder or bike lane (feet) f
p= On-street parking effect coefficient (=0.20)
%OSP = Percent of segment with on-street parking
f
b= Buffer barrier coefficient (=5.37 for trees spaced 20 feet on center) W
b= Buffer width (distance between edge of pavement and sidewalk, feet) f
sw= Sidewalk presence coefficient = 6 – 0.3W
sW
s= Width of sidewalk (feet)
Vol
15= average traffic during a fifteen (15) minute period L = total number of (through) lanes (for road or street) SPD = Average running speed of motor vehicle traffic (mi/hr)
Table 2-10: Pedestrian Level of Service Categories (Landis, 2001)
Level of Service Model Score DescriptionA ≤1.5 Very pleasant
B > 1.5 and ≤ 2.5 Comfortable
C > 2.5 and ≤ 3.5 Acceptable
D > 3.5 and ≤ 4.5 Uncomfortable
E > 4.5 and ≤ 5.5 Unpleasant
F > 5.5 Very unpleasant
LOS A was considered the safest and comfortable (or least hazardous) and LOS F was considered the least safe and comfortable (or most hazardous) (refer to Table 2- 10). The model seems to be a convenient and useful tool for evaluating various street side walking segments but it has following major limitations. The model does not predict LOS as a measure of ease of pedestrian movement on walkway segments. It rather predicts a motor vehicle exposure rating from a pedestrian perspective.
Muraleetharan (2005) proposed a conjoint analysis for the evaluation of
pedestrian LOS. Factors for assessing the pedestrian LOS on sidewalks include: (1)
lateral separation of the pedestrians, (2) width of the sidewalks, (3) obstructions, (4)
20 pedestrian flow rate and (5) number of the bicycle passing and opposing events. Total utility from the conjoint analysis represents an overall value, which specifies how much a user puts on a product or service. The maximum total utility value indicates the best case, while minimum indicates the worst case. Table 2-11 shows the attributes and level of sidewalk proposed by Muraleetharan (2005).
Table 2-11: Attributes and levels of sidewalk (Muraleetharan, 2005)
Level Attributes
Width &
Separation
Obstructions Flow Rate (ped/min/m)
Bicycle events
Level 1 More than 3m wide & excellent separation
No obstructions Less than 24 ≤ 60 events/h
Level 2 From 1.5 to 3m
& reasonable separation
From 1 to 5 obstructions per 100m
From 24 to 49 From 61 to 144 events/h
Level 3 Less than 1.5 m wide & no separation
More than 5 obstructions per 100m
More than 49 > 144 events/h
Tan (2007) developed the pedestrian LOS model by step-wise regression analyses, including (1) the bicycle flow volume, (2) the pedestrian flow volume, (3) the vehicle flow volume, (4) the driveway access frequency and (5) the distance between sidewalk and vehicle lane. He developed the following model:
PedLOS = - 1.43 + 0.006Q
B- 0.003Q
P+ 0.056 Q
V/ W
r+ 11.24 (P – 1.17 P
3) Where,
Q
B= bicycle traffic during a five-minute period Q
P= pedestrian traffic during a five-minute period Q
V= vehicle traffic during a five-minute period (pcu) P = driveway access quantity per meter
W
r= distance between sidewalk and vehicle lane (m)
21 Table 2-12 below may be used as a basis for stratifying the model’s numerical result into the rank of the pedestrian level of service when it is applied to a roadway segment.
Table 2-12: Pedestrian Level of Service Categories (Tan, 2007) Pedestrian Level of
Service
Model Score Description
A LOS < 2.0 Pleasant
B 2.0 ≤ LOS < 2.5 Reasonable
C 2.5 ≤ LOS < 3.0 Acceptable
D 3.0 ≤ LOS < 3.5 Poor
E 3.5 ≤ LOS < 4.0 Unpleasant
F LOS ≥ 4.0 Unsuitable
Hidayat (2011) proposed an alternative model for evaluating the pedestrian level of service at the sidewalk with street vendor’s activities by incorporating qualitative and quantitative variables. Along with pedestrian traffic data, regression models are estimated to find the level of service as a function of the pedestrian perceptions of comfort and problem caused by vendor activities, pedestrian volume, and the number of pedestrians who interact with street vendors. He proposed a multiple regression methods as follows:
Y = 4.774 + 0.518X
1– 0.190 X
2+ 0.001X
3– 0.006X
4Where,
Y = Pedestrian LOS (score of sidewalk’s performance by pedestrian) X
1= FA-1 (Comfort, pedestrian’s perception about sidewalk comfort)
X
2= FA-3 (vendor problem, pedestrian’s perception about problem caused by street vendor)
X
3= Pedestrian volume (the number of pedestrian passing in the sidewalk per 15 minutes)
X
4= Interact with vendors (the number of pedestrian who interact with vendors per 15
minutes.
22 Table 2-13 shows the level of service categories based on the score of assessment. The range of F (LOS ≤ 2.0) to A (9.0 < LOS) can be used to assess sidewalk performance. However, this method only considers few variable and data with smaller sample size.
Table 2-13: Pedestrian Level of Service Categories (Hidayat, 2011) Pedestrian Level of Service Model Score
A 9.0 < LOS
B 7.0 < LOS ≤ 9.0
C 5.0 < LOS ≤ 7.0
D 3.0 < LOS ≤ 5.0
E 2.0 < LOS ≤ 3.0
F LOS ≤ 2.0
Over the years, PLOS models have been changed through development and application in different contexts. There have been several methods created to evaluate the quality of pedestrian LOS (Highway Capacity Manual (2000), Dixon (1996), Jaskiewicz (1999), Gallin (2001), Sarkar (2002), Asadi-Shekari (2011) and Talavera- Garcia (2015), Landis (2001), Muraleetharan (2005), Tan (2007) and Hidayat (2011).
Different researchers have developed both qualitative and quantitative methods
using different attributes that they felt were important to differentiate between good
and bad pedestrian environments. They consider different indicators and evaluation
criteria. Therefore, there is a certain difficulty to define a standard method that can be
applied everywhere because the results of these models are unsuitable for universal
use. Currently, no established approach exists. Therefore, more integrated approach
incorporating more walking needs is still required.
23 2.1.4 The Advantages and Disadvantages of PLOS Evaluation Structure
Based on the literature review discussed above, the following advantages and disadvantages of all types of PLOS evaluation structure are summarized in Table 2-14 as follows:
Table 2-14 Summary of Advantages and Disadvantages of PLOS Methods PLOS Evaluation
Structure
Advantages Disadvantages
First Structure (Capacity-based model)
•
Selection of the indicators and weight.
•
Pedestrians are equivalent to vehicles.
•
Some important indicators, such as qualitative factors, and facilities, are not considered in these types of models and not investigated thoroughly.
•
Not accurately describing the actual walking conditions.
•
Fails to consider the quality of the human experience.
•
Relatively little guidance is
given in the HCM on the
compilation of each factor’s
LOS into a measure of overall
LOS.
24 Second Structure
(Street
characteristic- based model/ Point System)
•
Simple, easy to follow and easily applied.
•
More accessible for non-technical staff.
•
Very common.
•
The system can be extended and adjusted for different contexts.
•
Does not require complex data.
•
Can include various factors.
•
Weight of the various indicators are arbitrarily chosen.
•
Strength and weight of an indicator are based on personal judgement, which increases the bias of the results.
•
Very subjective and difficult to measure.
Third Structure (Regression analysis)
•
Weight and strength of indicators are not on the personal decision.
•
The evaluation methods are complicated and time- consuming.
•
Not easy to interpret the result.
•
Difficult to link the
evaluation methods to design/
decision-making process.
•
Did not sufficiently consider micro level infrastructure and facility details.
•