and Its Application to Biometric Gait Recognition
A THESIS SUBMITTED TO THE KEIO UNIVERSITY FOR THE DEGREE OF DOCTOR OF PHILOSOPHY
IN THE GRADUATE SCHOOL OF SCIENCE AND TECHNOLOGY
March 2010
Koichiro Yamauchi
SCHOOL OF SCIENCE FOR OPEN AND ENVIRONMENT SYSTEMS
Abstract
This thesis presents development of 3D human body measurement system and its application to biometric gait recognition. A triangulation-based structured light system consisting of one camera and one projector obtains range data of a target object. In recent years, the measurement accuracy, speed, and physical size of the system have been dramatically improved, introducing a new class of products known as 3D camera. Unlike a typical camera which acquires 2D pixel data, a 3D camera captures range data as a large number of 3D points on an object’s surface.
The geometric model is defined such that the camera model is based on the pin- hole model, and the projector model is based on the equation of a plane model.
Both camera and projector parameters are estimated by observing a planar ob- ject from three arbitrary viewpoints. One 3D camera cannot completely cover the entire body because of limited range and single view. In our system, four 3D cam- eras are installed in a pole as a measuring unit. The pole unit measures the whole body from head to toe and has a measurement range which is wider than a single 3D camera. We have built a human body measurement system consisting of three pole units for a total of twelve 3D cameras which can capture up to one million 3D points on the human body in only 2 seconds with 1.88 mm measurement accu- racy. This sophisticated system is available for security applications, in particular for deriving the human gait from whole human body data. In our approach, we first measure range data of the entire body which consists of representative poses during a gait cycle and then extract gait features by fitting kinematic models to the data set. Unlike attempts which utilize silhouette images which are affected by clothing and self-occlusion, the positions of joints and body parts can be directly inferred. The experimental results show high identification rates in recognizing a human subject and his/her pose.
Acknowledgments
I wish to thank my supervisors, Hideo Saito and Yukio Sato, for their superb guid- ance. I could not have asked for better support, motivation, or enthusiasm, and working with them has been a great pleasure. I am immensely grateful to com- mittee members, Masafumi Hagiwara, Hiroshi Shigeno, and Yoshimitsu Aoki, for accepting to evaluate this work. I must express my warmest gratitude to Shinji Ozawa and Jun Sato for giving me valuable comments and advices at conferences.
I would also like to thank Bir Bhanu for giving me the opportunity of a visiting scholar at University of California, Riverside. Both Saito Laboratory and VISLab are filled with the most intellectually stimulating, helpful, and affable people that I have ever worked with. It would take a thesis in itself to thank individually ev- eryone that has helped me through the course of my PhD. I am truly grateful to Mitsuru Ambai for providing me encouragement to overcome adverse challenges.
I would also like to thank Takeharu Inukai and Hideo Narita for mutual trust and respect in our friendship. Last, my heartfelt thanks to my family for their encour- agement, support, and love along the way.
Contents
1 Introduction 1
1.1 Motivation . . . 1
1.2 Objective . . . 2
1.3 Context . . . 3
1.4 Contributions . . . 5
1.5 Thesis Outline . . . 6
2 About Range Imaging 9 2.1 Applications . . . 9
2.2 Related Work . . . 12
2.2.1 Sensing . . . 13
2.2.2 Modeling . . . 18
2.3 Thesis Position . . . 21
3 Structured Light System 25 3.1 Introduction . . . 25
3.2 Geometric Model . . . 26
3.2.1 Camera Model . . . 27
3.2.2 Projector Model . . . 29
3.2.3 Triangulation Principle . . . 30
3.3 Calibration Method . . . 31
3.3.1 Camera Calibration . . . 31
3.3.2 Projector Calibration . . . 33
3.4 Experimental Results . . . 35
3.4.1 Calibration . . . 36 i
4 3D Human Body Measurement 43
4.1 Introduction . . . 43
4.2 Human Body Measurement System . . . 45
4.2.1 Projector-Camera Pair . . . 45
4.2.2 Pole Unit . . . 47
4.2.3 System Configuration . . . 47
4.2.4 Measurement Time . . . 49
4.3 Calibration . . . 51
4.3.1 Projector-Camera Pair . . . 51
4.3.2 Coordinate System Alignment . . . 51
4.4 Experimental Results . . . 52
4.4.1 Calibration . . . 53
4.4.2 Evaluation . . . 55
4.4.3 Measurement . . . 56
4.5 Discussion and Conclusion . . . 57
5 Human Gait Recognition 61 5.1 Introduction . . . 61
5.2 Related Work . . . 63
5.3 3D Human Body Data . . . 66
5.4 3D Human Body Model . . . 67
5.5 Model Fitting . . . 69
5.5.1 Body Axes . . . 69
5.5.2 Torso . . . 70
5.5.3 Arms and Legs . . . 72
5.5.4 Head and Neck . . . 72
5.6 Gait Reconstruction . . . 73
5.7 Feature Matching . . . 73
5.8 Experimental Results . . . 74
5.8.1 Sensing and Modeling . . . 75 ii
5.8.3 Recognition . . . 77 5.8.4 Comparisons . . . 79 5.9 Discussion and Conclusion . . . 80
6 Conclusion and Future Work 83
6.1 Summary of the Thesis . . . 83 6.2 Future Work and Possible Extensions . . . 85
Bibliography 89
iii
List of Figures
1.1 Framework for range imaging of a human body. . . 3
1.2 Range data of entire body. . . 5
2.1 Examples of structured light systems. . . 10
2.2 Examples of human body measurement systems. . . 11
2.3 Binary coded pattern and gray coded pattern. . . 13
2.4 De Bruijn pattern and M-array pattern. . . 15
2.5 Modeling results of CAESAR subjects. . . 18
2.6 Digital Michelangelo project. . . 19
2.7 Bayon digital archival project. . . 20
2.8 Classification of sensing and modeling technologies. . . 22
3.1 Geometric model of a structured light system. . . 27
3.2 Calibration scene. . . 31
3.3 Camera calibration. . . 32
3.4 Projector calibration. . . 34
3.5 Three sets of color images and stripe images. . . 36
3.6 Projector parameters. . . 37
3.7 Evaluation spheres. . . 38
3.8 Measurement results of five spheres. . . 39
4.1 Projector-camera pair. . . 45
4.2 8-bit gray coded patterns. . . 46
4.3 Drawing of pole unit. . . 48
4.4 Pole unit and control computer. . . 49
4.5 Measurement result of a man by one pole unit. . . 49 v
4.8 Integration into world coordinate system. . . 51
4.9 Calibration cylinder. . . 53
4.10 Measurement result of the cylinder. . . 54
4.11 Horizontal cross-section. . . 54
4.12 Vertical cross-section. . . 54
4.13 Measurement result of a mannequin. . . 56
4.14 Measurement result of a man. . . 57
4.15 Measurement result of a clothed man. . . 58
5.1 Gait cycle expressed by swing phase and stance phase. . . 66
5.2 3D human body model. . . 67
5.3 Body axes estimation by PCA. . . 70
5.4 3D human body data of walking humans. . . 75
5.5 3D human body model fitted to four poses. . . 76
5.6 Gait sequence composed of twenty frames. . . 77
5.7 Examples of training data and testing data. . . 78
5.8 Virtual frontal view and side view. . . 80
6.1 UCR 3D gait database. . . 86
vi
List of Tables
2.1 Comparisons of structured light patterns for range sensing. . . 16
3.1 Camera parameters. . . 36
3.2 Measurement accuracy of structured light system. . . 38
4.1 4-bit gray encoding and decoding. . . 47
4.2 Measurement accuracy of human body measurement system. . . . 55
5.1 Comparisons of biometrics approaches for human recognition. . . 64
5.2 Bounding angles of rotational joints. . . 68
5.3 3D gait biometrics performance. . . 79
5.4 2D gait biometrics performance. . . 80
vii
Chapter 1 Introduction
1.1 Motivation
The human body has fascinated scientists for thousands of years. Studying the shape of the human body offers opportunities to open up entirely new areas of research. The shape of the human body can be used to infer personal charac- teristics and features. Body type and muscle strength, for instance, can be used to distinguish gender. The presence or absence of wrinkles around the eyes and loose facial skin suggests a person’s age. In addition, the size and shape of a per- son’s face, belly, thighs, and arms can determine a body habitus: slim, healthy, or overweight. The length of individual limbs such as legs and their postural sway when a person walks suggests an underlying misalignment of the bone structure.
It is in fact possible to identify people by their physical body shape of entire 1
body. Unlike traditional physical measures of height, width, and length of body parts, the body shape is represented by a closed surface of the entire human body as a 2-manifold. The surface is digitally captured and described by geometric primitives such as vertices, lines, and curves. It is useful for health professionals and technical experts to retrieve personal data from shared database whenever the need arises. Using a large number of body shape measurements, valuable per- sonal characteristics can be statistically analyzed. If there is a strong correlation between body shape and medical disease, for instance, we can avoid invasive diag- nostic procedures such as medical imaging methods which utilize electromagnetic radiation. Measurement of the shape of the human body also plays a leading role in medical diagnosis; it may even be possible to discover unexpected diseases through studying body shape. The differences among people of both sexes, young and old vary considerably in size and volume. In addition, the target is not only body parts such as face, finger, and ear, but also entire body including all of them.
The focal issue involved in the use of entire body is how to exploit a vast amount of information. Therefore, it is challenging to know human mechanism from the appearance of human body and establish basic technologies for human under- standing. A breakthrough in the fields of computer vision and pattern recognition will cause a paradigm shift well known as the structure of scientific revolutions.
1.2 Objective
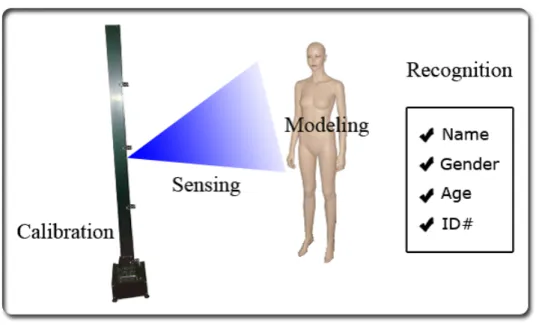
This thesis provides new techniques for 3D human body measurement and recog- nition of walking humans. We address four sub-goals of the measurement and recognition: system calibration, range sensing, body modeling, and feature recog- nition. These tasks, illustrated in Fig. 1.1, are defined as follows:
System calibration aims to estimate intrinsic and extrinsic parameters represent- ing the geometry of camera and projector and the relationships among the projector-camera pairs.
Range sensing addresses shape recovery from images of the camera and lights of the projector. Single or multiple projector-camera pairs are assigned around a target depending on the size of object.
Figure 1.1: Framework for range imaging of a human body.
Body modeling aims to approximate body data by a simplified body model indi- cating the position, length, and volume of main parts of a human body used as physical features.
Feature recognition addresses identifying individuals through the process of fea- ture matching to retrieve personal information such as name, gender, age, and ID number that is stored in the database.
The concept of four terms will be introduced throughout this thesis to form a framework which contains four-tiered structure. Here, the terms/tiers are num- bered in order of calibration, sensing, modeling, and recognition from bottom to top. The upper tier task works properly when the lower tier tasks have been per- formed.
1.3 Context
Three-dimensional shape measurement is a technique for recovering the surface of a target object. Attempts have been successful in digitalizing the object rep- resented by Cartesia coordinates in three dimensions. For shape reconstruction,
the combination of camera and projector is known as a minimum configuration.
Source of light, i.e. projector, emits a plane of light which creates a narrow stripe on the scene. Since line of sight, i.e. camera, intersects with the light stripe, coor- dinates of all points along the stripe are obtained by triangulation principle. The geometry of projector-camera pair is represented by parameters corresponding to one side and two angles of a triangle. The parameters are estimated through calibration process which is designed to obtain accurate measurement results.
The projection of light stripe offers several advantages in human body measure- ment. Especially, noncontact system does not take psychological and psycho- logical pressures for a subject. Without any severe pose restrictions, the subject can change his/her pose and expression. Then, it is considered to finish the mea- surement as soon as possible to avoid the effects of body sways or shaky hand increasing every second. The measurement time is fast enough to cover for every- one from children to the elderly. In addition, the body surface is represented by a large number of points with high degree of accuracy. The points indicate not only anatomical landmarks but also as 2-manifold, i.e. closed surface. Furthermore, the light stripe has little adverse effect on the human body, in particular eyes. We can repeat the measurement as many times as we want with a sense of security.
Subsequently, three-dimensional image processing is a technique for analyz- ing the surface of a target object. Range data is comprised of range image whose pixels obtain coordinates value and color image whose pixels obtain color value.
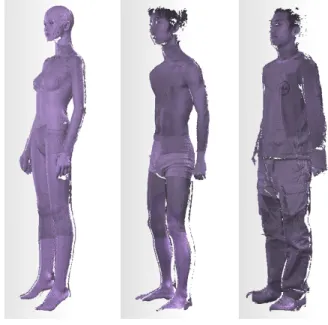
The resolution and accuracy depend on the number of pixels of the camera and the number of light stripes of the projector. For human body measurement, this type of system has targeted for small object such as face, finger, and ear. Re- cently, whole body which has large amount of information is subjected to study of sensing and modeling. Fig. 1.2 shows the range data of entire body for three subjects: mannequin, man, and clothed man. The data has approximately one mil- lion points, and also color information on every point. Of course, whole human body data includes all of body parts which have been individually captured by a range scanner. Biometrics system based on whole body comprises multimodal biometrics approaches and enhances the performance of personal identification.
Especially, we focus on human gait consisting of combined physiological and be- havioral features. The amount information of range data which includes depth
Figure 1.2: Range data of entire body.
and color, i.e. three-dimensional data, is not half as much again as that of video sequences which include only color, i.e. two-dimensional data. Intuitively, the video sequences only grab a piece of information, but range data acquires all of them, in other words, we can observe a target object from arbitrary viewpoints in three dimensions. Although it has been challenging to advance from the research and development stage, existing devices and applications do not become widely used. The seeds of technology need to meet the needs of consumers by develop- ing a new market and exploring the capability. We have to distinguish what one really needs from what one thinks one needs. This thesis attempts to tackle range imaging technology of measuring and processing.
1.4 Contributions
The primary contributions of this thesis are threefold:
• Structured light system is defined that the camera is based on the pinhole model and the projector is based on the equation of a plane model. The pa- rameters are estimated by observing a planar object from three viewpoints.
The geometric model provides highly accurate range data and the calibra- tion method facilitates the procedure of user’s task.
• Human body measurement system captures range data of entire body within a couple of seconds with high resolution and high accuracy. The pole unit consistes of four projector-camera pair to capture range data from head to toe. Whole human body data is acquired by two or more independent pole units placed around a subject.
• Human gait recognition is one of the most recent biometrics approaches for personal identification by the manner of walking. 3D gait biometrics cap- tured by the human body measurement system provides highly reliable au- thentication unlike 2D gait biometrics approaches and motion capture meth- ods using a single or multi-camera system.
1.5 Thesis Outline
The body of this thesis is divided into six chapters, the first of which is this intro- duction.
Chapter2. This chapter investigates range imaging commercial products, repre- sentative applications, coded structured light projections, and sensing and modeling technologies.
Chapter3. This chapter describes geometric model and calibration method for a structured light system which consists of one camera and one projector through a planar object.
Chapter4. This chapter introduces compact, high speed, high resolution, and high accuracy human body measurement system using multiple projector- camera pairs.
Chapter5. This chapter presents 3D gait biometrics recognition based on interpo- lation of continuous motion using whole human body data of representative poses during walking.
Finally, we conclude with a summary of the thesis and some suggestions of future work.
Chapter 2
About Range Imaging
2.1 Applications
A triangulation-based structured light system consists of a camera and a projector.
The system is similar to passive stereo vision system whose camera is replaced by the projector. Range data encapsulating range image and color image is ob- tained by the camera observing a target object illuminated from the projector. The commercialization of research achievements in range imaging has already been realized. Fig. 2.1 is the examples of structured light systems. VIVID910 of KON- ICA MINOLTA captures range data in 0.3 seconds with 8, 14, 25 mm focal length and 640×480 pixels. The structured light based on light section method is made by galvanometer mirror. This system provides 3D CAD software to edit and pro- cess the data. Cartesia 3D Handy Scanner of SPACEVISION captures range data
9
KONICA MINOLTA SPACEVISION
VIVID910 Cartesia
Figure 2.1: Examples of structured light systems. Courtesy of KONICA MI- NOLTA and SPACEVISION.
in 0.5 seconds with 8 mm focal length and 640 × 480 pixels. The structured light based on space encoding method is made by polygon mirror. This system is slim and compact using one USB 2.0 cable instead of any AC power cables and transmission cables.
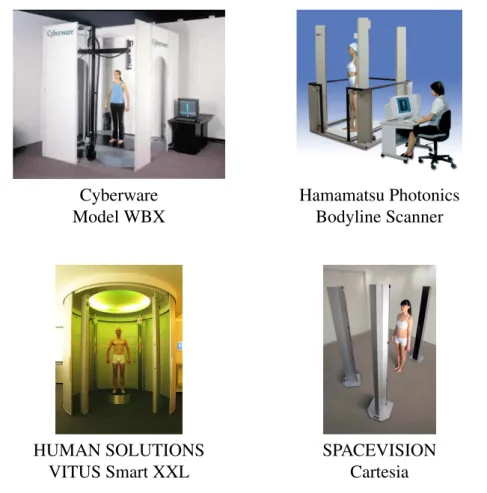
While structured light system is designed for general use, some systems spe- cialize in capturing range data of an entire body. Fig. 2.2 is the examples of human body measurement systems. Model WBX of Cyberware captures whole human body data in 17 seconds with 1.2 mm horizontal, 2.0 mm vertical, and 0.5 mm depth resolution. The data is represented by X, Y, and Z coordinates for shape and RGB values for color. Bodyline Scanner of Hamamatsu Photonics completes the measurement in 5 seconds using four scanning heads based on light section method. This system takes subject’s size by detecting landmarks automat- ically. They are applicable to offer custom-made clothes. VITUS Smart XXL of HUMAN SOLUTIONS proposes to integrate avatars with real body dimensions and attributes into design programs. This system is part of the program incorpo- rating three separate stages: measurement, simulation, and integration. Cartesia 3D Body Scanner of SPACEVISION captures whole human body data including one million points in 3.6 seconds using three pole units based on space encod- ing method. This system is not divided by a wall or curtain, and the installation space is reduced by independent measuring units. Here, the pictures in Fig. 2.1 and Fig. 2.2, which are the copyrights of Cyberware, Hamamatsu Photonics, HU- MAN SOLUTIONS, KONICA MINOLTA, and SPACEVISION, are permitted to
Cyberware Hamamatsu Photonics
Model WBX Bodyline Scanner
HUMAN SOLUTIONS SPACEVISION
VITUS Smart XXL Cartesia
Figure 2.2: Examples of human body measurement systems. Courtesy of Cyber- ware, Hamamatsu Photonics, HUMAN SOLUTIONS, and SPACEVISION.
use for this thesis.
Last decade, range imaging has proved as an emerging technology for a wide variety of applications. In the medical field [1, 2], X-ray [3], i.e. radiography, CT [4], i.e. computerized tomography, MRI [5], i.e. magnetic resonance imaging, represent volume data of a subject and visualize body shape. Although internal or- gans, vessels, and bones clarify health condition, some parts of that are diagnosed by surface shape. For example, BMI [6], i.e. body mass index, which compares subjects’ weight and height, provides a healthy body weight depending on the body height. Range data from the neck to the waist derives such information. In addition, the differences before and after surgery and body changes while dieting are recorded. In the fashion field [7, 8], fashion designers measure body size with
tools, such as a tape measure and a ruler. Their rich experiences through basic practices also support to custom-made clothes. Range data is useful to remove this laborious task and measure the size at different places without craftsmanship.
For example, some human body measurement systems obtain landmarks of a hu- man body, and then compute body size automatically. In other cases, the systems employ a semi-automatic approach using attached markers. After that, we virtu- ally try on a lot of different clothes changing the size, color, and material. In the graphics field [9, 10], aesthetically pleasing virtual mannequins are based on a limited number of user-specific criteria such as a waist circumference, chest, and weight. For example, whole human body data are grouped into a user-specified number of clusters, which are formed through the clustering of the anthropometric database. The body data whose shape is closest to the virtual mannequin is re- trieved and subsequently used to adjust the virtual mannequin. In contrast, some approaches employ simplified virtual models, e.g., stick figure model, cylinder model, and blob model. These models are directly fitted to whole human body data with/without apriori knowledge. In the security field [11, 12, 13], biomet- rics systems generally use color images or video sequences, and extract features for human recognition. Although they are successfully gaining and are available for security applications, range data holds enormous potential for the improve- ment of recognition rate and robustness. Biometrics approaches using range data of face, finger, and ear have proven the effectiveness and reliability. In the near future, whole human body data will be used for biometrics system.
2.2 Related Work
Related work is divided into two parts. In the first part, sensing technology covers representative structured light patterns: light section method, binary coded pat- tern, gray coded pattern, De Bruijn pattern, and M-array pattern. In the second part, modeling technology targets humans, sculptures, status, and sites from small object to large-scale environment.
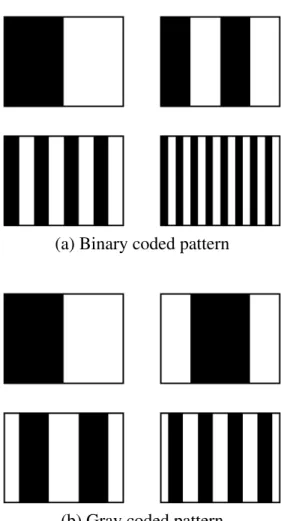
(a) Binary coded pattern
(b) Gray coded pattern
Figure 2.3: Binary coded pattern and gray coded pattern.
2.2.1 Sensing
Coded structured light projection is one of the highly reliable techniques for the acquisition of range data. The projector emits a structured light to a target object and encodes the scene captured by the camera. The pixels on the image are de- coded by either zero or one. The range data is computed by triangulation principle among the camera, projector, and target object. This type of device is called as structured light system. In 1971, Shirai [14] proposed the light section method which scans a light stripe from one side to the other. The projected light stripe is approximated by line segments, the slope and distance of which are used for object recognition. Y. Satoet al.[15] proposed a method for the acquisition of complete
range data using a turntable. If both camera and projector observe a target ob- ject from one direction, they cannot observe the sides and the back of the object.
Using the controlled turntable, one direction view is changed to omnidirectional view. Arakiet al.[16] proposed a method for high speed range imaging within a few milliseconds. The integrated circuit consists of the optical part, control part, and signal processing part. This system performs to scan a light stripe and com- pute the position simultaneously. Kanadeet al.[17] proposed the system based on VLSI sensor array. Unlike most systems which perform step-and repeat process of the camera and projector, the sensor includes both photosensitive and signal processing circuits. This system achieves range data up to one thousand frames per second. In stead of a single light stripe, several coding strategies have been studied so far. Fig. 2.3 shows the binary coded pattern and the gray coded pattern.
In 1982, Posdamer and Altschuler [18] presented the binary coded pattern. The projection ofppatterns are the same as the projection of2plight stripes. When we use the eight patterns, the number of scanning times is dramatically reduced from 256 to8. Altschuler et al. [19] presented the system using dot matrix of binary light beams. Each column of the pattern is independently controlled to be either lighted or obscured. It allows coding any pattern dot as a sequential projection of different patterns. In 1984, Inokuchiet al.[20] presented the gray coded pat- tern. The advantage of this pattern is robust to noise or encoding/decoding error, because the consecutive codeword has the Hamming distance of one. The gray coded pattern is adapted for practical use and used for the following systems. K.
Sato and Inokuchi [21] presented the system using an electrically controlled liq- uid crystal device. The pattern is generated with speed and precision compared to a slide projector. To improve the decoding error, reference image is used to define dynamic thresholds for all of pixels. Y. Sato and Otsuki [22] presented the system, called Cubicscope, using a semiconductor laser and a synchronized scanned mirror. The pattern is generated by scanning and switching of one light stripe. This system provides high power illumination with low heat radiation, and also encourages the reduction of size and weight. Gunaratneet al.[23] developed face measurement system, based on Cubicscope, consisting of two cameras and one projector. While other systems consisting of one camera and one projector fail to capture nose and face line, the system successfully acquires dense range
(a) De Bruijn pattern
(b) M-array pattern
Figure 2.4: De Bruijn pattern and M-array pattern.
data of them. Hasegawa et al. [24] developed electronic endoscope system for computer-aided diagnosis. This system captures range data of organ by emitting the pattern from the endoscope tip through flexible tube. Appearance of the af- fected part is represented by both shape and color. Aoki et al. [25] developed tooth measurement system for the visualization of jaw movement. Range data of upper and lower tooth are separately acquired, and then the positions of the data are brought into occlusion using attached markers. Kouchi and Mochimaru [26]
developed foot measurement system for designing shoes. The foot scanner, which is the product of INFOOT, is consisted of four projectors and eight cameras. It is capable of acquiring range data of foot in 10 seconds at 1.0 mm intervals. Anatom- ical landmarks are measured by using attached markers. As stated above, it has been preferable to use light stripes to recover shape of an object with a high de- gree of accuracy. Most systems which utilize structured light achieve dense data compared to other type of range sensor.
Subsequently, pseudorandom sequence and array are used to encode patterns
Table 2.1: Comparisons of structured light patterns for range sensing.
Technique Accuracy Speed Authors
Light section method ? ? ? [14, 15, 16, 17, 26]
Binary coded pattern ? ? ? ? [18, 19]
Gray coded pattern ? ? ? ? ? [20, 21, 23, 24, 25]
De Bruijn pattern ? ? ? ? [27, 28, 29, 30]
M-array pattern ? ? ? ? [31, 32, 33, 34]
for acquiring range data at once. Fig. 2.4 shows the De Bruijn pattern and the M- array pattern. First, De Bruijn pattern is based on cyclic string to identify a fixed length substring over the string. The string is constructed by searching Hamilto- nian path or Eulerian path over De Bruijn graph. Boyer and Kak [27] proposed three colored pattern consisting of vertical lines. This pattern is generated by a se- quence of vertical lines which are colored with any combination of red, green, and blue. Their specific hardware obtains the index and position of three colors peaks in real time. Vuylsteke and Oosterlinck [28] proposed the monochrome pattern using four primitives. This pattern structure is a checkerboard where grid points are encoded by either bright or dark spot. The sequence which forms two rows is compacted and insensitive to surface discontinuities. Salviet al. [29] proposed the six colored pattern consisting of vertical and horizontal lines. The vertical lines are represented by magenta, cyan, and yellow, and the horizontal lines are represented by red, green, and blue. The grid points are easily segmented, and also neighbors are detected by tracking along the edges. L. Zhanget al. [30] proposed the eight colored pattern consisting vertical lines. The correspondence between points in the pattern and pixels in the image is resolved by multi-pass dynamic programming. To increase the resolution, the pattern is shifted to the right in time and located the lines with sub-pixel accuracy. Second, M-array pattern is based on unique matrix to identify a fixed size submatrix over the matrix. Moritaet al. [31]
presented the two monochrome patterns using black dots. The first pattern con- tains all of black dots to determine their positions and the second pattern contains M-array representation. Although this method is restricted to static scenes, it is applicable to dynamic ones by only emitting the second pattern. Griffinet al. [32]
presented the monochrome pattern using five primitives. This pattern matrix is a special case of perfect maps which is made by a systematic process. Each ele- ment has a unique codeword formed by its value and the values of four neighbors.
Moranoet al. [33] presented the three colored pattern consisting red, green, and blue dot array. This pattern growth of the matrix consists of a random assignment of colors from the available palette for undefined elements adjoining the estab- lished pattern. Kimuraet al. [34] presented foot measurement system for motion analysis during walking. The three colored pattern is represented by pixels and cells assigned red, green, and blue. Since foot has smooth surface with uniform reflectance, it is suitable as a target for the measurement.
Obviously, these systems which utilize colors and primitives sometimes fail to decode the projected pattern on the surface of an object especially for colorful and complex shapes, although they can obtain range data in real time. Table 2.1 compares five kinds of structured light patterns presented in this chapter. Here, the number of symbol indicates three-star scale. The binary coded pattern and the gray coded pattern provide high degree of accuracy because of the projection of a large number of light stripes. Especially, the gray coded pattern whose light stripe has the Hamming distance of one is robust to decoding error. The light section method also provides high degree of accuracy, but background subtraction which detects scanning light stripe is required. The De Bruijn pattern and the M-array pattern depend on decoding process to extract colors and primitives of the pattern. Their use is limited to neutral color scene or simple object, so that the measurement accuracy is not stable enough. In contrast, the light section method which scans a light stripe from one side to other takes a long time. The binary coded pattern and gray coded pattern which usually emit eight or more patterns are slightly better than the light section method. The De Bruijn pattern and the M-array pattern have successfully captured range data in real time so far.
Definitely, we would argue for accepting the gray coded pattern. The first priority for range imaging is to obtain range data with a high degree of accuracy. We intend to derive valuable information about both inside and outside of the object from the surface shape, and also develop them for various purposes including anthropometric and archaeological applications. The accurate range data leads to system performance enhancement and significantly boosts the reliability of its
Figure 2.5: Modeling results of CAESAR subjects. Courtesy of Brett Allen [38].
results. The second priority is measurement time. Although the light section method is slower than De Bruijn pattern and M-array pattern, this problem has already been addressed by the integrated circuit implementation for sensing the scene and computing the position. The gray coded pattern is overcoming through increasing the shutter speed of the camera, projection speed of the projector, and switching speed between the camera and the projector.
2.2.2 Modeling
The anthropometry has been emerging as leading-edge applications for range imaging. Especially, human body attracts an awful lot of attention at the moment.
The dedicated device which captures range data of entire body is known as human body measurement system. CAESAR project [35, 36] is a survey of whole body measurements for people ages 18-65 in three countries: United States, Nether- land, and Italy. Five types of data are recorded: demographic information, 40 measurements taken with a tape measure, 60 measurements captured by a body scanner, complete range data of three postures, and 73 coordinates of specified landmarks. The total number of samples is approximately fifteen thousand. For data collection, two scanners which are built by Cyberware and Vitronic are used.
Both scanners use similar measurement principle based on light section method.
The projector emits a light stripe to the surface of a subject and moves from the top to the bottom. Then, the camera observes the projected light stripe from two directions at the same time. Whole human body data is recovered by triangula- tion principle. AIST/HQL database [37] contains a total of 97 samples including
(a) Scanning (b) Modeling
Figure 2.6: Digital Michelangelo project. Courtesy of Marc Levoy [40, 41].
49 men in the 20-30 age group and 48 women in the 20-35 age group in Japan.
Five types of data are recorded: demographic information, 91 anthropometrical dimensions, 21 landmarks, 3D data, and 3D model. The demographic informa- tion is measurement date, birth date, age, and sex. The dimensions and landmarks are measured by two experts manually. Body data is collected by the commer- cial product of Hamamatsu Photonics. This system based on light section method captures body data in 11 seconds within±0.5 percent measurement accuracy. Af- ter that, body model is represented by not only vertices and polygons but also 26 positions of cross-section. The database is used for statistical analysis and open to the public on the website. However, starting from a range scan, we need to process the noisy and incomplete surface into a complete model suitable for applications.
Further, the scanned data has holes caused by self-occlusions and grazing angle views. Allen et al.[38] proposed a method for fitting high resolution template meshes to detailed human body range scans with sparse markers. Fig. 2.5 is the modeling results of CAESAR subjects. Affine transformation at each template vertex is formulated as an optimization problem. The object function trades off fit to the range data, fit to scattered markers, and smoothness of the transformations over the surface. Anguelovet al.[39] introduced SCAPE method for building a human shape model which incorporates both articulated and non-rigid deforma- tions. The SCAPE model is used for shape completion, partial view completion, and motion capture animation using just a single static scan and a marker mo-
(a) Scanning (b) Modeling
Figure 2.7: Bayon digital archival project. Courtesy of Katsushi Ikeuchi [44, 45].
tion capture sequence of the person. This method generates realistic meshes with muscle deformation for a wide range of subjects and their poses.
Large-scale environment in the archaeology field has been selectively tar- geted by improving the sensing and modeling technologies. Digital Michelan- gelo project [40, 41] is to involve in digitizing the sculptures and architectures of Michelangelo. Fig. 2.6 is the scanning scene and the modeling result. The statue of David is captured by a structured light system mounted on a motorized gantry.
Since, the focus of this project is to protect both physical shape and geometric rep- resentation such as vertex coordinates, surface normals, and connectivity informa- tion, the system acquires a total of two billion polygons and seven thousand color images for three weeks. After scanning, pipeline processing aligns range data taken from different positions, and then the range data are combined into a unified surface mesh filling any holes automatically. Finally, the model containing eight million polygons is rendered. While it is necessary to measure human body at high speed, the resolution and accuracy are as important as the measurement time. This way of thinking leads to trade-off problem. Great Buddha project [42, 43] focuses on the preservation and restoration of Asuka, Kamakura, and Nara Buddha. The framework of geometric modeling incorporates three separate steps: acquisition, alignment, and merging. The first step is to acquire range data by laser range sen- sors. The sensors capture a set of partial mesh models, overlapping each other and covering the entire object surface. The second step is to align partial mesh models.
Each sensor is located at an arbitrary position on data acquisition, so that relative
relations of these models are determined by considering resemblances in the data set. The third step is to merge the aligned multiple mesh into a complete mesh model. The entire object is represented by one surface from multiple overlapping surface observations. Asuka, Kamakura, and Nara Buddha contain three million meshes, ten million meshes, and seventy million meshes, respectively. Bayon dig- ital archival project [44, 45] is to reconstruct the Bayon temple which is located at the center of Angkor-Thom. This is a huge structure, i.e. more than 150 me- ters long on all sides and up to 45 meters high, including 51 towers, 173 calm, smiling faces carved on the towers, and double corridors carved in beautiful and vivid bas-relief. Fig. 2.7 is the scanning scene and modeling result. Flying laser range sensor which is suspended beneath a balloon measures structures invisible from the ground. The obtained data has some distortion due to the movement of the sensor during the scanning process, so that alignment algorithm estimates not only rotation and translation but also motion parameters. The resulting 3D model consists of twenty thousand range images and its total size is about two hundred gigabytes.
2.3 Thesis Position
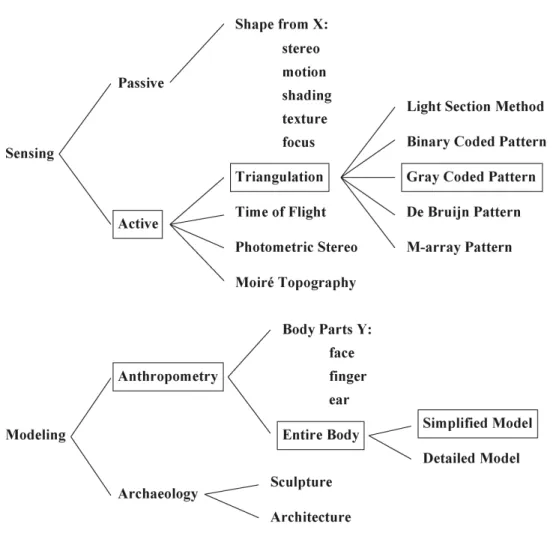
To clarify the position of this thesis in range imaging, sensing and modeling tech- nologies including several levels are arranged in a treelike structure, as illustrated in Fig. 2.8. First, sensing technology is classified according to passive and ac- tive range sensing. In passive sensing, shape recovery techniques are called as shape from X such as stereo, motion, shading, texture, focus. Using single or multi-camera, they achieve range data in real time with low resolution and low accuracy. In active sensing, representative techniques are triangulation, time of flight, photometric stereo, and moir´e topography. Combining camera and projec- tor, they achieve range data in no real time with high resolution and high accuracy.
Although there are a variety of techniques, the first and foremost priority is to ob- tain high resolution, highly accurate range data. In Chapter 3 and Chapter 4, we employ active range sensing by triangulation principle. Especially, gray coded pattern is the most reliable structured light pattern considering not only the resolu- tion and accuracy but also the speed and robustness. Second, modeling technology
Figure 2.8: Classification of sensing and modeling technologies.
is classified into two categories: anthropometry and archaeology. In the anthro- pometry, the target is not only body parts Y such as face, finger, and ear, but also entire body including all of them. The measurement of the human body is useful for human understanding. In the archaeology, the target objects are sculpture and architecture. It aims to protect cultural assets which have been deteriorated over the centuries by digitalizing the object’s surface. Although biometrics systems have used face, finger, ear, and their multimodal data, nobody tries security appli- cation using whole human body data. In Chapter 5, we focus on anthropometry covering entire body. Unlike detailed model which collect physical measures and anatomical landmarks, simplified model is used to extract the position, length, and
volume of main parts of a human body. In this thesis, these sensing and modeling technologies are related to development of 3D human body measurement and its application to biometric gait recognition.
Chapter 3
Structured Light System
3.1 Introduction
Pair of one camera and one projector, i.e. structured light system, is minimum configuration for range imaging. The geometry of the structured light system is approximated by either simple model or complex model. The simple model rep- resents the system by simplifying the geometry with the small number of param- eters. In contrast, the complex model represents the system by complicating the geometry with the large number of parameters. Naturally, the geometric model is designed for high accuracy measurement against the loss of versatility.
Typical geometric model encapsulates two separate models: camera model and projector model [46]. Generally, the pinhole model is the most commonly used representation [47, 48, 49]. The camera geometry is represented by a 3×4
25
matrix having 11 degrees of freedom and the projector geometry is represented by a 2×4 matrix having 7 degrees of freedom. The two projection matrices provide range data by the principle of binocular stereo. Although the pinhole model is suited for the camera geometry, it is not applicable to the projector geometry. For example, light stripes do not always pass through the optical center of the projector using a rotatable mirror, e.g., galvanometer mirror and polygon mirror.
Subsequently, the triangulation principle based on the baseline is also utilized.
Given one side and two angles of a triangle determine the position of a target ob- ject. One side is the baseline which is defined as the distance between the camera and the projector. One of the angles indicates camera view and the other indicates projector view. The invariable baseline model [50, 51, 52] fails to represent some projectors using a rotatable mirror, but the variable baseline model [53, 54, 55]
eases this problem. However, these models assume that all of light stripes are vertical to the baseline. It is preferable to express the light stripe by a three- dimensional plane disregarding the inner structure of the projector.
In this chapter, the problem of geometric model for a structured light sys- tem is addressed. The geometric model is defined such that the camera model is based on the pinhole model and the projector model is based on the equation of a plane model. If light stripes are projected in different directions, their projec- tions are expressed accurately. Furthermore, the camera and projector parameters are estimated by observing a planar object from three viewpoints. Unlike other approaches using cube objects [56, 57], it facilitates the procedure of user’s tasks and provides a high degree of accuracy.
3.2 Geometric Model
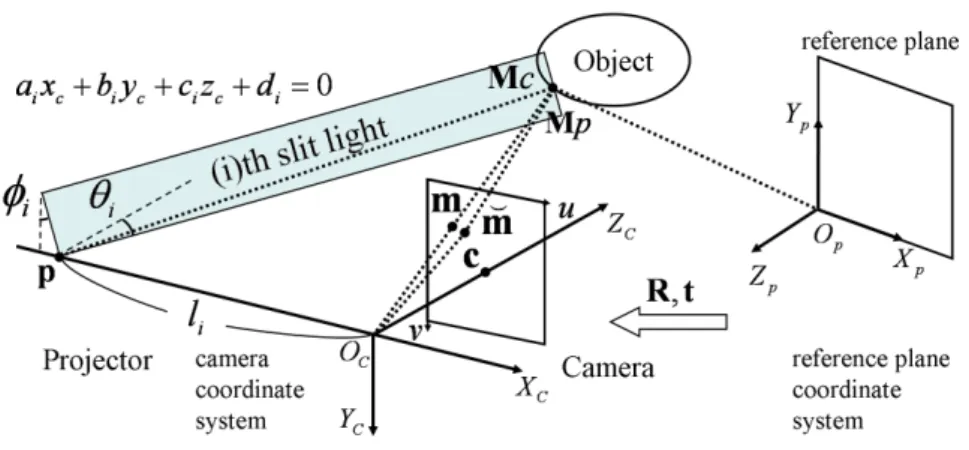
A structured light system consists of a camera and a projector. The system cap- tures a range data by the camera observing a target object illuminated from the projector. Fig. 3.1 is the geometric model of a structured light system. The cam- era model is based on the pinhole model and the projector model is based on the equation of a plane model. The geometric model is represented in the camera coordinate system and the reference plane is represented in the reference plane coordinate system.
Figure 3.1: Geometric model of a structured light system.
3.2.1 Camera Model
Pinhole model is defined that light rays from an object pass through the optical centerOcfor imaging. The principal pointcat the intersection of the optical axis with the image plane is denoted by [u0, v0]. Xc-axis, Yc-axis, and Zc-axis are parallel to horizontal axis, vertical axis, and optical axis of the image plane. Here, a 2D point, i.e. image coordinates, m is denoted by [u, v] in the image plane, and a 3D point, camera coordinates, Mc is denoted by[xc, yc, zc] in the camera coordinate system (Oc-Xc-Yc-Zc). In addition, Xp-axis,Yp-axis, Zp-axis, andOp are defined as horizontal axis, vertical axis, orthogonal axis, and the coordinate origin of the reference plane. Here, a 3D point, i.e. reference plane coordinates, Mpis denoted by[xp, yp, zp]in the reference plane coordinate system (Op-Xp-Yp- Zp). The perspective projection which maps the reference plane coordinates onto the image coordinates is given by
me 'A h
R t
iMep, (3.1)
with A=
α γ u0 0 β v0 0 0 1
,
whereAis the camera intrinsic matrix with the scale factors,α,β,γ, and the prin- cipal point,u0,v0, i.e. the intrinsic parameters, and[ R t ]combines the rotation
matrix and the translation vector, i.e. the extrinsic parameters. The tilde indicates the homogeneous coordinate by adding 1 for the additional element: me = [u, v,1]
andMep = [xp, yp, zp,1]. The Euclidean transformation which transforms the ref- erence plane coordinates to the camera coordinates is given by
Mc = h
R t
iMep, (3.2)
with R=h
r1 r2 r3 i
,
wherer1, r2, r3 correspond to unit vectors to indicate the directions ofXp-axis, Yp-axis,Zp-axis, respectively. tis the direction vector fromOp toOc. Therefore, camera parameters provide the perspective projection and the Euclidian transfor- mation.
Let us consider camera lens distortion and its removal. The radial distortion causes the inward or outward displacement of the image coordinates from their ideal locations. This type of distortion is mainly caused by flawed radial curvature curve of the lens elements [58, 59]. Here, a distorted 2D point, i.e. real image coordinates, m˘ is denoted by [˘u,v]. The discrepancy between the ideal image˘ coordinates and the real image coordinates considering first two terms of radial distortion is given by
m˘ =m+ [k1mˆTmˆ +k2( ˆmTm)ˆ 2](m−c), (3.3) wherek1 and k2 are the coefficients of the radial distortion, the center of which is the principal point. Here, a normalized 2D point, i.e. normalized image coor- dinates,mˆ is denoted by[ˆu,v], the focal length of which is defined by 1 as seenˆ in [60] is given by
mˆ =A−1m. (3.4)
Therefore, camera lens distortion can be corrected from captured images. For more detail on camera geometry, refer to computer vision literatures [61, 62].
3.2.2 Projector Model
The projector emits one to hundreds of light stripes for the measurement. We consider the case in which the light stripes are projected in different directions. It is difficult to assume that the projector model is based on the pinhole model, be- cause they do not pass through the optical center. Therefore, we use the equation of a plane model to accurately represent the projector instead of considering the projection of the light stripes which depend on the type of projector. In the camera coordinate system, the light stripe can be written as
aixc+biyc+cizc+di = 0, (3.5) wherei is the light stripe number, andai,bi,ci,di are the coefficients of the equation. There are an equal number of the equations of planes and the light stripes. Intuitively, the intersection ofXc-axis and the light stripe,p, moves from the left to the right on the axis.
We defineli is the baseline, i.e. the distance between the optical center of the camera and the light stripe of the projector,θiis the projection angle, i.e. the angle betweenZc-axis and the light stripe, andφi is the tilt angle, i.e. the angle between Yc-axis and the light stripe. From the coefficients of the equation, these explicit parameters can be written as
li = di/ai, (3.6)
θi = arctan(−ci/ai), (3.7) φi = arctan(−bi/ai). (3.8)
Projector parameters are expressed by both implicit and explicit representations.
The coefficients are used for computation of range data, but their values do not ex- hibit distinct features. In contrast, the baselines, projection angles, and tilt angles provide characteristic distributions.
3.2.3 Triangulation Principle
To achieve range data, the projector emits light stripes to a target object, and then the camera observes the illuminated object. So, the camera coordinates is the intersection of the viewpoint of the camera and the equation of a plane of the projector. The linear equation [xc/zc, yc/zc,1/zc] which is derived from (3.1), (3.2), and (3.6) is given by
α γ 0
0 β 0 ai bi di
xc/zc yc/zc 1/zc
=
u−u0 v−v0
−ci
. (3.9)
Consequently, we have
xc = (u−u0)− γβ(v−v0)
α zc, (3.10)
yc = v −v0
β zc, (3.11)
zc =
di
ai
−acii − (u−u0)−
γ β(v−v0)
α −abii(v−vβ0)
. (3.12)
The coordinate zc is computed by the relationship between the viewpoint of the camera and the equation of a plane of the projector. Then, the coordinate xc and the coordinateycare computed by the similar triangle related to the camera.
Therefore, the camera coordinates can be recovered by the camera and projec- tor parameters. The coordinatezcwhich is expressed by the baseline, projection angle, and tilt angle instead of the coefficients can be written as
zc = li
tanθi−(u−u0)−
γ β(v−v0)
α + tanφi(v−v0) β
. (3.13)
It indicates the triangulation principle based on one side and two angles of a tri- angle.
Figure 3.2: Calibration scene.
3.3 Calibration Method
In this section, we present a calibration method for a structured light system by observing a planar object from three viewpoints. Fig. 3.2 is the calibration scene of a structure light system. The planar object, called reference plane, contains a checkered pattern, so that calibration points are detected as the intersection of line segments. To perform the calibration, the reference plane coordinates is assigned to the calibration points. Three sets of color images and stripe images, which capture calibration points and light stripes on the reference planes respectively, are required. Our approach incorporates two separate stages: camera calibration and projector calibration.
3.3.1 Camera Calibration
In the camera calibration stage, camera parameters are obtained by Zhang’s method [63]. Fig. 3.3 shows the relationship between the reference plane and the im- age plane. The camera parameters are estimated by the correspondence between the reference plane coordinates and the image coordinates. Note that three color images must be captured from different positions changing orientations. If the reference plane undergoes pure translation, the camera parameters cannot be esti- mated [64]. Here, the reference plane is onzp = 0and the homography matrixHp is denoted by[ h1 h2 h3 ]. From (3.1), the perspective projection which maps
Figure 3.3: Camera calibration.
the reference plane coordinates onto the image coordinates can be written as
e m=Hp
xp yp 1
, (3.14)
with Hp =A h
r1 r2 t i
.
Consequently, we have h
h1 h2 h3 i
=λA h
r1 r2 t i
, (3.15)
whereλis the constant parameter. The homography matrix has eight degrees of freedom which encapsulates five degrees of freedoms of intrinsic parameters and three degrees of freedoms of extrinsic parameters. Then, the symmetric matrixB can be written as
B=κA−TA, (3.16)
with B=
b11 b12 b13
b12 b22 b23 b13 b23 b33
,
whereκis the constant parameter and (−T) indicates the transpose of an inverse matrix. Thus, the intrinsic parameters are given by
u0 = γv0/α−b13α2/κ , (3.17) v0 = (b12b13−b11b23)/(b11b22−b212), (3.18)
α = p
κ/b11, (3.19)
β =
q
κb11/(b11b22−b212), (3.20)
γ = −b12α2β/κ , (3.21)
κ = b33−[b213+v0(b12b13−b11b23)]/b11. (3.22) After that, the extrinsic parameters are given by
r1 = λA−1h1, (3.23)
r2 = λA−1h2, (3.24)
r3 = r1×r2, (3.25)
t = λA−1h3, (3.26)
with λ= 1/kA−1h1k= 1/kA−1h2k,
where (−1) indicates the inverse of a matrix. Finally, we refine all of parame- ters through maximum likelihood estimation based on Levenberg-Marquardt al- gorithm [65, 66].
3.3.2 Projector Calibration
In the projector calibration stage, projector parameters are estimated by image- to-camera transformation matrix based on the perspective projection and the Eu- clidian transformation of the camera parameters which encapsulate the position and orientation of the reference planes. Fig. 3.4 shows the relationship among the reference plane, the image plane, and the light stripe. Here, the reference plane is onzp = 0and the coupled matrixQis denoted by[ r1 r2 t ]. From (3.1), the perspective projection which maps the reference plane coordinates onto the image coordinates can be written as
Figure 3.4: Projector calibration.
me 'AQ
xp yp 1
. (3.27)
From (3.2), the Euclidean transformation which transforms the reference plane coordinates to the camera coordinates can be written as
Mc=Q
xp yp 1
. (3.28)
Furthermore, the inverse of the coupled matrix is given by
Q−1 = h
r1 r2 t i−1
= 1
(r1×r2)Tt
(r2 ×t)T (t×r1)T (r1×r2)T
= 1
rT3t
(r2×t)T (t×r1)T
rT3
, (3.29)
where (T) indicates the transpose of a matrix. From (3.15), (3.16), and (3.17), the transformation matrix which maps the image coordinates into the camera coordi- nates is given by
Mec =
"
Mc
1
#
=
"
Q bT
#
xp yp 1
'
"
Q bT
#
Q−1A−1me
'
"
I (rT3t)−1rT3
#
A−1me, (3.30)
with I=diag(1,1,1) b= [0,0,1].
The image-to-camera transformation matrix is directly estimated by camera pa- rameters unlike other methods which necessitate recalculations [67, 68, 69]. This matrix has eight degrees of freedom which is similar to the homography matrix in 2D.
For each light stripe, the image coordinates is transformed to the camera co- ordinates, so that the coefficients of the equation of a plane can be computed by the least square method at least three image coordinates. If the image coordinates of the light stripe are obtained from one reference plane, the equation of a plane cannot be computed. This is how all the light stripes are estimated.
3.4 Experimental Results
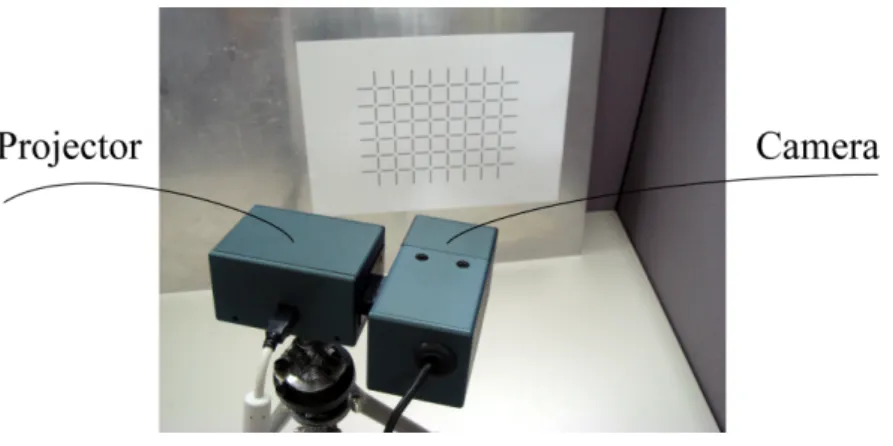
The data is captured by a structured light system, Cartesia 3D Handy Scanner of SPACEVISION. This system captures range data in 0.5 seconds with 8 mm focal length, 640×480 pixels, and 256 light stripes by the space encoding method [53, 54]. Here, two light stripes are not used for measurement. The light stripes based on the gray coded pattern are scanned by a single light stripe and a rotatable mirror.
The reference plane with the checkered pattern includes 48 calibration points with
Color image 1 Color image 2 Color image 3
Stripe image 1 Stripe image 2 Stripe image 3 Figure 3.5: Three sets of color images and stripe images.
Table 3.1: Camera parameters.
A
1061.71 −0.562002 350.08 0 1064.09 286.547
0 0 1
k1 -0.140279
k2 -0.0916363
20 mm horizontal and vertical intervals. It is preferable to assign the reference plane within the measurement range and capture a large number of calibration points in the entire image.
3.4.1 Calibration
Three sets of color images and stripe images are used for calibration as shown in Fig. 3.5. For the color images, one straight line is fitted to two horizontal line segments and the other straight line is fitted to two vertical segments. The calibration point is detected as the intersection of two straight lines. For stripe
(a) Baselines
(b) Projection angles
(c) Tilt angles
Figure 3.6: Projector parameters.
Figure 3.7: Evaluation spheres.
Table 3.2: Measurement accuracy of structured light system.
Sphere number No. 1 No. 2 No. 3 No. 4 No. 5
Measuring points 15,629 15,629 19,405 19,861 19,861 Approach ( i )
[mm2] 0.41 0.38 0.26 0.26 0.31
Approach ( ii )
[mm2] 0.22 0.31 0.19 0.13 0.20
Approach (iii)
[mm2] 0.23 0.32 0.21 0.15 0.21
images, luminance values from 1 to 254 correspond to the light stripe number.
The light stripes are projected to the reference plane vertically.
Table 3.1 shows the camera intrinsic matrix and the coefficients of the radial distortion of the camera parameters. Fig. 3.6 shows the baselines, projection an- gles, and tilt angles of the projector parameters. When the light stripe number increases, the baselines gradually reduce, the projection angles increase, and the tilt angles remains almost constant. The camera and projector parameters enable the system to recover the camera coordinates of a target object.
Approach ( i )
Approach ( ii )
Approach (iii)
Figure 3.8: Measurement results of five spheres.
3.4.2 Evaluation
We evaluated the measurement accuracy using five spheres with 25 mm radius placed in front of the system. Fig. 3.7 is the evaluation spheres. They are num- bered from top left to bottom right. In our evaluation, the system captures range data, and then fit the ideal spheres to them. The measurement accuracy which is defined as the distance between the ideal radiusrˆand the real radiusrj is given by
Es = 1 Ns
Ns
X
j=1
(rj −r)ˆ2, (3.31)
whereNsis the number of measuring points. To show the effectiveness, we eval- uated our approach by comparing with two conventional approaches.
( i ) The pinhole model calibrated by slide stage:The camera is modeled by the 3×4 projection matrix, and the projector is modeled by the 2×4 projection matrix. The camera and projector parameters are estimated using the slide stage.
( ii ) The equation of a plane model calibrated by slide stage: The camera model is based on the pinhole model, and the projector model is based on the equation of a plane model. The camera parameters are obtained by Tsai’s method [70], and the projector parameters are estimated using the reference plane.
(iii) The equation of a plane model calibrated by reference plane:The camera model is based on the pinhole model, and the projector model is based on the equation of a plane model. The camera and projector parameters are estimated using the reference plane.
Fig. 3.8 is the measurement results of five spheres. In the approach ( i ), left two spheres, i.e. No. 1 and No. 4, and the ground are distorted in contrast to the approach ( ii ) and (iii). Table 3.2 shows the measurement accuracy of the struc- tured light system. In the approach ( i ), the measurement accuracy is lower than
![Figure 2.5: Modeling results of CAESAR subjects. Courtesy of Brett Allen [38].](https://thumb-ap.123doks.com/thumbv2/123deta/6071885.2079828/32.892.163.724.207.346/figure-modeling-results-caesar-subjects-courtesy-brett-allen.webp)
![Figure 2.6: Digital Michelangelo project. Courtesy of Marc Levoy [40, 41].](https://thumb-ap.123doks.com/thumbv2/123deta/6071885.2079828/33.892.300.602.189.429/figure-digital-michelangelo-project-courtesy-marc-levoy.webp)
![Figure 2.7: Bayon digital archival project. Courtesy of Katsushi Ikeuchi [44, 45].](https://thumb-ap.123doks.com/thumbv2/123deta/6071885.2079828/34.892.158.736.191.389/figure-bayon-digital-archival-project-courtesy-katsushi-ikeuchi.webp)