Acta med. nagasaki. 9 : 186-199
On the Flash Light Response Activities in the Visual Cortex of Unanesthetized Cats
Noriyoshi HIROTA*
The 2nd Department of Physiology, Nagasaki University School of Medicine, Nagasaki, Japan.
Received for publication, March 5, 1965
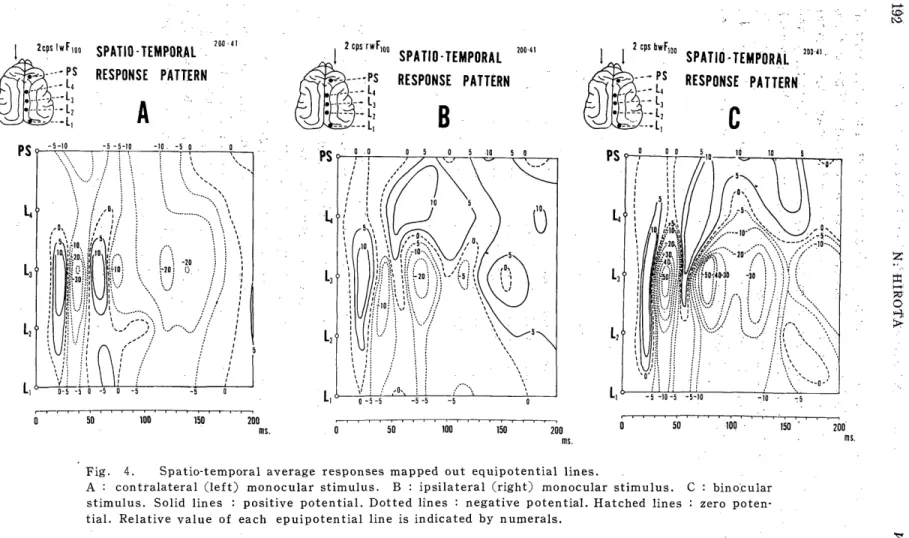
Single and rhythmic flash light average responses in the visual cortex (lateral gyrus) of immobilized cats by administration of Flaxedil were observed in their time- (Fig. 2C & 3), spatio-temporal- (Fig. 4) and fre- quency-patterns (Fig. 5B & C).
Four positive negative diphasic average deflections were capable of tracing from a variety of portions in the lateral gyrus, each of which was able to designate, for convenience sake, P1, N1, P2, N2, P3, N3, P4 and N4 respectively (Fig. 3) . Their average peak latencies were 21.6, 45.0, 63.4, 78.5, 106.9, 117.3, 154.9 and 178.3 msec respectively, so that P1 and N1 responses were the well-known primary responses. The most conspicuous responses were evoked from the mid lateral gyrus, wherein the early components P1, N1 and P2 due to contralateral stimulus were larger than those evoked by ipsilateral one, but N2 was ipsilaterally dominant. Later components of ipsi- and contralateral responses than N2 were not the same each other in their patterns. Though binocular responses were more prominent than both of ipsi- and contralateral monocular ones, occlusive binocular interaction was revealed in the positive components P1, P2 and P3, whereas facilitatory interaction in the negative components N1, N2 and N3. It was verified in the spatio-temporal average response patterns that primary positive Pi response was unable to observe in the anterior lateral gyrus, but the secondary positive P2 response, which was distinctly and ipsilaterally dominant, was suggested to be an irradiation of P2 in the mid lateral gyrus, in addition, that negative components, N1, N2 and N3 were augmented by binocular stimulation irradiating beyond the extent of responses due to the monocular stimuli to both of anterior and posterior
directions.
This research has been made possible through the support and sponsorship (DA-92-557-FEC-37212) of the U. S. Department of Army, Far East Research Office.
*広 田典 祥
1964 CORTICAL FLASH RESPONSES TN UNANESTHETIZED CATS 187 Though, many reports have published on the evoked cerebral potentials of cat elicited by a flash light stimulus, they contributed chiefly to individualization of primary response components with shorter
latencies, whereas few have been elucidated the late responses3, 4, 8, 32) . Recently, it was demonstrated by SATO16,17,18,19, 17,18,19,20,21,22) SATO et al .27,28) MIMURAI3) , OZAKI et al. 14), TERAMOTO30) , KITAJIMA12) that the average response time-patterns, i. e. crosscorrelograms of the stimulation and masspotential of various brain sites, and their frequency-patterns (frequency spectra) have an equivalent or broader physiological signifi- cance to the excitability cycle of the brain site neighbouring the lead electrode(s). Therefore, observations on the average masspotential responses elicited by mono- and binocular flash light stimuli in the posterior sigmoid gyrus and various portions in the lateral gyrus of unanesthetized cat were performed to elucidate the time-, spatio- temporal- and frequency-patterns of the primary and late responses in
relation to binocular interaction.
METHODS
Under ether anesthesia, adult cats weighing 2.5-4 kg were mounted on the Johnson type stereotaxic instrument after a tracheal canula was fixed for artificial respiration, then the scalp was opened minimal necessarily to place the silver ball tipped monopolar electrodes on the dura or pia covering the posterior sigmoid and lateral gyri. Reference silver wire electrode was inserted into neck muscle of the animal in a dim-lit electromagneticaly shielded room. After the scalp was opened, artificial respiration with oxygen to blow away ether was carried out throughout the experiment and Flaxedil was administrated to immobilize the unanesthetized animal in a rate of 15 mg/kg per an hour through a continuous injector (KN, Natsume Seisakusho), so that fluctuations in the animal conditions were capable of avoiding.
Single or repetitive flash light stimulations were delivered by the photic stimulator (PS-101, San 'ei-Sokki Co.). The flash emitted from the strobo flash valve (FT-100, Mazda) was of about 6000°K daylight, 1 Watt per second energy and about 100psec duration. In front of the flash valve, a frosted glass plate, a shutter with a round iris and a cotton white curtain were placed, through which the beam of the flash light was diffused. The both pupils of the cat were dilated by atropine and placed at the distance of 62 cm from the surface of the strobo flash valve. One of the eyes was covered carefully by a piece of dick and black woolen cloth when a monocular stimulation was delivered.
The intensity of the flash stimulus was delivered through an iris
of 50, 100 or 150 mm diameters. Relative intensity of them in logarithmic
188 _!M; HIROTA Vol. ,9.
Fig. 1. Block diagram of the brain masspotential recording and their bio-infor- mation processings.
scale were 2.1, 2.6 and 2.8 db respectively if the intensity through the iris of 5 mm diameter was taken as 0 db. The bio-information process- ings in our laboratory for obtaining the average response 'time-patterns and their frequency-patterns are illustrated in Fig. 1. Masspotentials (EEGs and evoked potentials) and stimulation signal were recorded on magnetic tapes through 8-channel polygraph (RM-150, Nihon-Kohden Co.) and 8-channel data recorder (SPRA-48, Shiroyamadenshi Co. ) monitoring by ink records through the polygraph. The average response time-patterns were obtained by a simplified method (Sato et al. 196123',
196224') from ink records, through the Pulse Signal Multipurpose Correlator (UCA-26, Sony Co. )26) or the Digital Computer For Data Processing (ATAC-401, Nihon Kohden Co.) from magnetic tape records.
The frequency spectra of these average response . time-patterns were
recorded by the Instant Short Range Spectrum Analyser (ESA-2, Sony
Co)33'. Not only the average responses in a variety of portions of the
posterior sigmoid and lateral gyri respectively, but spatio-temporal
response patterns15) were obtained to map equipotential lines on such a
plane that the post stimulation time and the above various portions
were taken as abscissa and ordinate respectively were also obtained,
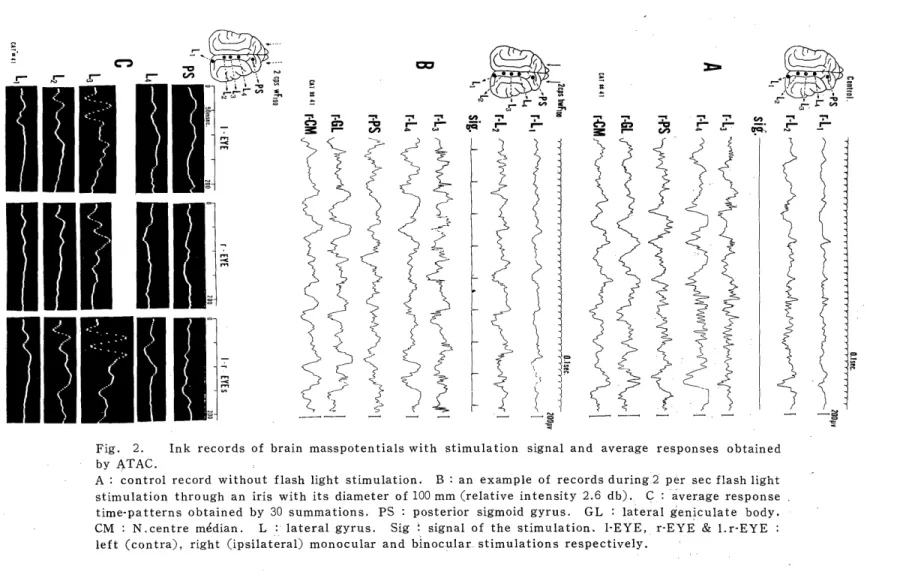
Fig. 2. Ink records of brain masspotentials with stimulation signal and average responses obtained by ATAC.
A : control record without flash light stimulation. B : an example of records during-2 per sec flashlight stimulation through an iris with its diameter of 100 mm (relative intensity 2.6 db). C : average response time-patterns obtained by 30 summations. PS : posterior sigmoid gyrus. GL : lateral geniculate body.
CM : N.centre median. L : lateral gyrus. Sig signal of the stimulation. I-EYE, r-EYE & l.r-EYE :
left (contra), right (ipsilateral) monocular and binocular. stimulations respectively.
190 N. HIROTA Vol. 9.
RESULTS
1. Temporal patterns of the average responses in the posterior sigmoid and lateral gyri.
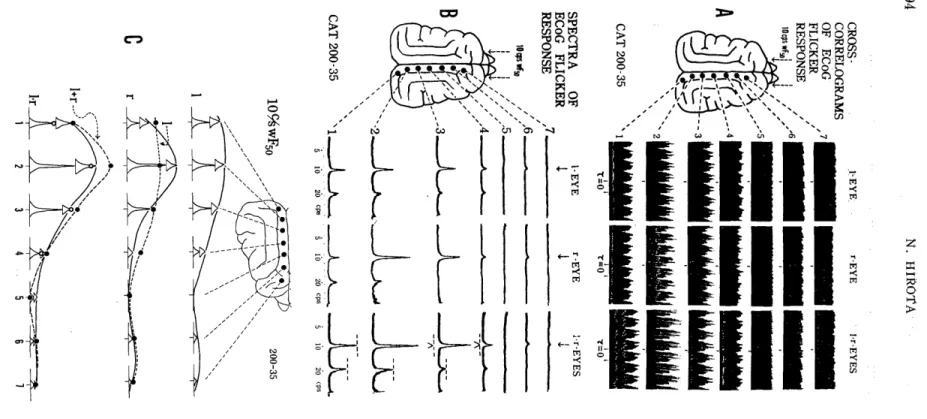
By delivering the flash light stimulus at an interval of about 500, 350 or 100 msec, not only the well-known primary positive negative diphasic response with lesser peak latency than 50 msec in average but the late responses with longer peak latencies were capable of obtaining by applying ATAC, UCA and/or the simplified average response analysis23, 24) Two examples traced by ATAC and UCA were illustrated in Fig. 2 C and Fig. 5 A respectively. In the former four positive (downward) and negative (upward) deflections were able to recognize most distinctly at the mid lateral gyrus (Lead L3), around which the primary visual area will be located. In the latter, three or two positive and negative ones were observed distinctly in the visual
Fig. 3. Combined records of the average response time-patterns.
A : responses elicited by contralateral (left) (hatched lines connecting white
circles) and ipsilateral (right) monocular (solid lines connecting black circles) flash
light stimulus delivered at the time origin (arrows pointing upward). B : response
due to the binocular stimulus (solid lines) and algebraic summations of ipsi- and
Gontralateral responses (hatched lines connecting crosses "+").
1064 CORTICAL FLASH RESPONSES IN t7NANE5THETIZED CATS 191 cortex (Fig. 5 A, Lead 2, 3, 1 and 4), since the rhythmic flash stimuli were delivered in this instance at the interval of 100 msec. The portion of maximum response was located more posterior than the former example. This difference may be caused by the higher frequency and weaker strength of the stimulation. The first, second, third and fourth positive deflections were designated, for convenience sake, P1, P2, P3 and P4 respectively, and those of the negative ones nominated for N1, N2, N3 and N4 respectively (see Fig. 3). Their average peak latencies in five experiments are indicated in Table 1.
Table 1.
Peak latency of average responses in the visual cortex
No. Pi
40.0 60.0 123.0
--- --- - --- --- -- --- --- - --- - --- --- -- --- - ---
Average
CatN1 P2 N2 P3 N3 P4 N4
msec msec msec msec msec msec msec msec
#
41 24.6 41.4 63.1 81.1 100.2 117.3 145.8 178.3
#
35 18.7 51.1 64.0 77.8 94.0 - - -
#
37 29.0 54.4 66.6 80,0 110.5 - - -
#
58 20.0 38.0 75.0 - -
#
58 23.0- 163.0 -
21.6 45.0 63.4 78.5 106.9 117.3 154.9 178.3