エンピリカルソフトウェア工学研究会
国際会議(IWSE-Mensura2007)
参加報告
2007-12-18
神谷 芳樹
(IPA/SEC, NAIST)
Information-technology Promotion Agency, Japan
Software Engineering Center Empirical Approach to Software Engineering 1
Information-technology Promotion Agency, Japan Software Engineering Center Empirical Approach to Software Engineering
発表概要
An Empirical Study of
Process Management and Metrics based on
In-process Measurements of
a Standardized Requirements Definition Phase
標準化された要求定義工程での進行中のプロジェクト計測例
Yoshiki Mitani, Tomoko Matsumura,
Mike Barker,Seishiro Tsuruho,
Katsuro Inoue, Ken-Ichi Matsumoto
Information Technology Promotion Agency, Japan(IPA) Nara Institute of Science and Technology(NAIST)
Kochi University of Technology
EA Guideline Structure
Basic
Architecture Reference Model EA Products
Business Architecture
Business Reference Model Performance Reference Model
Business Description Document Diamond Mandala Matrix (DMM) Data Flow Diagram (DFD)
Work Flow Architecture (WFA) Data
Architecture Data Reference Model
UML Class Diagram
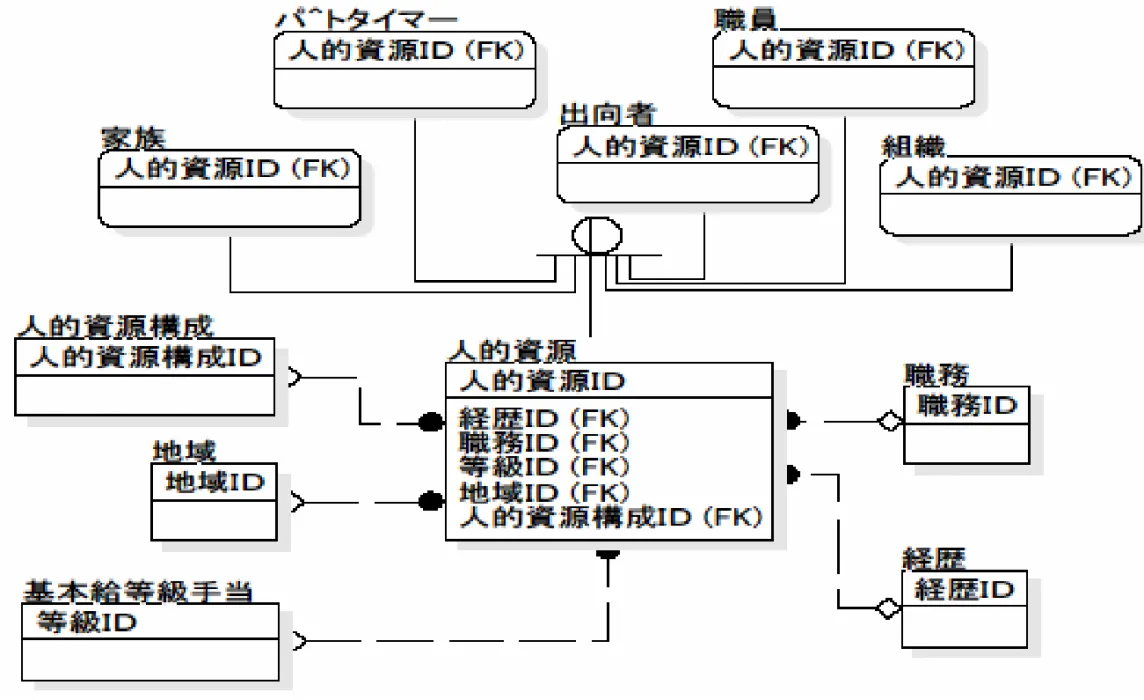
Entity Relationship Diagram (ERD) Data Definition Table
Application Architecture
Service Component Reference Model
Information System Reference Diagram Information System Function Structure Table
Technology Architecture
Technology Reference Model
Network Structure Diagram Software Structure Diagram Hardware Structure Diagram
Project Process Architecture AsIs Process, Optimize Process, ToBe Process
Project Management Architecture Earned Value Management (EVM) method
Fig.1-1 Diamond Mandala Matrix (DMM)
Fig.1-2 Data Flow Diagram (DFD)
Fig.1-3 Work Flow Architecture (WFA)
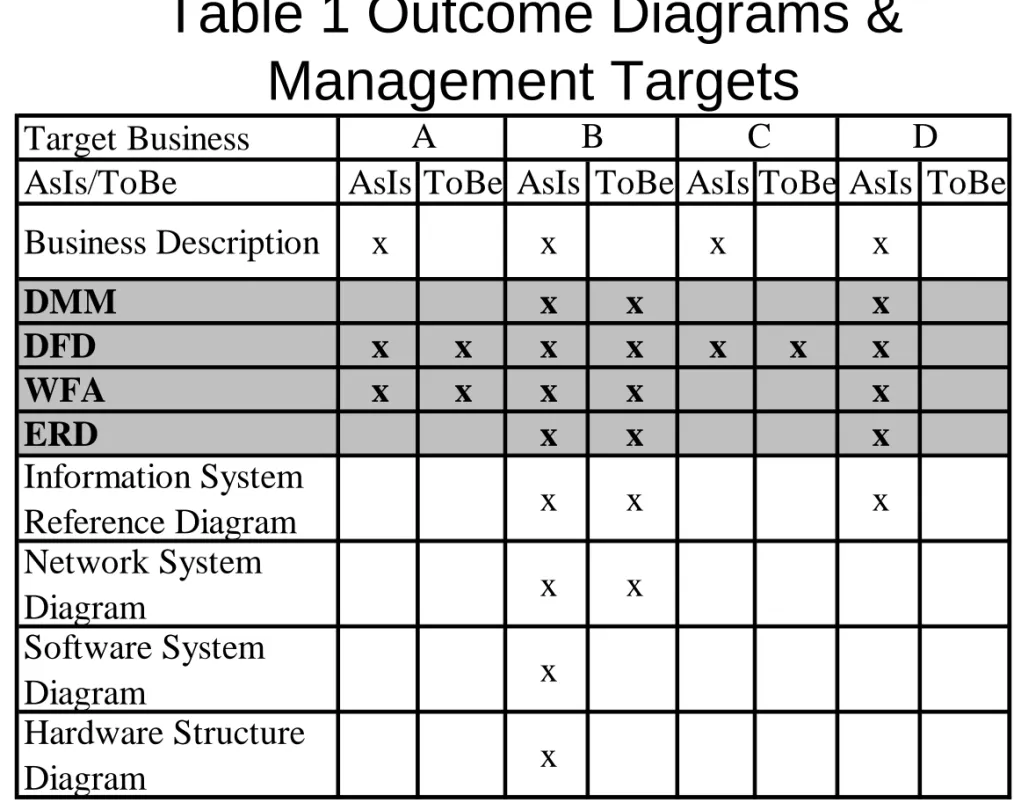
Table 1 Outcome Diagrams &
Management Targets
Target Business
AsIs/ToBe AsIs ToBe AsIs ToBe AsIs ToBe AsIs ToBe
Business Description x x x x DMM x x x DFD x x x x x x x WFA x x x x x ERD x x x Information System Reference Diagram x x x Network System Diagram x x Software System Diagram x Hardware Structure Diagram x A B C D
34 kinds of documents including 30 diagrams Measurement targets are 22 key diagrams
Schedule of Target Project
8 9 10 11 12 1 2 3 Extract Issue AsIs Description Build System Renewal Policy Build System Review Plan Build Optimization Plan ToBe Description Work 2006 2007Future
Target: AsIs and ToBe phase
0 5000 10000 15000 20000 25000 30000 35000 9 /29 10/6 10 /13 10 /20 10 /27 11/3 11 /10 11 /17 11 /24 12/1 12/8 12 /15 12 /22 12 /29 1/5 1/12 1/19 1/26 2/2 2/9 2/16 2/23 3/2 3/9 3/16 3/23 ToBe-Busi.C ToBe-Busi.A ToBe-Busi.B AsIs-Busi.D AsIs-Busi.C AsIs=Busi.B AsIs-Busi.A Total over 34,000 elements 24 weeks 730 sheets
Fig.2 Diagram Elements Stack of all Business
accumulated data for all businesses.
not only the total amount project proceeding process for each business but also description documents amount,
0 2000 4000 6000 8000 10000 9/ 29 10/ 6 10/ 13 10/ 20 10/ 27 11/ 3 11/ 10 11/ 17 11/ 24 12/ 1 12/ 8 12/ 15 12/ 22 element connector
Fig.3 Diagram Elements of Business B (AsIs)
11
12
Fig.4 File Number Transition of Business B (AsIs) 0 10 20 30 9/ 29 10/ 6 10/ 1 3 10/ 2 0 10/ 2 7 11/ 3 11/ 1 0 11/ 1 7 11/ 2 4 12/ 1 12/ 8 12/ 1 5 12/ 2 2
Add Modify Eliminate Cum.Total
AsIs phase was smoothly progressed to stable
and ToBe phase was
rather rapidly progressed. 0
10 20 30
1/5 1/12 1/19 1/26 2/2 2/9 2/16 2/23 3/2 3/9 3/16
Add Modify Eliminate Cum. Total
Fig.5 File Number Transition of Business B (ToBe)
Fig.6 Diagram Modification
in one file Example (8 sheets)
0 2 4 6 8 10 12 14 16 18 20 22 11/10 11/17 11/24 12/1 12/8 12/15
eliminate add modify
6 weeks
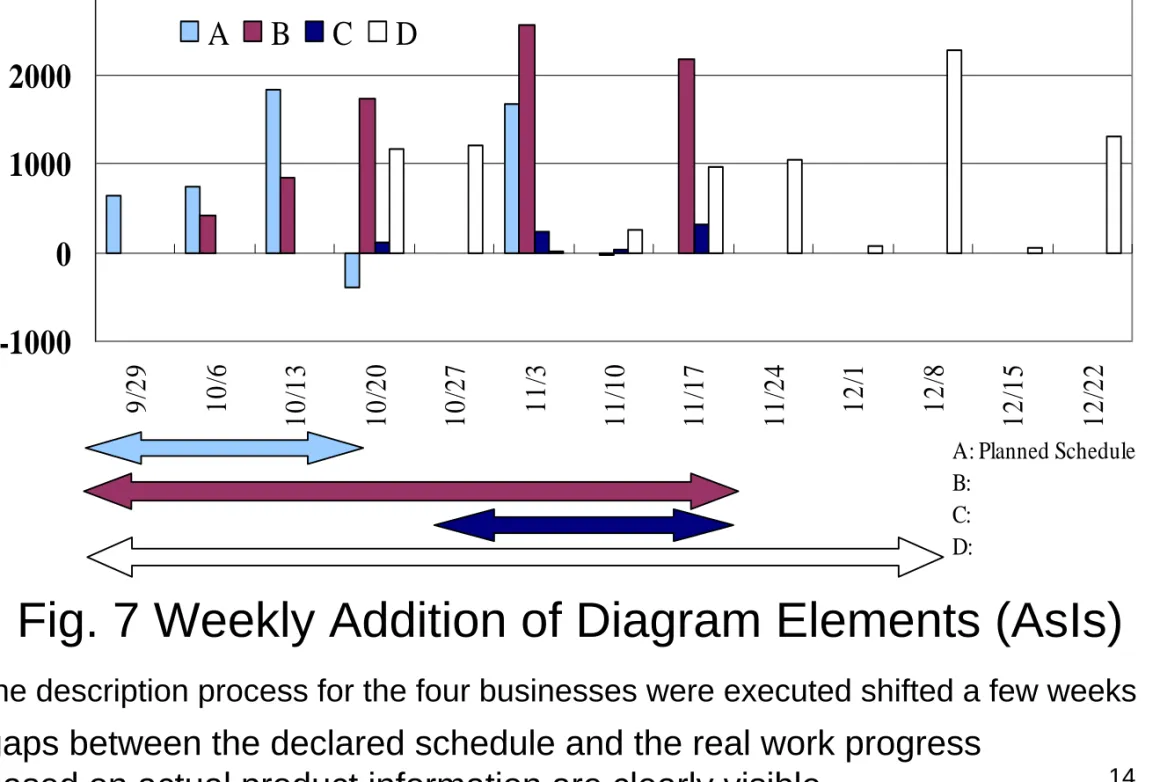
-1000 0 1000 2000 3000 9/ 29 10/ 6 10/ 1 3 10/ 2 0 10/ 2 7 11/ 3 11/ 1 0 11/ 1 7 11/ 2 4 12/ 1 12/ 8 12/ 1 5 12/ 2 2 A B C D A: Planned Schedule B: C: D:
Fig. 7 Weekly Addition of Diagram Elements (AsIs)
the description process for the four businesses were executed shifted a few weeks
gaps between the declared schedule and the real work progress
24 weeks -1000 0 1000 2000 3000 4000 5000 9/2 9 10/ 6 1 0/1 3 1 0/2 0 1 0/2 7 11/ 3 1 1/1 0 1 1/1 7 1 1/2 4 12/ 1 12/ 8 1 2/1 5 1 2/2 2 1 2/2 9 1/ 5 1/1 2 1/1 9 1/2 6 2/ 2 2/ 9 2/1 6 2/2 3 3/ 2 3/ 9 3/1 6 3/2 3 AsIs ToBe
Fig.8 Total Weekly Addition of Diagram
Elements (AsIs and ToBe)
Evaluation and Study of the Measurement Results
Comparison with official progress report
Fig9. EVM Report
Planned Value Earned Value Active Value Planned Value Earned Value Active Value Declaration level.Only consulting company side data.
The consumed human resources, but it is not clear about the situation of the outcome amounts.
during a long period progress was delayed but when the deadline was coming it progressed rapidly and finished on time. 16
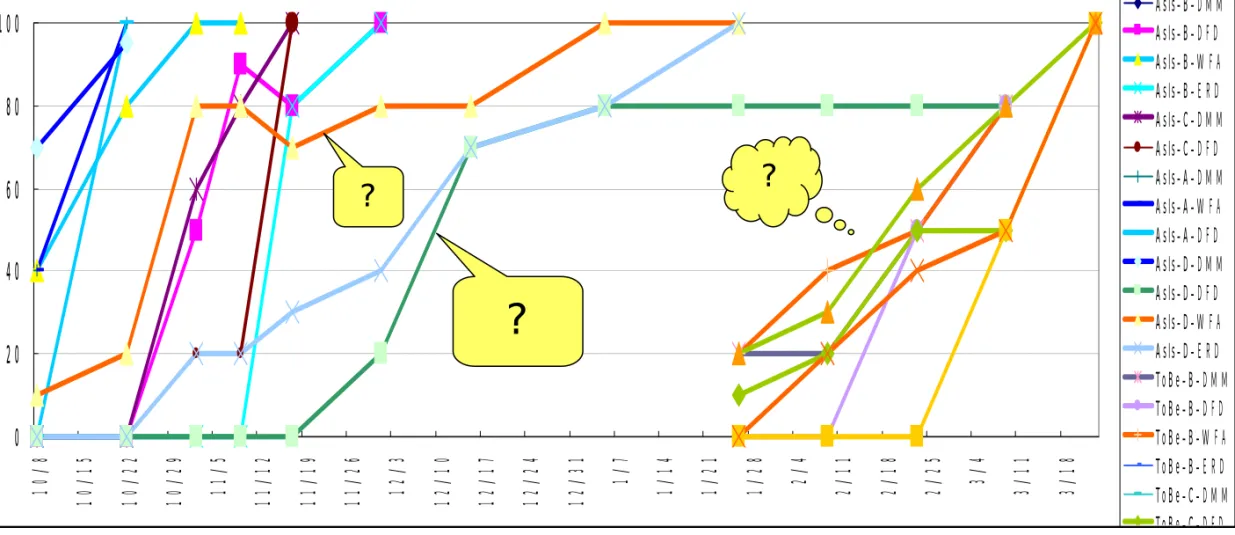
0 20 40 60 80 100 1 0/8 10 /15 10 /22 10 /29 1 1/5 11 /12 11 /19 11 /26 1 2/3 12 /10 12 /17 12 /24 12 /31 1/7 1 /14 1 /21 1 /28 2/4 2 /11 2 /18 2 /25 3/4 3 /11 3 /18 AsIs-B-DMM AsIs-B-DFD AsIs-B-WFA AsIs-B-ERD AsIs-C-DMM AsIs-C-DFD AsIs-A-DMM AsIs-A-WFA AsIs-A-DFD AsIs-D-DMM AsIs-D-DFD AsIs-D-WFA AsIs-D-ERD ToBe-B-DMM ToBe-B-DFD ToBe-B-WFA ToBe-B-ERD ToBe-C-DMM ToBe-C-DFD
?
? ?Fig. 10 Declaration Level Progress Report (AsIs & ToBe) (%)
From WBS report granularity is very rough.There is no information about the amount of outcome produced. based on declared progress estimation criteria.
0 20 40 60
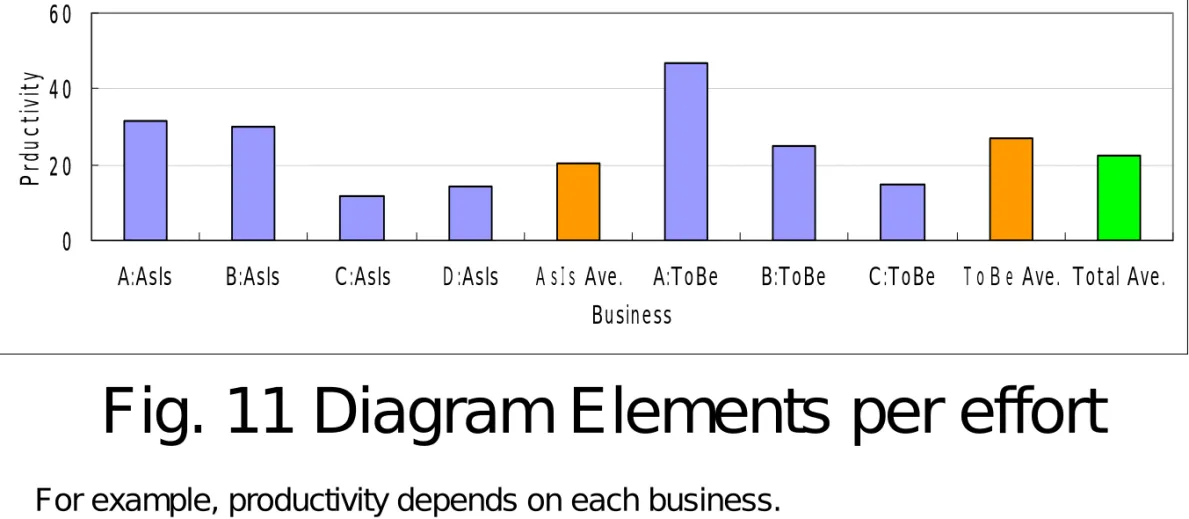
A:AsIs B:AsIs C:AsIs D:AsIs AsIs Ave. A:ToBe B:ToBe C:ToBe ToBe Ave. Total Ave. Business Prd u c ti vi ty
Study for new software metrics possibility
Fig. 11 Diagram Elements per effort
18
For example, productivity depends on each business.
A and C had fewer products but their productivity shows different trends.
A, it was easy to understand business process, so it showed high productivity but C, the business process was highly complicated, so low productivity.
This trend is not same as the general trend in the development phase measured by SLOC and Function Point (FP).
Possibility as a software benchmark data element
From the viewpoint of software metrics
the number of diagram elements in the requirements definition phase of the EA method process is strongly analogous to SLOC
0.4 0.6 0.8 1 1.2 1.4 1.6 1.8 2
Bu sin e ss A Bu sin e ss B Bu sin e ss C Bu sin e ss D To t al
Business Co s t/E le m e nt (R e lat iv e) AsIs ToBe AsIs>ToBe 1=average 19
Fig.12 Cost per Diagram Element
(relative value)
IWSM-Mensura2007
International Workshop on Software Measurement
International Conference on Software Process and Product Measurement
• 開催場所・日程:パルマ デ マロルカ(スペイン)、11月5日- 8日
(会場:バレアレス諸島大学)
– 論文発表、1セッションの司会、会議と2つのWorkshopに参加。• 欧州のソフトウェア計測に関する研究グループを中心に昨年開
設された国際会議。ワークショップIWSM と合体。IWSMのほうは
第16回。
• 3日間で30件の論文発表、17カ国からの参加
。
• 発表の約半分はPhDコースの学生によるもの。
– 印象:国際社会で生きてゆく研究者、指導者の実績集積の場。
• 次回開催は、ミュンヘン 。
20眼に留まった研究
(研究の枠組み型)
• Best Paper Award
– ドイツUlm大学のダイムラークライスラーとの産学連携プ
ロジェクトの評価に関する発表。
– 10年間、20個の実験プロジェクトの成果の報告。
Experiences on Using Software Experiments in the
Validation of Industrial Research Questions
• IESEから
– 社会科学者
– An Infrastructure for Empirically-based Software
Engineering Technology Selection
基調講演
ドイツ、マグデブルグ大学:Reiner Dumke教授
• これまでのソフトウェア計測に関する沢山の書籍の
分類紹介
• 今後書かれるべき課題の整理
• 教授の近著(Software Measurement)の紹介
– ソフトウェア計測の研究課題の全体を俯瞰するのに素晴
しい
• 計測のためのインフラストラクチャーとして、標準化、
法やルール、原則などの枠組みつくりから、サービ
ス提供、コミュニティつくり、先取り環境へという教授
の持論が示された。
– 今後の方向性に大変参考になった
http://ivs.cs.uni-magdeburg.de/~dumke/ 22 http://ivs.cs.uni-magdeburg.de/~dumke/V1DumkeMensura07.pdf参加したWorkshop
• Mike Berry :オーストラリア
– Improving Measurement and Analysis through
Assessment
• Aline Ablan教授:ケベック大学、モントリオール校
– A Software Measurement Knowledge Area For the
Guide to the Software Engineering Body of
Knowledge SWEBOK
– Ablan教授はSWEBOKのExecutive Editor
– Chapter 12 Software Measurementを追記中。
• 追記と新しいViewの提示
http://mensura2007.uib.es/documents/SwMeasBok_Ch12_vMay192007.pdf 24
所感:国際社会で、情報の多い有意義な体験となった。ちょっとした留学気分。