An Analysis of South Korea’s Industries Exporting to Japan*
Joong-Ho Kook† Abstract
South Korea has chronically recorded huge trade deficit with Japan. The excessively skewed trade towards a particular country can make bilateral trade undesirable and lead to inefficiencies because economic activity options of the country that is deeply dependent on another country are limited so much. This paper analyzes South Korea’s industries exporting to Japan, reviewing bilateral trade relations between the two countries. The four categories can be obtained in Korea’s industries exporting to Japan based on the classification of HS (Harmonized System): vigorous industries, stable industries, unstable industries, and declining industries. The development of the industries such as electrical machinery and equipment, and their parts etc.
is recommended for Korea to reduce the trade gaps at the viewpoint that the industries can have strong potentials in Japanese market.
Keywords: trade imbalance, industry classification, Japan, South Korea
1. Introduction
Though South Korea’s outward-oriented trade tendency has been more vigorous compared to the Japanese one, in particular, after the financial crisis in late 1997, its trade deficits with Japan have ever increased. What is the reason? What is the problem of persistent trade deficits between the two countries? How can South Korea adjust trade imbalances? Those questions are main motivation of the paper.
Chou and Shih (1991) analyze the economic impacts of the trade flows between Japan and four Asian economies (or Hong Kong, Korea, Singapore, and Taiwan), and point out their chronic trade deficit with Japan during 1970s and 1980s due to the export-oriented industrialization depending on imports from Japan. Rajan (1996) reveals that Singapore’s trade with Japan has become more intensive over the period 1976-1992. Furthermore, Simandjuntak (1991) asserts that many Asian economies have benefitted from the economic growth of Japan through trade of merchandise and services etc. We focus the analysis of South Korea’s industries exporting to Japan reviewing bilateral trade relations between the two countries.
With regard to policy goals, Research Department of BOK(2009) emphasizes the elimination of South Korea’s import-induced industrial structure and appropriate medium-to-long term measures rather than focusing on short-term outcomes to reduce its trade deficit with Japan.
According to the research, some measures that are important for improvement over the medium to long term are strengthening of technology development such as core (source) technology, development of leading enterprises through an increase in size, and development of human resources, etc. Though the research states that there should be active efforts to increase exports to Japan, it does not discuss what kinds of industries have comparative advantage in Japanese market.
Yoon and Ahn (2008) suggest that South Korea should promote a stable increase in exports through improving the quality of commodities and transforming Korean economy into an energy-saving industrial structure. KOTRA (2010) takes some examples of vigorous industries in the market of Japan. After discussing some of the special characteristics of the Japanese
market, KOTRA (2010) introduces the success stories of several selected companies such as a plastics manufacturer, and a company which produces charging systems for electric vehicles, etc. Recently, Oh, et al. (2011) carries out the interview-based research which introduces actual examples of successes and failures in entering the Japanese market. KOTRA (2010) and Oh, et al. (2011), however, just report some characteristics of South Korea’s exporting industries to Japan. We analytically try to provide some characteristics of South Korea’s exporting industries to Japan, based on three concrete indices of: the average growth rate, the variability and the share of each industry out of Korea’s total exports to Japan.
The fact that South Korea is more dependent on the imports from Japan than on the exports to Japan implies that South Korea’s trade deficit with Japan is quite large. In other words, the fact that Japanese exports to South Korea is far greater than its imports from South Korea means that Japan’s trade surplus with South Korea reaches huge amounts. Kim (2009) points out Korea’s persistent bilateral trade deficit with Japan based on the empirical analysis1; he argues that the economic growth accompanying technological advances and import substitution of the core parts in major export products of Korea would reduce persistent trade deficits against Japan.
Concerning the bilateral trade between Japan and South Korea, Mizuno (2010) describes the properties of the trade deficit with Japan referring to the import-induced problem of the industrial structure of South Korea. Mizuno (2010) claims that it cannot be resolved if the Korea’s government and companies do not make an effort over the long term because the problem of Korea’s trade deficit with Japan is structural. Pan (2009) deals with the problem of trade deficits between China and South Korea. According to Pan (2009), though globalization since the early 1990s has had a positive impact on trade relations between China and Korea, China’s increasing trade deficits with Korea has become an urgent problem to be solved. As a same token, Korea’s higher dependence on imports from Japan than exports to Japan, thereby causing the huge size of the trade deficit to happen.
This paper differs from the existing studies that focus on macroeconomic viewpoints of trade such as Pan (2009), Kim (2009), and Rajan (1996), among others. The calculations based on three indices of the growth rate, the variability, and the share of each industry out of South Korea’s exports to Japan are utilized to show their characteristics. We also discuss some measures for trade balances between Japan and South Korea to reduce South Korea’s trade deficit with Japan. If the country whose trade is excessively skewed towards a particular region or country has not a strong political and military power like USA, a long-term huge trade deficit can make bilateral trade ineffective. It is because the long-term huge trade deficit can constrain production and consumption options. In other words, when a country has a chronic heavy dependence on another region or country, its economic activity options can be limited.
In the side of bilateral trade between Japan and South Korea, South Korea’s ‘star’ industries (or products) with high growth rate as well as high market share did not appear in Japanese market. We propose to some measures to expand South Korea’s exports to Japan, which may lead to a reduction in their trade imbalances. Regarding how to raise the status of exports to Japan, South Korea is recommended to boost the exports through the development of industries such as electrical machinery and equipment, and their parts etc. Those industries may have strong potentials for exports to Japan.
At Section 2 we investigate bilateral trade relations between Japan and South Korea giving the imports/exports data of the two countries. Section 3 discusses a methodology to evaluate South Korea’s industries exporting to Japan. Section 4 presents the classification results of those
industries on the basis of the methodology of Section 3. Section 5 recommends South Korea’s some potential industries for expanding exports to Japan based on the analysis of Section 4. Final Section 6 is concluding remarks.
2. Trade features between Japan and South Korea
2.1. Japan’s trade dependence on South Korea
What will become of Japan’s trade dependence on South Korea? We utilize some indicators related to the imports of Japan from South Korea: the trend of percentage of its imports from South Korea among Japan’s total imports (=[Japan’s imports from South Korea / total imports in Japan]) and the trend of percentage of its exports to South Korea among Japan’s total exports (=[Japan’s exports to South Korea / total exports in Japan]). Figure 1 shows the trend of Japan’s exports to South Korea and its import from South Korea with the values of percentage among total exports and imports, respectively, from 1991 up to 2013.
Figure 1 Japan’s exports to South Korea and its imports from South Korea
Source: Ministry of Finance in Japan. (2014). Trade Statistics of Japan [online; citied May 2014.] Available from http://www.customs.go.jp/toukei/sankou/howto/krei.htm.
Figure 1 compares Japanese exports to South Korea as a percentage of its total exports (=[Japan’s exports to South Korea / total exports in Japan]) with Japanese imports from South Korea as a percentage of its total imports (=[Japan’s imports from South Korea / total imports in Japan]). As shown at Figure 1, the former has been greater than the latter for the whole period in question, with the exception of the year 1998 when South Korea got the bailouts from the International Monetary Fund as of financial crisis. In 1992, while the percentage of Japanese imports from South Korea is 4.96%, the percentage of exports to South Korea is 5.24%, so
that percentage of imports from South Korea is just 0.28 percentage points lower than the percentage of exports to South Korea. Percentage gap between Japan’s exports to South Korea and its imports from South Korea has recently been widened. In 2013, for instance, while the percentage of Japan’s exports to South Korea is 7.90%, the proportion of imports from South Korea is 4.30%, so that the percentage of exports to South Korea comes to 3.60 percentage points higher than the percentage of imports from South Korea. These results illustrate that Japanese dependence on imports from South Korea has not changed much, while its dependence on exports to South Korea has been on the rise.
As we see in the next subsection, Japan’s trade dependence on South Korea is greatly different from South Korea’s trade dependence on Japan. As we described above, the percentage of imports form South Korea in Japan’s total imports has not changed much, while there has been a lot increase in Japan’s dependence on exports to South Korea recently. In the case of South Korea’ dependence on trade with Japan (see Figure 2), however, the percentage of South Korea’s imports from Japan and its exports to Japan has been gradually reduced, still remaining huge trade deficits to South Korea.
The Japanese imports from South Korea as a percentage of total Japanese imports was 4.96% in 1992 and 4.30% in 2013, showing little change (or a slight downward change) after the burst of bubble economy in early 1990s. In contrast, since early 1990s the Japan’s exports to South Korea as a percentage of Japan’s total exports has increased 2.66 percentage points to 7.90% in 2013 from 5.24% in 1992, meaning that Japan’s dependency on exports to South Korea has increased so much.
2.2. South Korea’s trade balance and its dependence on Japan
South Korea heavily depends on Japan in the trade, especially in the imports from Japan.
The features of bilateral trade reliance between Japan and South Korea each other have gradually changed over the last 20 years. Figure 2 draws both the imports of South Korea from Japan and the exports of South Korea to Japan as a percentage of each total amount for the period from 1991 to 2013.
We can find out two main features in South Korea’s trade with Japan: (a) the proportion of imports from Japan as a percentage of total Korean imports is larger than that of exports to Japan as a percentage of total Korean exports, which means that South Korea’s dependence on imports from Japan is a lot greater than its exports to Japan; and (b) its dependence on Japan has been gradually reduced in both exports and imports.
Firstly, let us compare the imports of South Korea from Japan as a percentage of its total imports (= [South Korea’s imports from Japan / total imports in South Korea]) with the exports of South Korea to Japan as a percentage of its total exports (= [South Korea’s exports to Japan /total exports in South Korea]). During the whole of the period of over last two decades, the former exceeds the latter. As shown in Figure 2, in 1991, the percentage of South Korea’s imports from Japan is 25.9%, while the percentage of its exports to Japan is 17.2%, showing that the degree of dependence on the imports from Japan is 8.7 percentage points higher than the degree of dependence on the exports to Japan. In 2013, South Korea’s dependence on imports from Japan is 11.6%, and the percentage of exports to Japan is 6.2%, meaning that there is also a 5.4 percentage point difference. Dependence on imports from Japan being higher than the dependence on exports to Japan is caused by the industrial structure of South Korea that heavily
depends on Japan. As pointed out by Kim and Noh (2008) as well as Yoon and Ahn(2008), a characteristic of Korean trade is the expansion of finished products exporting them to the world market through the importation of materials and parts from Japan.
Next, after the bubble burst in Japan in early 1990s South Korea’s dependence on trade with Japan has been reduced for both imports and exports. Figure 2 signifies that the place of Japan as a trading partner of South Korea has gradually dropped. The imports from Japan as a percentage of total imports of South Korea gradually declined 14.3 percentage points from 25.9% in 1991 to 11.6 % in 2013. In the same period the exports to Japan as a percentage of total exports of South Korea also went down 11.0 percentage points from 17.2% in 1991 to 6.2% in 2013. These features show that South Korea’s dependence on trade with Japan has lowered so much. Figure 2 confirms that both the ratios of South Korea’s imports from Japan and those of its exports to Japan have gradually decreased. In other words, for South Korea’s trade, trade volumes with other nations other than Japan have become relatively larger.
2.3 South Korea’s trade balance and trade deficit wiht Japan
Let us discuss South Korea’s total trade balance and trade deficit with Japan after 1991 in some more detail. South Korean government changed its trade policy into export-oriented policy after the financial crisis in late 1997. According to the trade statistics of the Korea International Trade Association, or KITA, South Korea’s trade deficit amounted to US$20.6 billion in 1996. To our surprise, South Korea accomplished trade surplus at US$39.0 billion in 1998. South Korea’s trade deficit with Japan, however, increased after the financial crisis in 1997 because the import
Figure 2: South Korea’s exports to Japan and its imports from Japan
Source: KITA (Korea International Trade Association). (2014) Trade statistics of Korea. KITA, Seoul [online; citied May 2014.]
Available from http://stat.kita.net/
from Japan has played an important role to raise the export to the other countries. South Korea’s import-dependent exports to Japan can be a direct cause of the trade deficit with Japan. Kim and Noh (2008) demonstrate this on the basis of the high correlation between South Korean exports and the trade deficit with Japan. Figure 3 shows South Korea’s total trade balance and its trade deficit with Japan from 1991 until 2013.
Figure 3 South Korea’s total trade balance and trade deficit with Japan
Source: KITA (Korea International Trade Association). (2014) Trade statistics of Korea. KITA, Seoul [online; citied May 2014.]
Available from http://stat.kita.net/
We pointed out that the ratio of South Korea’s trade (i.e., export and import) with Japan relative to its total exports and imports has fallen, which means that Japan’s importance in South Korea as its trading partner has declined. As depicted in Figure 3, South Korea’s trade balance drastically changed. Korea has achieved huge amounts of trade surplus after the economic crisis in 1997 except the year 2008 influenced by financial crisis originated from USA. For instance, South Korea’s trade surplus accounts for US$440 billion in 2013. South Korea’s trade deficit with Japan, however, increased 2.9-fold, from US$8.8 billion in 1991 to US$25.4 billion in 2013.
As a result, South Korean government has required Japan to reduce the deficit. Concerning the bilateral trade of the two countries, Mizuno (2010) refers to a structural problem that should be resolved over the long term based on the concerted efforts by South Korean companies. Yoon and Ahn (2008) also discuss the issue related to the trade deficit between Japan and South Korea from an industrial structure perspective.
South Korea’s effective method to reduce the trade deficit with Japan is to increase its exports to Japan, which is the theme of next sections. South Korea has few exporting industries with high growth rate and large market share. We will investigate various types of South Korean industries exporting to Japan at Section 4 by utilizing a method based on the indicators of market
share, growth rate, and degree of stability of the industries exporting to Japan.
3. Methodology and classification
We calculate three indices to evaluate of South Korea’s industries exporting to Japan: the growth rate and the variability (or stability) of each industry and the percentage share of each industry out of Korea’s total exports to Japan. With respect to the indices of growth rate and variability, we have to devise those indices in an appropriate manner. Kook (2001), Gentry and Ladd (1994), and White (1983) estimate a following simple equation for utilizing indicators of growth rate and stability to evaluate tax system.2 We apply their methods to access South Korea’s industries exporting to Japan.
logTi=a+bti+ei (1)
In equation (1), Ti is the export value of each industry i to Japan, ti is the target period for the last two decades, 1991 to 2010, ei is an error term, and a, b are parameters. When we estimate the equation (1), the parameter b represents the average growth rate of each exporting industry, because by differentiating equation (1) with respect to ti, we can obtain the result that b=(dTi/Ti)/
dti. The coefficient of ti, or b, multiplied by 100 becomes the percentage growth rate of industry i exporting to Japan. Rajan (1996) also makes use of similar indicator to estimate Singapore’s trade intensity with respect to Japan and the United States.
While the growth rate of industry i measures how much it grows in average during a given period, the index of variability indicates a degree of variation in exports of the industry i. We can make use of the adjusted R2 in the estimation of the equation (1) as an indicator of the variability of industry i. Since an adjusted R2 denotes the fitness of the regression line, the higher the value of R2 gets, the greater the stability is or the lower the variability is. We can apply a method of the estimation of equation (1) to the calculation of the values of growth rate and variability over around the last 20 years, and the share of each industry out of Korea’s total exports to Japan in 20103.
In the choice of South Korea’s industries exporting to Japan, we will use the HSK2 classification. HS (Harmonized System) refers to the Harmonized Commodity Description and Coding System which is the new international standard of products classification. HSK refers to the South Korea’s classification of ten digits, where four digits (or units) from the South Korea Customs Service are added to universal six digits. The digits 1 and 2 of the HS categorize all commodities by material (type of material) and by function. Thus, HSK2 classification indicates the classification of industries by material and by function in Korea. For the analysis, we take industry unit HSK2 exporting to Japan among detailed classification of industries.
The initial HSK2 classification of industries exporting to Japan includes 96 unit industries, which are too many and complicated to select the target industries for the analysis. For simplicity, we pick up the industries with more than 0.25% in the share of each industry out of Korea’s exports to Japan in 2010. It is a lot difficult to catch the characteristics of the industries unless we try to resort the calculation results. We provide four kinds of categories based on the indices of average growth rate and variability (or affinity: adjusted R2) of the 44 industries in question.
The four-category classification can be obtained in South Korea’s industries exporting to Japan as follows: (a)vigorous industries, (b) stable industries, (c) unstable industries, and (d) declining industries. Figure 4 shows the targeted industries classified by the four categories. In sum, according to the results, South Korea’s industries exporting to Japan can be classified on the
basis of the indices of growth rate and variability (or the affinity: adjusted R2) by four categories.
We discuss each industry at the following Section 4 in more detail.
Figure 4: Four categories of South Korea’s industries exporting to Japan
Source: Calculated and drawn from the trade statistics of KITA (2012).
4. South Korea’s industries exporting to Japan
4.1. Vigorous industries
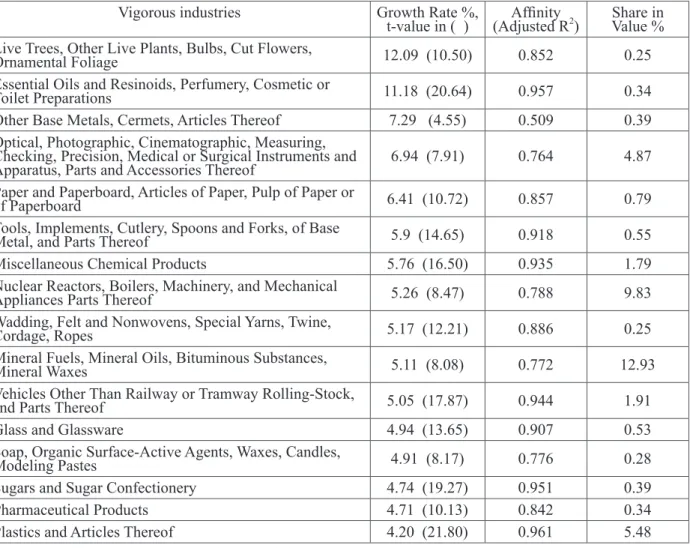
‘Vigorous industries’ are those with high average growth rate and low variability. As mentioned at Section 3, the low variability or high stability is represented by the high value of adjusted R2 when we estimate the equation (1). The average growth rate of 44 targeted industries was at 2.06%. We define here vigorous industries as those which show growth rates of more than twice the average growth (2.06%). Table 1 summarizes South Korea’s vigorous industries exporting to Japan in ordering of their growth rate.
Table 1: South Korea’s vigorous industries exporting to Japan
As can be seen in Table 1, the vigorous industries include the following ones when we write them with simplicity: Live Trees; Essential Oils; Other Base Metals; Optical, Photographic and Medical Instruments; Paper and Paperboard; Tools of Base Metal Parts; Miscellaneous Chemical Products; Nuclear Reactors, Boilers, Machinery; Wadding, Felt and Nonwovens; Mineral Fuels;
Vehicles Other Than Railway; Glass and Glassware; Soap, Organic Surface-Active Agents;
Sugars and Sugar Confectionery; Pharmaceutical Products; Plastics etc. We take account of vigorous industries separately at the aspects of: (a) vigorous industries with particularly high growth rate; and (b) vigorous industries with the high growth rate and the high percentage share out of total South Korea’s exports to Japan.
The vigorous industries with particularly high growth are those that show growth rate of 5-6 times higher than the average (2.06%). As we can see at Table 1, those industries are: Live Trees;
Essential Oils. The growth rate of Live Trees (specifically, Live Trees, Other Live Plants, Bulbs, Cut Flowers, Ornamental Foliage) is 12.09%, extremely high growth rate. In addition, the growth rate of Essential Oils (specifically, Essential Oils and Resinoids, Perfumery, Cosmetic or Toilet Preparations) shows 11.18%, also very high growth rate. The percentage shares of both industries of Live Trees and Essential Oils are low, however: the former’s share is 0.25%; the latter’s share is 0.34%.
Vigorous industries Growth Rate %,
t-value in ( ) Affinity
(Adjusted R2) Share in Value % Live Trees, Other Live Plants, Bulbs, Cut Flowers,
Ornamental Foliage 12.09 (10.50) 0.852 0.25
Essential Oils and Resinoids, Perfumery, Cosmetic or
Toilet Preparations 11.18 (20.64) 0.957 0.34
Other Base Metals, Cermets, Articles Thereof 7.29 (4.55) 0.509 0.39 Optical, Photographic, Cinematographic, Measuring,
Checking, Precision, Medical or Surgical Instruments and
Apparatus, Parts and Accessories Thereof 6.94 (7.91) 0.764 4.87
Paper and Paperboard, Articles of Paper, Pulp of Paper or
of Paperboard 6.41 (10.72) 0.857 0.79
Tools, Implements, Cutlery, Spoons and Forks, of Base
Metal, and Parts Thereof 5.9 (14.65) 0.918 0.55
Miscellaneous Chemical Products 5.76 (16.50) 0.935 1.79
Nuclear Reactors, Boilers, Machinery, and Mechanical
Appliances Parts Thereof 5.26 (8.47) 0.788 9.83
Wadding, Felt and Nonwovens, Special Yarns, Twine,
Cordage, Ropes 5.17 (12.21) 0.886 0.25
Mineral Fuels, Mineral Oils, Bituminous Substances,
Mineral Waxes 5.11 (8.08) 0.772 12.93
Vehicles Other Than Railway or Tramway Rolling-Stock,
and Parts Thereof 5.05 (17.87) 0.944 1.91
Glass and Glassware 4.94 (13.65) 0.907 0.53
Soap, Organic Surface-Active Agents, Waxes, Candles,
Modeling Pastes 4.91 (8.17) 0.776 0.28
Sugars and Sugar Confectionery 4.74 (19.27) 0.951 0.39
Pharmaceutical Products 4.71 (10.13) 0.842 0.34
Plastics and Articles Thereof 4.20 (21.80) 0.961 5.48
Note: The industries less than 0.25% in value are excluded.
Source: Calculated from the trade statistics of KITA (2012).
The vigorous industries with the high growth rate and the high share out of total South Korea’s exports to Japan are those with growth rate more than twice as high as the average growth rate, and with the relatively high share in South Korea’s exports to Japan. Those industries are: Optical, Photographic and Medical Instruments (4.87%); Nuclear Reactors, Boilers, Machinery (9.83%); Mineral Fuels (12.93%); and Plastics (5.48%)4, where the percentages in parentheses show the share of each industry out of Korea’s total exports to Japan.
It would be needed to take efforts for the development of these vigorous industries to improve trade balances of South Korea with Japan.
4.2. Stable industries
‘Stable industries’ indicate those with low average growth rate and low variability. As is the case of vigorous industries mentioned above, the low variability or high stability is represented by the high value of adjusted R2 when we estimate the equation (1). Stable industries are here defined as industries which show growth rate of less than twice the average growth (2.06%) as well as higher than the value of 0.6 in adjusted R2. South Korea’s stable industries exporting to Japan are presented in Table 2.
Table 2: South Korea’s stable industries exporting to Japan
As can be seen in Table 2, the stable industries include the following ones when we write them with simplicity: Copper; Organic Chemicals; Rubber; Aluminum; Preparations of Vegetables; Miscellaneous Articles of Base Metal; Electrical Machinery and Equipment;
Miscellaneous Edible Preparations; Articles of Iron or Steel; Preparations of Cereals; Beverages;
Inorganic Chemicals. Among those industries, we focus on the industries which are both highly stable (or, high value of adjusted R2) and large shares out of Korea’s exports to Japan as well.
The stable industries exhibit not only growth rates higher than the average growth rate (2.06%) with high adjusted R2 but also show comparatively high shares out of Korea’s exports
Stable industries Growth Rate %,
t-value in ( ) Affinity
(Adjusted R2) Share in Value %
Copper and Articles Thereof 3.87 (5.63) 0.618 0.78
Organic Chemicals 3.44 (9.18) 0.814 3.58
Rubber and Articles Thereof 3.38 (5.44) 0.601 1.27
Aluminum and Articles Thereof 3.16 (5.63) 0.617 0.99
Preparations of Vegetables, Fruit, Nuts, Other Parts of Plants 2.94 (8.85) 0.803 0.36
Miscellaneous Articles of Base Metal 2.91 (10.68) 0.856 0.25
Electrical Machinery and Equipment and Parts Thereof 2.77 (8.17) 0.776 22.23
Miscellaneous Edible Preparations 2.74 (9.84) 0.835 0.44
Articles of Iron or Steel 2.14 (5.93) 0.643 3.48
Preparations of Cereals, Flour, Starch, Milk Pastrycooks
Products 1.94 (8.69) 0.797 0.34
Beverages, Spirits, Vinegar 0.65 (10.35) 0.848 0.87
Inorganic Chemicals, Compounds of Precious Metals,
Rare-Earth Metals 0.34 (11.06) 0.865 1.29
Note and Source: See Table 1.
to Japan. Those industries include: Organic Chemicals; Electrical Machinery and Equipment (specifically, Electrical Machinery and Equipment and Parts Thereof); and Articles of Iron or Steel. The percentage shares of these industries out of Korea’s total exports to Japan and their values of variability represented by adjusted R2 are respectively 3.58% and 0.814 for Organic Chemicals; 22.23% and 0.776 for Electrical Machinery and Equipment; and 3.48% and 0.643 for Articles of Iron or Steel. In particular, in the case of Electrical Machinery and Equipment among those industries, while its growth rate is somewhat higher at 2.77% than overall average growth rate at 2.06%, the industry enjoys the highest export share (22.23%) out of the export-industries of South Korea to Japan (in reference, its adjusted R2=0.776).
4.3. Unstable industries
‘Unstable industries’ are those with strong dispersion in terms of growth or high degree of variability. That is to say, their adjusted R2 values are low in the estimation of equation (1).
Some industries among them are characterized by comparatively low growth rate including the industries which display negative growth, while there are other industries with growth rate that surpasses the average growth rate (2.06%) for all industries exporting to Japan. Table 3 shows South Korea’s unstable industries exporting to Japan.
Table 3: South Korea’s unstable industries exporting to Japan
The categories of the industries are here defined as those which illustrate unstable situation at the value of adjusted R2 is lower than 0.5. The unstable industries include the industries with both positive and negative growth rate as shown Table 3. They consist of the following ones: Aircraft and Spacecraft; Pearls and Precious Stones; Ores, Slag, Ash; Iron and Steel;
Edible Vegetables; Impregnated, Coated Textile Fabrics; Miscellaneous Manufactured Articles;
Furniture, Bedding, Prefabricated Buildings; Man-Made Filaments; Preparations of Meat, of Fish. We try to break the unstable industries down into: (a) industries with comparatively high growth rates as well as high variability; (b) industries with high share out of Korea’s total exports to Japan but high variability; and (c) industries with low growth rates but high variability.
Unstable industries Growth Rate %,
t-value in ( ) Affinity
(Adjusted R2) Share in Value %
Aircraft, Spacecraft and Parts Thereof 4.70 (2.07) 0.148 0.41
Pearls, Precious or Semi-Precious Stones, Precious Metals,
Coin 3.93 (3.83) 0.419 3.42
Ores, Slag, Ash 2.90 (3.25) 0.335 0.25
Iron and Steel 1.17 (2.02) 0.140 10.1
Edible Vegetables, Roots, Tubers 0.75 (1.42) 0.051 0.27
Impregnated, Coated, Covered or Laminated Textile Fabrics 0.71 (2.57) 0.071 0.28
Miscellaneous Manufactured Articles -0.58 (-1.32) 0.114 0.26
Furniture, Bedding, Mattresses, Cushions, Lamps & Lighting
Fittings Prefabricated Buildings -1.04 (-3.56) 0.381 0.45
Man-Made Filaments -1.69 (-3.52) 0.375 0.33
Preparations of Meat, of Fish, of Crustaceans Mollusks, Other
Aquatic Invertebrates -1.85 (-3.87) 0.424 0.35
Note and Source: See Table 1.
The industries with comparatively high growth rates as well as high variability (low value of adjusted R2) are composed of: Aircraft and Spacecraft and Parts Thereof; Pearls and Precious Stones (specifically, Pearls, Precious or Semi-Precious Stones, Precious Metals, Coin);
Ores, Slag, Ash. The average growth rates and adjusted R2 are respectively 4.70% and 0.148 for Aircraft and Spacecraft; 3.93% and 0.419 for Pearls and Precious Stones; 2.90% and 0.335 for Ores, Slag, Ash. These industries can be characterized as industries with potentially merit efforts for conversion into vigorous industries if South Korea takes efforts to lessen the degree of variability.
The industry with high share out of Korea’s total exports to Japan but high variability is the industry of Iron and Steel. Although the Iron and Steel industry has a low growth rate of 1.17%
and high variability (the value of adjusted R2 is 0.140), it shows quite high share out of Korea’s total exports to Japan at 10.1%.
The industries with low growth rates (including some industries with negative growth rates) but high variability (low value of adjusted R2) are composed of: Impregnated, Coated Textile Fabrics5; Miscellaneous Manufactured Articles; Furniture, Bedding, Prefabricated Buildings6; Man-Made Filaments; Preparations of Meat and, of Fish7. The average growth rates and adjusted R2 are respectively 0.71% and 0.071 for Impregnated, Coated Textile Fabrics; -0.58% and 0.114 for Miscellaneous Manufactured Articles; -1.04% and 0.381 for Furniture, Bedding, Prefabricated Buildings; -1.69% and 0.375 for Man-Made Filaments; -1.85% and 0.424 for Preparations of Meat, of Fish.
4.4. Declining industries
‘Declining industries’ are those which have a strong downwards tendency showing negative growth or secular stagnation with high value of adjusted R2. Table 4 illustrates South Korea’s declining industries exporting to Japan.
Table 4: South Korea’s declining industries exporting to Japan
Declining industries not only illustrate the negative growth rates but also suffer from a strong trend in negative growth over the last 20 years. Their strong negative trends are backed up by the high adjusted R2 value, as can be seen at Table 4. The declining industries include
Declining industries Growth Rate %,
t-value in ( ) Affinity
(Adjusted R2) Share in Value % Articles of Leather or of Animal Gut, Harness, Travel Goods,
Handbags -8.15 (-22.32) 0.963 0.12*
Articles of Apparel and Clothing Accessories, Not Knitted or
Crocheted -5.45 (-18.24) 0.946 0.41*
Articles of Apparel and Clothing Accessories, Knitted or
Crocheted -4.81 (-12.23) 0.887 0.84
Toys, Games and Sports Requisites, Parts and Accessories
Thereof -3.33 (-11.19) 0.867 0.24
Oil Seeds, Oleaginous Fruit, Industrial or Medicinal Plant,
Straw, Fodder -2.44 (-12.93) 0.897 0.27
Fish, Crustaceans, Mollusks, Other Aquatic Invertebrates -1.57 (-7.85) 0.761 2.35 Note: * These two industries are included to show the drastic decrease, though the industries with the share of less than 0.25%
out of Korea’s total exports to Japan are excluded in the classification.
Source: Calculated from the trade statistics of KITA (2012).
the following ones when we write them with simplicity: Articles of Leather or of Animal Gut;
Articles of Apparel Not Knitted; Articles of Apparel Knitted; Toys, Games and Sports Requisites;
Oil Seeds, Oleaginous Fruit; Fish, Crustaceans, Mollusks. Their growth rates are8: -8.15%
for Articles of Leather or of Animal Gut; -5.45% for Articles of Apparel Not Knitted; -4.81%
for Articles of Apparel Knitted; -3.33% for Toys, Games and Sports Requisites; -2.44% for Oil Seeds, Oleaginous Fruit; -1.57% for Fish, Crustaceans, Mollusks. All of these declining industries have high values of adjusted R2 as appeared in Table 4..
Nearly all of the declining industries in South Korea described above are labor-intensive industries. Watanabe (1980) points out that Japan was faced with challenges from the Asian countries, including South Korea, in 1960 to 1970s. The declining industries in South Korea have been eclipsed in terms of competitiveness by counterparts in China, Southeast Asia nations, and other developing countries.
5. Industries with strong potentials in Japanese market
Many existing studies, including Kim (2009), Rajan (1996), and Chou and Shih (1991) among others, focused on macroeconomic side about the trade deficit without considering industrial structures in detail. South Korea has had the export-oriented industrial structure that induced its imports from Japan, which has significantly caused its trade deficits with Japan to appear. In order to improve current trade balances between Japan and Korea, Yoon and Ahn (2008) suggest that Korea maintain the technical superiority of main items such as parts or materials. Kim and Noh (2008) also assert that Japanese companies invest to Korea, and for that to happen, Korea improve conditions for investment in the country by establishing dedicated apartment complexes for Japanese parts and materials companies.
The studies such as Yoon and Ahn (2008) and Kim and Noh (2008) are those emphasized on the movement of Japanese capitals or materials industries into South Korea. They do not indicate, however, what kinds of industries should be invested into South Korea in concrete. Our study takes account of the movement of South Korea’s merchandises and services into Japan, and recommends what kinds of the industries should be taken into consideration. The measures that South Korea enhances its exports to Japan are expected to improving trade balances between the two countries.
In the previous Section 4, we could obtain the four-category classification in Korea’s industries exporting to Japan: vigorous industries, stable industries, unstable industries, and declining industries. In order to expand South Korea’s exports to Japan or to narrow trade gaps between the two countries, it would be needed for Korea to foster ‘star’ industries with not only high growth rate but also high market share in Japan. One of suggested measures to raise the status of exports to Japan, for instance, can be the development of industries with a strong potential for the exports to Japan such as the industries of electrical machinery and equipment, and their parts etc. There have not appeared Korea’s star industries in Japanese market so far, which requires that Korea make efforts to nurse star industries. How will South Korea be able to foster star industries or to expend its exports to Japan? We propose some measures to nurse the industries with strong potentials.
Firstly, two candidates can be chosen for enhancing exports to Japan among the vigorous industries. One candidate is the industries which stand out for their especially high growth such as Live Trees (specifically, Live Trees, Other Live Plants, Bulbs, Cut Flowers, Ornamental
Foliage) and Essential Oils (specifically, Essential Oils and Resinoids, Perfumery, Cosmetic Or Toilet Preparations). The growth rates of Live Trees and Essential Oils are 12.09% and 11.18%
respectively. This result implies that though the two industries stand out in growth rate, they have limitations that the percentage shares are quite low.
The other candidate is the industries with high growth rate and high percentage shares out of Korea’s total exports to Japan. Those industries are: Optical, Photographic and Medical Instruments (4.87%); Nuclear Reactors, Boilers, Machinery (9.83%); Mineral Fuels (12.93%);
and Plastics (5.48%), whose percentage shares appear in parentheses. These industries can play an important role for improving Korea’s trade balances with Japan.
Next, we may find other measures among stable industries which display relatively high growth rate and high stability (high value of adjusted R2). Those industries include the following ones: Organic Chemicals (3.58% and 0.814); Electrical Machinery and Equipment (22.23%
and 0.776); and Articles of Iron or Steel (3.48% and 0.643), where the percentage shares of each industry out of Korea’s total exports to Japan and the values of adjusted R2 are written in parentheses respectively. In particular, among these industries, note that the industry of Electrical Machinery and Equipment boasts the highest export share at 22.23%, the growth rate (2.77%) of which is higher than overall average growth rate (2.06%). This industry has a strong potential to be a star industry.
Finally, we may also find some measures among unstable industries which display high growth rate but high variability (low value of adjusted R2). Those industries consist of: Aircraft and Spacecraft and Parts Thereof (4.70% and 0.148); Pearls and Precious Stones (3.93% and 0.419); Ores, Slag, Ash (2.90% and 0.335), where their growth rates and the values of adjusted R2 are shown in parentheses respectively. Taking efforts to convert these industries into vigorous ones would result in the effects for improving trade balances if South Korea could lessen the degree of variability. On the other hand, Iron and Steel sector shows high percentage share out of Korea’s total exports to Japan but exhibits high variability. The growth rate of the sector is just at 1.17% and the value of adjusted R2 records low at 0.140, but the percentage share out of Korea’s total exports to Japan is very high at 10.1%.
6. Concluding remarks
South Korea has chronically recorded huge trade deficit with Japan. The excessively skewed trade towards a particular country can make bilateral trade undesirable and lead to inefficiencies because economic activity options of the country that is deeply dependent on another country are limited so much. This paper analyzed South Korea’s industries exporting to Japan, reviewing bilateral trade relations between the two countries. The four categories could be obtained in Korea’s industries exporting to Japan based on the classification of HS (Harmonized System):
vigorous industries, stable industries, unstable industries, and declining industries.
Yoshimatsu (2001) examines antidumping policy and trade policy preferences of the Ministry of International Trade and Industry (MITI) in Japan. According to Yoshimatsu (2001), MITI bureaucrats sought to settle dumping issues swiftly by encouraging the industries in the 1980s. As Japan has experienced trade disputes, however, they have strictly applied the rule- governed principles to antidumping behavior over time. This discussion implies that the role of policy authorities is important in whether to promote trade or not. It has passed more than a decade since the Japan-South Korea Joint Research Committee issued its joint research report on
the bilateral Free Trade Agreement (FTA) as of 2003, yet economic collaboration between the two countries still remains inadequate9.
This paper recommends some measures to raise the status of Korea’s exports to Japan through the development of industries such as electrical machinery and equipment for fostering them as star industries. It would be noteworthy that Japan is a society that has accumulated huge volumes of asset, technology and capital, but these stocks are not being sufficiently put to use. Conversely, South Korea boasts economic dynamism but runs short of accumulated stocks compared to Japan. Korea can also make positive use of accumulated technology and capital in Japan for enhancing their trade volumes and for vitalizing their economies. A deepening recognition that Japan and South Korea are strategic partners each other can offer reciprocal benefits for their companies and play a role for the revitalization of the Japanese economy.
We just made use of the official data provided by Japan and South Korea, not taking account of the trade features of value chains through other countries other than the two countries.
Also we utilized the data at the level of HSK2 categorization in analyzing the characteristics of South Korean industries exporting to Japan. If we considered the value chain effects through other countries and HS classification in detail besides HSK2 categorization, then more concrete policy implications might be derived.
* I am grateful to helpful comments from an anonymous referee and the participants of the Economic Research Institute for Northeast Asia on 3 December 2011 and of the symposium on Japan-Korea Economic Cooperation on 21 December 2010. Remaining errors that can occur are my own.
† Professor, Department of Economics, Yokohama City University
1 Watanabe(1980) states that Japanese industry has the structure of characteristics with self-sufficient nature comparing to the United State and Germany.
2 Besides the indices of growth rate and the stability, other indicator that shows regional disparity is also used to evaluate tax system. Refer to Ishi (2001) in the case of Japan.
3 The share of each industry is based on the data during January to October in 2010.
4 Refer to Table 1 about specific ranges of these industries.
5 Specifically, Impregnated, Coated, Covered or Laminated Textile Fabrics.
6 Specifically, Furniture, Bedding, Mattresses, Cushions, Lamps & Lighting Fittings Prefabricated Buildings.
7 Specifically, preparations of meat, of fish, of crustaceans mollusks, other aquatic invertebrates.
8 Refer to Table 4 about specific ranges of these industries.
9 Cheong (2013) emphasizes that trade liberalization measures could be political, social and economic issues reviewing recent FTA policy in Korea.
References
Cheong, I. (2013): “Importance of public outreach to the FTA Policy: The case of Korea”. The Northeast Asian Economic Review, 1(1), pp.41-50.
Chou, W.L., and Y. C. Shih. (1991): “Asian NICs’ persistent trade deficit with Japan”. International Economic Journal, 5(3), pp.59-74.
Gentry, W. M., and H. F. Ladd. (1994): “State tax structure and multiple policy”. National Tax Journal, 47, December, pp.747-772.
Ishi, H. (2001): The Japanese Tax System, 3rd Edition, Oxford University Press.
Japan-South Korea Joint Research Committee. (2003): Bilateral Research Committee Report on Japan-South Korea Free Trade Agreement. October [in Japanese].
KITA (Korea International Trade Association) (2012): Trade statistics. KITA, Seoul [online; citied February 2012.] Available from http://www.kita.net/statistic/index.jsp
KITA (Korea International Trade Association) (2014): Trade statistics of Korea. KITA, Seoul [online; citied May 2014.] Available from http://stat.kita.net/
KOSIS (Korean Statistical Information Service) (2012): Statistical database. KOSIS, Daejeon [online; citied
February 2012] Available from http://kosis.kr/eng/database/database_001000.jsp
KOTRA (Korea Trade-Investment Promotion Association) (2010): Promising Sectors and Strategies for Investment in the Japanese Market. KOTRA, Seoul [in Korean].
Kim, A. (2009): “An empirical analysis of Korea’s trade imbalances with the US and Japan”, Journal of the Asia Pacific Economy, 14(3), pp.211-226.
Kim, J. Y., and W. J. Noh. (2008): Reasons for the Chronic Trade Deficit with Japan. Research Department, Bank of Korea, BOK research 2008-27, September, [in Korean].
Kook, J. (2001): “A comparative study of tax systems between Korea and Japan”. The Korean Journal of Public Finance. 15(2), pp.251-286.
Ministry of Finance in Japan (2014): Trade Statistics of Japan [online; citied May 2014.] Available from http://
www.customs.go.jp/toukei/sankou/howto/krei.htm.
Mizuno, J. (2010): “The Problem of South Korea’s Trade Deficit with Japan”. JETRO (Japan External Trade Organization) - IDE (Institute of Developing Economies) Interim Report, 2009-Ⅳ-30 [in Japanese].
NIPSSR (National Institute of Population and Social Security Research) (2012): Population Statistics. Tokyo [online; citied February 2012.] Available from http://www.ipss.go.jp/p-info/e/Population%20%20 Statistics.asp
Oh, J. W., Y. S. Kang, Y. S. Lee, and O. K. Kweon (2011): A Research Study on Factors of Success and Failure of South Korea’s Companies Entering Japan. Korea-Japan Cooperation Foundation for Industry and Technology, Japan Study 11-02 [in Korean].
Pan, L. (2009): “A study on the possible causes of china’s trade deficits with South Korea after their establishment of diplomatic relation”, Asian Social Science. 5(11), pp.147-150.
Rajan, R.S. (1996): “Singapore’s bilateral merchandise trade linkages with Japan and the United States: trends, patterns and comparisons”. Asian Economic Journal, 9(2), pp.133-163.
Research Department of BOK. (2009): South Korea’s Current Account Balance: Focusing on Structural Analysis and Improving Measures. BOK (Bank of Korea) [in Korean].
Simandjuntak, D.S. (1991): “The roles of Japan in Asian Economies”. Asian Economic Journal, 5(1), pp.40-55.
Watanabe, T. (1980): “An analysis of economic interdependence among the Asian NICs, the ASENAN nations, and Japan”. The Developing Economies, 18(4), pp. 393-411.
White, F. C. (1983): “Trade-off in growth and stability in state taxes”. National Tax Journal 36, March, pp.103- Yoon, S. K., and D. J. Ahn. (2008): “Analysis of Factors to Affect Current Account Balance”. 114. MONTHLY
BULLETIN, Research Department, Bank of Korea, November, pp.24-58 [in Korean].
Yoshimatsu, H. (2001): “Trade policy in transition? Political economy of antidumping in Japan”. Journal of the Asia Pacific Economy, 6(1), pp.22-46.