0$< 201
VOLUME 23 - NO. 5
2013 Bank of Jamaica Nethersole Place
Kingston Jamaica
Telephone: (876) 922 0750-9 Fax: (876) 922 0854 E-mail: library@boj.org.jm
Internet: www.boj.org.jm
ISSN 1018-9084
CONTENTS
Pages
Monetary Aggregates ………..……… 1
Commercial Banks Assets and Liabilities ………..……… 1
Commercial Banks Deposits and Loans ………....…… 1-2 Commercial Banks Liquidity ………...…… 2
Interest Rates (Selected) ……….….. 2-3 Securities ………..…. 3
Instalment Credit ……….…….. 3
Near-Banks ……….….. 4
Building Societies………..……. 4
Inflation Rates ……….….. 5
Actual Production ………...….. 5
Gross Domestic Product ……….... 5
Stock Market Activities ………...….. 5
Remittances………..…….. 5
Tourism ………... 5
External Trade ………..……….….. 6
Balance of Payments BOJ ……….…..…….. 7
Net International Reserves ………..…….. 8
Foreign Exchange Developments………...… 8
Graphs
Fig. 1 - Money Supply (Local and Foreign Currency) Fig. 2 - Money Supply and Base Money
Fig. 3 - Commercial Bank: Assets and Liabilities Fig. 4 - Commercial Banks: Deposits and Loans Fig. 5 - Commercial Banks: Interest rates
Fig. 6 - G.O.J Treasury Bills: Weighted Average (Yield) Fig. 7 - Near Banks: Assets and Liabilities
Fig. 8 - Instalment Credit
Fig. 9 - Building Societies: Assets and Liabilities Fig. 10 - Inflation & CPI
Fig. 11 - JSE Index
Fig. 12 - Remittance Inflows
Fig. 13 - Current Account (BOP)
Fig. 14 - BOP Sub-Accounts
The following are the revisions to the previously published Economic Statistics (April 2013)
CATEGORY Description of Change Page Number
III. Selected Interest Rates (%)
Commercial Banks (Domestic Currency)
Fixed Deposits 3‐6mths Data Revised (+) 2
Open‐Market Operations Footnote Removed 3
Document Change Control
Apr-12 Mar-13 Apr-13 % change p.a.
I. MONETARY AGGREGATES (J$mn) Local and Foreign Currency
Money Supply (M1) ………..……….… 114,229.79 139,823.85 138,251.81 21.03 Currency with the Public ……… 47,538.03 50,754.37 49,054.52 3.19 Demand Deposits (adj)* ………... 66,691.76 89,069.47 89,197.29 33.75 Quasi-Money ………..……. 234,351.07 256,600.06 256,574.75 9.48 Time ……….…..…… 55,062.29 64,345.92 62,279.34 13.11 Savings ………..……. 179,288.78 192,254.13 194,295.42 8.37 Money Supply (M2) ………...… 348,580.86 396,423.90 394,826.56 13.27 Domestic Credit ………...… 347,782.56 386,481.24 402,328.56 15.68 Local Currency
Money Supply (M1) ………..…...… 104,963.11 113,240.38 110,570.75 5.34 Currency with the Public ……….… 47,538.03 50,754.37 49,054.52 3.19 Demand Deposits (adj)* ………..……..… 57,425.08 62,486.01 61,516.24 7.12 Quasi-Money ……….…...… 131,353.15 138,888.33 137,471.18 4.66 Time ………...…… 28,905.77 33,109.27 31,803.02 10.02 Savings ………..…. 102,447.38 105,779.06 105,668.16 3.14 Money Supply (M2) ………...… 236,316.26 252,128.71 248,041.93 4.96 Domestic Credit ……….……..… 276,709.56 314,356.23 327,260.49 18.27 Apr-12 Mar-13 Apr-13 % change p.a.
Base Money ……….…...… 84,966.58 91,294.45 89,613.98 5.47
Fig. 1 Fig. 2
II. COMMERCIAL BANKS (J$mn) Apr-12 Mar-13 Apr-13 % change p.a.
Assets & Liabilities (J$mn)*** ………..…..… 614,465.68 685,987.34 672,290.20 9.41 Loans** ………...…… 277,917.51 322,780.53 326,538.37 17.49 Agriculture ………..……….… 5,990.44 6,434.77 6,347.31 5.96 Manufacturing ………... 8,143.81 12,349.21 11,765.98 44.48 Construction & Land Development …………...…. 22,569.57 22,115.83 22,648.08 0.35
Mining ………....… 524.11 646.99 642.79 22.64
Tourism ………... 28,162.17 25,025.31 24,978.74 -11.30 Transport, Storage & Communication ……… 11,494.31 12,507.94 12,950.11 12.67 Consumer-Oriented ………... 167,170.45 203,760.18 206,334.46 23.43 Government Services ……….… 26,027.67 22,834.57 24,846.77 -4.54 Other ………..….… 7,834.98 17,105.72 16,024.13 104.52 Loan Quality (%) - 3 mths & Over Apr-12 Mar-13 Apr-13
Past Due Loans / Total Loans ………...…. 8.05 6.36 6.33
0 20,000 40,000 60,000 80,000 100,000 120,000 140,000 160,000
J M
$ M N
Money Supply - M1 Local and Foreign Currency
Apr 2012 - Apr 2013
Currency with the Public Demand Deposits (adj.) M1
75,000 78,000 81,000 84,000 87,000 90,000 93,000 96,000 99,000
0 60,000 120,000 180,000 240,000 300,000 360,000 420,000
J M
$ m n J
M
$ m n
Money Supply and Base Money Apr 2012 - Apr 2013
M1 M2 Base Money -r.h.s
* Includes provision for loan losses; and excludes loans acquired by FINSAC.
** Excludes Deposits of Government, Public Entities, Financial Institutions and Non Residents
+ Revised 1
Fig. 3 Fig. 4
II. COMMERCIAL BANKS (J$mn) (Cont'd) Apr-12 Mar-13 Apr-13 % change p.a.
DEPOSITS ………...……. 403,690.09 465,098.38 451,636.35 11.88 Private Sector (including overseas residents) …...….. 324,053.34 368,038.62 367,644.24 13.45 Time ……….….. 68,046.61 75,962.17 73,763.71 8.40 Savings ………..…...….. 189,607.50 202,239.90 204,453.66 7.83 Demand ………..…. 66,399.23 89,836.55 89,426.88 34.68 Government ………..………...…… 30,422.38 32,691.78 30,506.34 0.28 Time ………..………...….. 1,513.12 2,058.34 1,981.14 30.93 Savings ………..………...….. 3,437.01 4,645.42 3,673.33 6.88 Demand ………..………...…. 25,472.25 25,988.03 24,851.88 -2.44 Public Entities ………..…..…. 32,194.84 37,300.98 29,526.54 -8.29 Time ………..…...….. 13,854.57 23,055.30 15,636.40 12.86 Savings ………..…...….. 11,738.05 7,897.54 7,328.02 -37.57 Demand ………..…...……. 6,602.22 6,348.15 6,562.13 -0.61 Spec. & O.F. Insts. ………...…… 17,019.53 27,066.99 23,959.22 40.77 Time ………....….….. 3,811.68 4,223.83 4,330.07 13.60 Savings ………..…….. 1,443.65 4,028.76 3,055.04 111.62 Demand ………..……...…. 11,764.20 18,814.40 16,574.11 40.89
Mar-12 Feb-13 Mar-13
Current Account Balances with BOJ (J$mn) ……....….. 194.18 121.47 1,196.55 516.21
LIQUIDITY (Average) % Apr-12 Mar-13 Apr-13
Actual Liquid Assets Ratio …………..……...………. 33.14 32.94 29.16
Cash ………..……...…….. 2.87 2.64 2.70
Deposits with BOJ ………..………...…. 12.34 12.14 12.56
Treasury Bills ……….………...…. 0.26 0.26 0.13
Other ………..……. 17.67 17.90 13.77
Statutory Requirement ……….……… 26.00 26.00 26.00 +
III. SELECTED INTEREST RATES (%) Apr-12 Mar-13 Apr-13
COMMERCIAL BANKS (Domestic Currency) Fixed Deposits (J$100,000 & over)
3-6 months ………..…..…. 2.00 - 6.40 0.90 - 5.00 0.90 - 5.30 9-12 months ………...…..….. 2.00 - 6.75 0.90 - 5.50 0.90 - 6.10 Call Deposits ………..……...….. 2.00 - 5.75 1.00 - 9.00 1.90 - 10.00 Average Savings Deposits ………..…...…….. 2.10 1.94 1.59 Average Loan Rate ………..…...……. 18.12 17.23 17.29 Average Inter-bank Rate ………..……..…… 3.79 4.77 4.80 560,000
580,000 600,000 620,000 640,000 660,000 680,000 700,000
J
$ M N
Commercial Banks - Assets and Liabilities Apr 2012 - Apr 2013
150,000 210,000 270,000 330,000 390,000 450,000 510,000
J
$ M N
Commercial Banks - Deposits and Loans Apr 2012 - Apr 2013
ComBank Loans Deposits
2
III. SELECTED INTEREST RATES (%) (Cont'd) Apr-12 Mar-13 Apr-13 COMMERCIAL BANKS (Foreign Currency)
Fixed Deposits (Under US$100,000)
1-3 months ………..….………… 0.50 - 3.70 0.50 - 3.70 0.40 - 3.70 3-6 months ………...………… 0.75 - 4.00 0.75 - 4.00 0.65 - 4.00 6-12 months ……….…..….…. 0.94 - 4.40 0.94 - 4.40 0.85 - 4.40 Fixed Deposits (US$100,000 & Over)
1-3 months ………...…… 0.80 - 3.70 0.80 - 3.70 0.80 - 3.70 3-6 months ……….…..…… 0.86 - 4.00 0.86 - 4.00 0.86 - 4.00 6-12 months ………..……… 1.01 - 4.40 1.01 - 4.40 1.01 - 4.40 Average Loan Rates ……….…..…… 10.11 10.05 9.80
Average Savings ………..…… 0.79 0.69 0.69
COMMERCIAL BANKS (Domestic Currency) Apr-12 Mar-13 Apr-13 Weighted Fixed Deposits Rate ………....….. 3.71 3.55 3.32 Overall Weighted Deposit Rate ………...…… 2.19 1.80 1.67 Weighted Loan Rate ………...…… 19.04 17.97 17.92 G.O.J. Treasury Bills (Weighted Average) Yield May-12 Apr-13 May-13
1 Months:……….……… 6.25 - -
3 Months:………...…… 6.30 6.68 6.62
6 Months:………...…… 6.44 6.39 6.44
Fig. 5
BOJ Open Market Rates (%) ………...…..….. May-12 Apr-13 May-13
30-Day ………..…..……. 6.25 5.75 5.75
49-Day ………..…..……. - - -
180-Day ………..…..…… - 5.97 6.77
365-Day ………..…..…… - 4.75 -
IV. SECURITIES (J$mn) (Outstanding Balances) May-12 Apr-13 May-13 % change p.a GOJ Benchmark Investment Notes ………..…….. 861,561.79 892,736.17 893,191.26 3.67 May-12 Apr-13 May-13 % change p.a GOJ Treasury Bills ………..……..…… 4,000.00 4,000.00 4,000.00 0.00 BOJ Open Market Operations ……….……..…… 96,120.15 44,920.51 48,673.66 -49.36 V. INSTALMENT CREDIT (J$mn) (Banks & Near Banks) Apr-12 Mar-13 Apr-13 % change p.a.
Total Credit Outstanding ……….…….….… 40,359.54 56,875.54 56,971.95 41.16 New Business ……….……….….… 2,199.91 2,929.37 2,575.68 17.08
Fig. 6
0.00 2.50 5.00 7.50 10.00 12.50 15.00 17.50 20.00 P e r c e n t
Commercial Banks - Interest Rates Apr 2012 - Apr 2013
Overall Deposits Weighted Loan
0.00 2.00 4.00 6.00 8.00 10.00
P e r c e n t
G.O.J Treasury Bills - Weighted Average (Yield) May 2012 - May 2013
1-Month 3-Month 6-Month
** As at June 2008 PanCaribbean Merchant Bank ended operations 3
VI. NEAR-BANKS (J$mn)* Apr-12 Mar-13 Apr-13 % change p.a.
(Merchant Banks, Trust Com & Finance Houses)
Assets/Liabilties ……….……..…..…… 20,816.44 22,490.53 23,205.37 11.48 Loans Outstanding ……….…..… 6,898.61 5,820.62 6,248.88 -9.42 Total Deposits ………..…..……… 6,490.16 8,882.11 9,402.26 44.87 Loan Quality (%) - 3 mths & Over Apr-12 Mar-13 Apr-13 % change p.a.
Past Due Loans / Total Loans ……….……… 45.57 9.63 9.03 -80.18
Liquidity Ratio Mar-12 Feb-13 Mar-13
Liquid Assets Ratio (average) % ……….………..… 29.62 34.00 39.55 Statutory Requirement ……….…….….… 26.00 26.00 26.00
Fig. 7
NEAR-BANKS (J$mn)** - Cont'd Apr-12 Mar-13 Apr-13 % change p.a.
Loans ………...… 6,898.61 5,820.62 6,248.88 -9.42
Agriculture ………...…...….… 18.58 25.66 419.68 2,158.75 Manufacturing ………...…...…… 351.39 309.53 300.50 -14.48 Construction & Land Development ………..…...…..… 2,277.43 517.52 509.92 -77.61 Mining, Quarrying & Processing ……….….…...… 0.00 126.94 126.30 -
Tourism ………..…...….…. 303.42 72.45 240.39 -20.77
Transport, Storage & Communication ……….……....… 0.41 136.91 134.58 32,804.16 Consumer Oriented ……….……… 3,893.81 4,595.75 4,483.41 15.14 Government Services ………...……. 0.18 0.00 0.00 -100.00
Other ……….…….. 53.38 35.87 34.10 -36.12
VII. BUILDING SOCIETIES (J$mn) Apr-12 Mar-13 Apr-13 % change p.a.
(members & associate members)
Assets/Liabilities ……….… 192,745.42 200,240.92 203,301.90 5.48 Loan Balances ……….….… 90,206.24 98,489.01 99,015.99 9.77 Savings Funds ………...…… 124,648.86 134,746.97 136,340.80 9.38 Loan Quality (%) - 3 mths & Over Apr-12 Mar-13 Apr-13
Past Due Loans / Total Loans ……….…...….…… 6.53 5.74 5.65
Fig. 9
Fig. 8
Fig. 10
0 5,000 10,000 15,000 20,000 25,000
Apr‐12 May‐12 Jun‐12 Jul‐12 Aug‐12 Sep‐12 Oct‐12 Nov‐12 Dec‐12 Jan‐13 Feb‐13 Mar‐13 Apr‐13
J
$ m n
Near Banks: Assets & Liabilities Apr 2012 ‐Apr 2013
Assets & Liabilities Deposits Loans and Advances
0 10,000 20,000 30,000 40,000 50,000 60,000
0 600 1,200 1,800 2,400 3,000 3,600 4,200
J
$ m n J
$ m n
Instalment Credit
Mar 2012 ‐Mar 2013
New Business ‐ l.h.s Credit Outstanding ‐ r.h.s
0 30,000 60,000 90,000 120,000 150,000 180,000 210,000 240,000
J
$ M N
Building Societies - Assets and Liabilities Apr 2012 - Apr 2013
Assets & Liab Loans & Advances Savings Fund
170 175 180 185 190 195 200
-0.6 -0.3 0 0.3 0.6 0.9 1.2 1.5 1.8 2.1
I n d e x P
e r c e n t
Inflation & CPI Apr 2012 - Apr 2013
Inflation Rate ‐ l.h.s CPI ‐ r.h.s
* As at June 2008 PanCaribbean Merchant Bank ended operations
4
VIII. INFLATION Apr-12 Mar-13 Apr-13 % change p.a.
Consumer Price Index (Dec 2006 = 100) ………...… 181.9 197.7 198.5 9.13 Monthly Rate (%) ………...… 0.4 1.4 0.4
Calendar Year to Date (%) ……….… 2.1 2.7 3.2 Fiscal Year to Date (%) ……….………....… 0.4 9.1 0.4
IX. ACTUAL PRODUCTION ('000) Apr-12 Mar-13 Apr-13 % change p.a.
Crude Bauxite (tonnes) ………..……....… 348.31 461.19 377.77 8.46 Alumina (tonnes) ………...….. 150.37 137.99 143.45 -4.60 Sugar (tonnes) ……….…...…....… 17.83 28.48 17.30 -2.97
X.
QUARTERLY GROSS DOMESTIC PRODUCT
REAL GROWTH RATES (%) Dec-11 Sep-12 Dec-12
Total Value-Added at Basic Prices
Seasonally Adjusted*** ………..…….… -0.2 0.2 -1.1 Seasonally Unadjusted**** ……….…….….… 1.5 -0.2 -0.9
XI. STOCK MARKET ACTIVITIES May-12 Apr-13 May-13 % change p.a.
Index* ………....…….… 88,381.96 83,476.38 87,577.92 -0.91 Volume Traded (mn)** ………..… 199.17 41.65 69.06 -65.32 Ordinary Shares ………...…….… 199.17 41.63 69.05 -65.33
Block Transactions ………..…….… 0.00 0.02 0.01 -
Value of stocks Traded (J$mn)** ………..…….… 5,360.90 401.90 656.24 -87.76 Ordinary Shares ……….……… 5,360.90 401.75 656.13 -87.76
Block Transactions ………..…… 0.00 0.15 0.11 -
Advance/Decline Ratio** ………. 9/21 19/9 21/6
Fig. 11
XII. REMITTANCE (US$mn) Feb-12 Jan-13 Feb-13 % change p.a.
Net Remittances ………..……….….… 144.8 127.3 137.0 -5.39 Total Remmittance Inflows ……….…...….… 167.2 151.5 157.8 -5.62 Remittance Companies ………...……….… 142.4 129.2 132.4 -7.02 Other Remittances ………...…....… 24.8 22.3 25.4 2.42 Total Remmittance Outflows ………..… 22.4 24.2 20.8 -7.14
XIII. TOURISM Mar-12 Feb-13 Mar-13 % change p.a.
Tourists Arrivals ('000) ………...……..… 366.52 304.89 361.13 -1.47 Stop Over ………...…. 204.72 166.01 213.11 4.10 Foreign Nationals ………...……. 192.33 157.04 199.67 3.82 Non - Resident Jamaicans ………...… 12.39 8.97 13.44 8.42 Cruise ……….…………...….…. 161.79 138.88 148.02 -8.51
Fig. 12
76,000 78,000 80,000 82,000 84,000 86,000 88,000 90,000 92,000 94,000
U N I T S
JSE Index May 2012 - May 2013
120.0 140.0 160.0 180.0 200.0 220.0
Feb‐12 Mar‐12 Apr‐12 May‐12 Jun‐12 Jul‐12 Aug‐12 Sep‐12 Oct‐12 Nov‐12 Dec‐12 Jan‐13 Feb‐13
U S
$
M N
Remittance Inflows Feb 2012 - Feb 2013
* As at end of month ** Monthly values
*** Percentage change (%) over preceeding quarter
**** Percentage change (%) over corresponding quarter of previous year 5
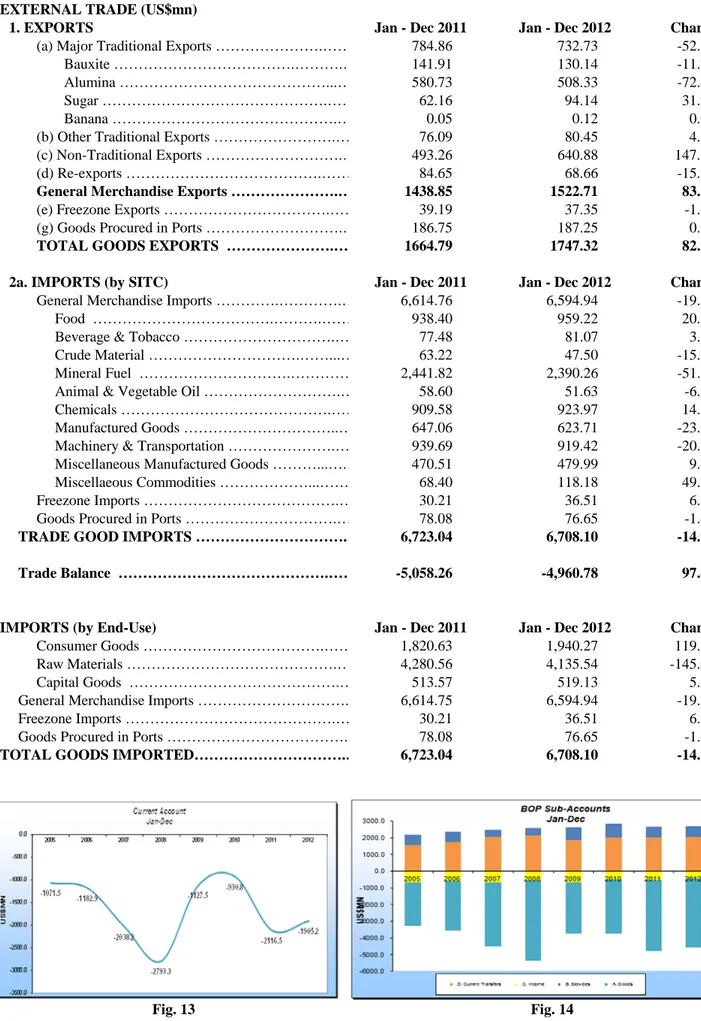
XIV. EXTERNAL TRADE (US$mn)
1. EXPORTS Jan - Dec 2011 Jan - Dec 2012 Change
(a) Major Traditional Exports ……….…… 784.86 732.73 -52.13
Bauxite ……….……….… 141.91 130.14 -11.78
Alumina ………...… 580.73 508.33 -72.40
Sugar ……….…… 62.16 94.14 31.97
Banana ……….… 0.05 0.12 0.07
(b) Other Traditional Exports ……….… 76.09 80.45 4.36 (c) Non-Traditional Exports ……….… 493.26 640.88 147.62
(d) Re-exports ……….…… 84.65 68.66 -15.99
General Merchandise Exports ……….… 1438.85 1522.71 83.86
(e) Freezone Exports ……….…… 39.19 37.35 -1.83
(g) Goods Procured in Ports ……….… 186.75 187.25 0.51
TOTAL GOODS EXPORTS ……….… 1664.79 1747.32 82.53
2a. IMPORTS (by SITC) Jan - Dec 2011 Jan - Dec 2012 Change
General Merchandise Imports ………….………….… 6,614.76 6,594.94 -19.81
Food ……….……….…… 938.40 959.22 20.82
Beverage & Tobacco ……….… 77.48 81.07 3.59
Crude Material ……….……...… 63.22 47.50 -15.72
Mineral Fuel ……….………… 2,441.82 2,390.26 -51.56
Animal & Vegetable Oil ……….… 58.60 51.63 -6.97
Chemicals ……….…… 909.58 923.97 14.38
Manufactured Goods ………..… 647.06 623.71 -23.35
Machinery & Transportation ……….… 939.69 919.42 -20.27 Miscellaneous Manufactured Goods ………...….… 470.51 479.99 9.47 Miscellaeous Commodities ………...…… 68.40 118.18 49.79
Freezone Imports ……….… 30.21 36.51 6.30
Goods Procured in Ports ……….… 78.08 76.65 -1.43
TRADE GOOD IMPORTS ……….… 6,723.04 6,708.10 -14.95
Trade Balance ……….…… -5,058.26 -4,960.78 97.48
IMPORTS (by End-Use) Jan - Dec 2011 Jan - Dec 2012 Change
Consumer Goods ……….…… 1,820.63 1,940.27 119.65
Raw Materials ……….… 4,280.56 4,135.54 -145.02
Capital Goods ……….… 513.57 519.13 5.57
General Merchandise Imports ………. 6,614.75 6,594.94 -19.81
Freezone Imports ……….… 30.21 36.51 6.30
Goods Procured in Ports ………. 78.08 76.65 -1.43
TOTAL GOODS IMPORTED……….… 6,723.04 6,708.10 -14.94
Fig. 13 Fig. 14
+ Revised 6
XV. BALANCE OF PAYMENTS (US$mn) Jan - Dec Jan - Dec Change
Balance of Payments (Calendar) 2011 2012
1. Current Account ……… -2,124.4 -1,905.3 219.1
A. Goods balance ………...…….... -4,257.6 -4,158.0 99.6 Exports (fob) ………... 1,664.8 1,746.7 81.9 Imports (fob) ………....….. 5,922.4 5,904.7 -17.7
B. Service Balance ……….…..…….. 661.9 638.8 -23.1
Transportation ……….… -576.1 -752.5 -176.4
Travel ……….………. 1,845.7 1,881.2 35.5
Other Services ……….…… -607.7 -489.9 117.8
C. Income ………...……… -518.4 -433.5 84.9
Compensation of Employees ……….……. 36.5 65.6 29.1
Investment Income ……….………. -554.9 -499.1 55.8
D. Current Transfers ………..……….. 1,989.7 2,047.4 57.7
Official ……….…… 141.3 172.3 31.0
Private ……….……. 1,848.4 1,875.1 26.7
2. Capital and Financial Account ……….……… 2,124.4 1,905.3 -219.1
A. Capital Account ………...….……….. -9.2 -26.2 -17.0
Capital Transfers ………..………. -9.2 -26.2 -17.0
General Govt………..…… 29.0 5.9 -23.1
Other Sectors ...……….………. -38.2 -32.1 6.1
Acq/Disp of non-produced non-fin assets ……..……….. 0.0 0.0 0.0
B. Financial Account ……….……….. 2,133.5 1931.5 -202.1 Other Investment ………...……… 497.9 238.6 -259.3 Other Private Investment (incl errors and omission) ……. 1,430.4 852.3 -578.1
Reserves ………. 205.2 840.5 635.3
Apr - Dec Apr - Dec
Balance of Payments (Fiscal) 2011/2012 2012/2013 Change
1. Current Account -1,796.5 -1,533.5 263.0
A. Goods balance ………..…... -3,286.0 -3,132.7 153.3 Exports (fob) ……….………….. 1,246.6 1,302.5 55.9 Imports (fob) ……….……….. 4,532.6 4,435.3 -97.3
B. Service Balance ………...……... 392.6 416.3 23.7
Transportation ……….…… -459.3 -583.0 -123.7
Travel ………..……. 1,292.0 1,310.0 18.0
Other Services ………..……… -440.1 -310.7 129.4
C. Income ……….………….. -408.5 -361.5 47.0
Compensation of Employees ………..……. 36.6 47.1 10.5
Investment Income ……….……. -445.1 -408.6 36.5
D. Current Transfers ………..….. 1,505.4 1,544.4 39.0
Official ……….………… 101.1 132.4 31.3
Private ……….……. 1,404.3 1,412.0 7.7
2. Capital and Financial Account ………..….. 1,796.5 1,533.5 -263.0
A. Capital Account ………...….. -3.6 -19.1 -15.5
Capital Transfers ……….……….. -3.6 -19.1 -15.5
General Govt. ……… 24.4 4.4 -20.0
Other Sectors ...……….……. -28.0 -23.5 4.5
Acq/Disp of non-produced non-fin assets ………..…….. 0.0 0.0 0.0
B. Financial Account ………..……….. 1,800.1 1,552.7 -247.4 Other Official Investment ……….. 23.1 6.0 -17.1 Other Private Investment (incl errors & omissions) ……. 1,190.0 895.1 -294.9
Reserves ………. 587.0 651.5 64.5
7
May-12 Apr-13 May-13 % change p.a.
XVI. BOJ NET INTERNATIONAL RESERVES (US$mn)
BOJ Net International Reserves (US$mn) ………...….… 1,718.75 866.18 988.86 -42.47 Gross Foreign Assets ………...…... 2,559.51 1,706.26 1,863.80 -27.18 Gross Foreign Liabilities ……….………...…..… 840.76 840.08 874.94 4.07 Estimated Gross Reserves in Weeks of Goods Imports ……….… 22.45 16.00 17.47
Estimated Gross Reserves in Weeks of Goods and Services Imports ……….. 16.95 12.08 13.20
XVII. FOREIGN EXCHANGE DEVELOPMENTS (US$mn) * Mar-12 Feb-13 Mar-13 % change p.a.
Combined Foreign Exchange Trading
Foreign Exchange Purchases (spot) ………..………...….. 1,004.37 596.60 673.45 -32.95 Foreign Exchange Sales (spot) ………..………... 998.68 594.85 614.88 -38.43
Foreign Currency Deposit Balances of Authorised Dealers (US$mn) Apr-12 Mar-13 Apr-13
% change p.a.
Commercial Banks Balances ………...……..….. 1,811.52 1,910.26 1,901.80 4.98 A Accounts 1/ ………...…..… 109.92 86.64 85.66 -22.07 B Accounts ………...………..… 0.16 0.19 0.19 18.13 Other ………...……. 1,701.44 1,823.43 1,815.95 6.73 FIAs Balance ………...………...…. 43.29 52.15 62.44 44.25 A Accounts 1/ ……….…...….. 16.76 16.42 16.57 -1.15
B Accounts ………...…... 0.00 0.00 0.00 -
Other ………....…… 26.53 35.72 45.88 72.94 Building Societies Balances ……….…...….. 559.36 564.38 572.10 2.28 A Accounts 1/ ………...……..… 255.76 248.94 255.05 -0.28 B Accounts ………...……...….. 64.51 60.55 60.15 -6.77 Other ……….……….. 239.09 254.89 256.90 7.45 Total Foreign Currency Deposits (US$mn) ……… 2,414.16 2,526.78 2,536.34 5.06 Total Foreign Currency Loans (US$mn) ……… 1,360.01 1,188.54 1,191.08 -12.42 Commercial Banks ……….. 1,247.24 1,097.56 1,101.01 -11.72 FIAs ………...……..….. 29.38 12.96 13.04 -55.62 Building Societies ………..……….. 83.40 78.01 77.03 -7.64 London Interbank Offer Rate (LIBOR) Eurodollars (%) May-12 Apr-13 May-13
3 months ………..…………..….. 0.59 0.12 0.12 6 months ……….………...….. 0.90 0.21 0.20 Selling Exchange Rates (end period) May-12 Apr-13 May-13 US$100 = J$ ……….…….……... 88.12 99.35 99.45 Can $100 = J$ ………..…..…….. 85.55 99.60 96.48 UK Pound = J$ ………..……….……….. 136.09 154.02 151.29 Euro = J$*……….…….….….. 109.13 130.17 129.68
Caricom Selling Exchange Rates* May-12 Apr-13 May-13
TT $1 = J$ ……….……….….. 13.73 15.52 15.49 Bdos $1 = J$ ……….………..…….. 44.03 49.68 49.67 Guy $1 = J$………...………..……….. 0.44 0.49 0.49 EC $1 = J$ ………..…...………….. 32.62 36.80 36.79
* Indicative Rates 8