Estimating of internal radiation doses due to food consumption and
its reduction applying the food regulation after the Fukushima
nuclear accident using national food-monitoring data
YAMAGUCHI Ichiro
1), TAKAHASHI Hideto
2)1) Department Environmental Health, National institute of Public Health 2) Research Managing Director, National institute of Public Health
Abstract
Objectives: The study examined the public health policies implemented after the Fukushima nuclear ac-cident using the monitoring data on food.
Methods: The amount of radioactive material ingested was determined and converted into doses using the Japan National Health and Nutrition Survey and food radioactive concentration monitoring data sampled by each prefecture in June of each year between 2011 and 2019. The study also examined the effects of pub-lic health popub-licies on the basis of the differences between (1) calculation using all food monitoring data in the absence of interventions and (2) application of the restriction.
Results: In June 2011, the median committed effective dose for adult males was estimated at 18.3 µSv (with regulation) in Fukushima Prefecture. The effect of food restriction was 42.2% for the population for intaking foods with median radiation dose (the median population) in Fukushima in 2011.
Conclusion: The effect of food restriction was 42.2% for the median population in Fukushima in 2011, which points to the effectiveness of public health mitigations.
keywords: internal radiation doses, food consumption, food regulation, Fukushima nuclear accident, national food-monitoring data
(accepted for publication, January 26, 2021)
< Original >
Corresponding author: YAMAGUCHI Ichiro 2-3-6 Minami, Wako, Saitama 351-0197, Japan. TEL: +81-48-458-6259
FAX: +81-48-458-6270 E-mail:[email protected]
I. Background
Protective measures against radiation that aim to ensure the safety of food and drinking water are critical against di-sasters that lead to environmental contamination[1].
Previous nuclear disasters, such as the Chernobyl nu-clear power plant accident, resulted in dire health conse-quences such as thyroid cancer due to exposure to radiation especially due to food consumption of affected milk without countermeasures [2] . In this case, high doses of radiation were absorbed mainly through ingestion[3].
Previous studies analyzed the monitoring data of ra-dioactive materials in food in Japan before and after the Fukushima accident and confirmed that the concentration of radioactive materials in food has increased due to the accident[4]. Whole-body counting (WBC) measurements in
Fukushima Prefecture demonstrated that 26 out of 344,762 (0.008 %) residents were exposed to >1 mSv as commit-ted effective doses due to annual foodstuff consumption between June 2011 and March 2020 [5]. This finding sug-gested that although the median dose was low, residents received prolonged and wide range of doses due to the To-kyo Electric Power Company (TEPCO) Fukushima Daiichi Nuclear Power Plant (FDNPP) accident, which occurred in 2011 reflecting the diversity of dietary habits that lead to the consumption of non-tradable products.
The Japanese government has taken measures in re-sponse to the nuclear accident. Specifically, each prefectural government implemented the monitoring of radioactive substances in food. The Nuclear Emergency Response Headquarters carried out the “establishment of items and areas for inspection plans, shipping restrictions, and other
measures” on April 4, 2011, which is revised on an annual basis [6]. The national guideline on sampling plan was es-tablished according to this principal document. Foodstuff samples were collected in accordance with the sampling plans of the local governments and measured using the test methods prescribed by the national government [7-9]. A comprehensive monitoring plan was formulated on August 2, 2011, which is also revised every year. Lastly, the gov-ernment collected data on the concentrations of radioactive substances in foodstuffs measured in each prefecture.
An important issue of the measures for radiation pro-tection regarding the actual implementation in society is socio-economic factors assuming an appropriately rep-resentative individual and considering the wide range of dose distribution among residents. Therefore, evaluating the regulations and taking the plan-do-check-act (PDCA) cycle into consideration are necessary [10-11]. Assessing the regulations requires the use of a broad range of data to acquire a holistic picture of the scenario. The concentration of radiation in food products varies across regions; thus, aggregating and refining data by region as well is crucial. In addition, carrying out the evaluation for a prolonged period is important as mentioned previously and the half-life of
137
Cs is 30 years.
The study examined the public health policies imple-mented after the nuclear accident using the monitoring data on radionuclide concentration in food to estimate radiation doses through ingestion. Moreover, the study aimed to examine the reduction of internal exposure as a result of the public health measures for health protection after the nuclear accident through shipping food restrictions.
II. Method
1. Database
Data on concentration of radioactive materials (Bq/kg) in food
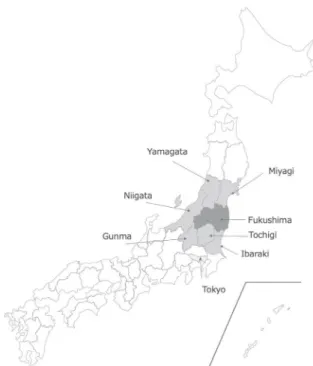
A total of 2,626,497 samples on the concentration of ra-dioactive materials (Bq/kg) in food have been collected from March 2011 to April 2020. Data from each prefecture were formally provided to the Ministry of Health, Labour and Welfare (MHLW). Internal radiation doses from ingestion of food were estimated by simulating food consumption in June of each year between 2011 and 2019 (n = 1,484,266) among each target population (i.e., residents in Fukushima Prefecture and six neighboring prefectures as indicated at Figure 1). Among them, Fukushima Prefecture was divided into three areas, namely, the central (Naka-doori), west (Aizu Region), and coastal (Hama-doori) regions as indicat-ed at Figure 2. The radionuclides targetindicat-ed were radioactive iodine 131 (131I), radioactive cesium 134 (134Cs), and
radioac-tive cesium 137 (137Cs). Data on radioactive strontium and
other radionuclides were not used because of the paucity of measurements of these radionuclides in food. It was as-sumed that 10 grams of tealeaves were used for 500 ml of tea in order to relate the measured concentration of radio-active substances in tea leaves to the amount of radioradio-active substances ingested by drinking tea and the concentration of rice was assumed to be 1/4 regarding polishing effect since the concentration of radioactive cesium in polished rice is about 10% lower than that in brown rice according to Research Center for Agricultural Information Technology.
2. Data on food intake (kg/month)
Data on food intake (g/day) of 99 food types as identified by the Japan National Health and Nutrition Survey (JNHNS) were collected every year. Apart from the 99 food types,
1 2
Figure 1 Targeted prefectures 3
Note: Tokyo is indicated as a reference. 4
5
Note: Tokyo is indicated as a reference.
Figure 1 Targeted prefectures
2 6
Figure 2 Three regions in Fukushima Prefecture 7
8
other food categories such as livestock, agricultural, and marine products, others, milk and infant food, wild meat, and drinking water were used to summarize data. Food intake amounts were selected randomly using log-normal distributions created by applying the mean and the standard deviation (both were published) for each food type of the data for males over 20 years of age. Here the dependence of this coefficient (DCing) on age is relatively small (food intake has a more direct effect on the dose).
3. Estimating the amount of radioactive materials through ingestion and conversion to radiation doses
Radioactive concentration (RCk) and monthly foodstuff
consumption in kg (MFCk) with a consideration of the
precise food category (k = 99) were used to determine the amount of monthly ingested radioactive material (Bq/ month) (MIR) (Formula (1)). MIR was then converted into monthly committed effective doses due to ingestion (Sv/ month) (CEDm,ing) using the internal radiation dose due to food consumption in Sv/Bq (DCing) taken from International Commission On Radiological Protection (ICRP) [12] (For-mula (2)). The variable DCing of 137Cs for an adult member of the public is 1.3 × 10−08 (Sv/Bq).
4. Estimating population doses
Radiation doses for every 10th percentile from the min-imum to the 90th percentile with incremental additions of 95th, 99th, 99.9th, and 99.99th percentiles were calculated and weighted together by population size to obtain the pop-ulation doses.
5. Assessing variation in estimated doses
The concentration (Bq/kg) and volume of foodstuff (kg/ month) were randomly sampled 100,000 times to estimates the median dose of the targeted population.
The uncertainty of the estimates was assessed by repeat-ing the calculation for 10 times.
6. Evaluating the effectiveness of public health poli-cies
The study examined the effects of public health policies on the basis of the differences between (1) calculation using all food monitoring data in the absence of interventions and (2) application of the restriction then conversion to mone-tary value assuming the value of a statistical life (VSL) [13].
7. Handling radioactivity measurement data below the detection limit
The percentage of samples below the detection limit for each food item in each prefecture was calculated on a monthly basis. If the percentage exceeds 60% of the total number of samples, then the concentration of each food item was replaced with a surrogate concentration, which was calculated by converting the detection limit and divid-ing by two. Otherwise, the detection limit concentration was used to determine food concentration.
We open our program code through the site of National Institute of Public Health (NIPH) (Appendix (https://www. niph.go.jp/journal/data/70-1/202170010010ap01.pdf)) and data is published monthly from MHLW [14] and database for analysis is open to the public from NIPH (URL: http:// www.radioactivity-db.info), respectively. All analyses were conducted using R 3.5.1 [15].
8. Disclosure of information on conflicts of interest
There is no conflict of interest to disclose in relation to submission of this manuscript.
9. Ethical consideration
All data were derived from secondary sources that are publicly accessible through the Internet. Thus, ethical ap-proval was not required based on the official guidelines in Japan.
10. Funding source
The study was funded by the National Institute of Public Health, Japan.
III. Results
1. Radioactive concentration of food items
Basic statistics for the concentration of radioactive sub-stances in food
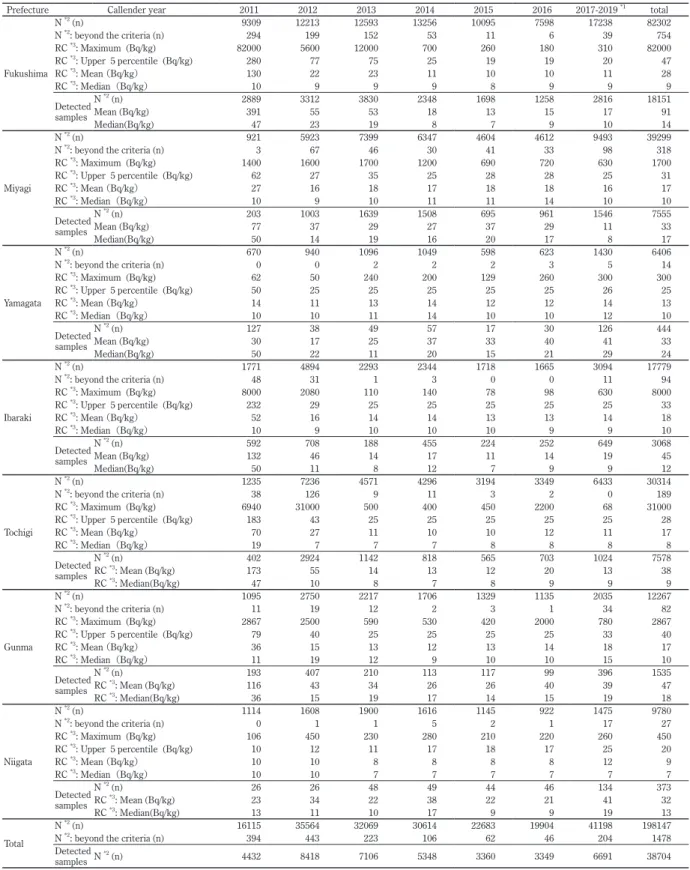
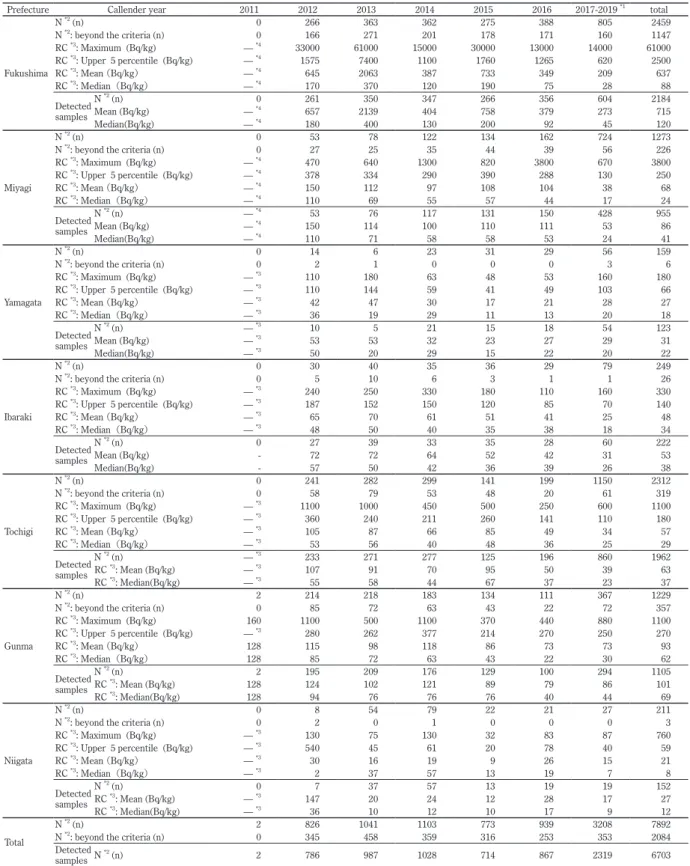
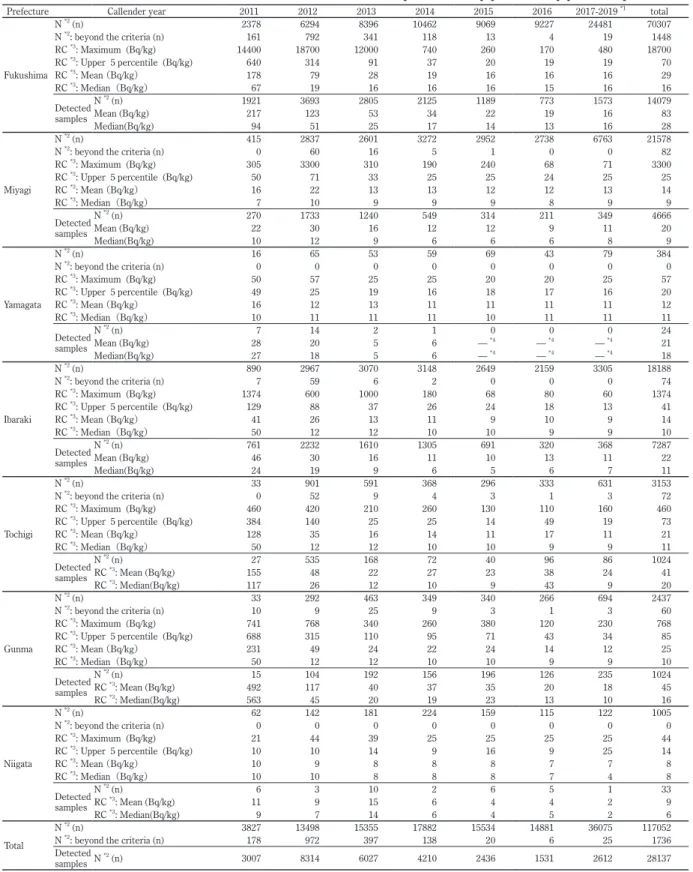
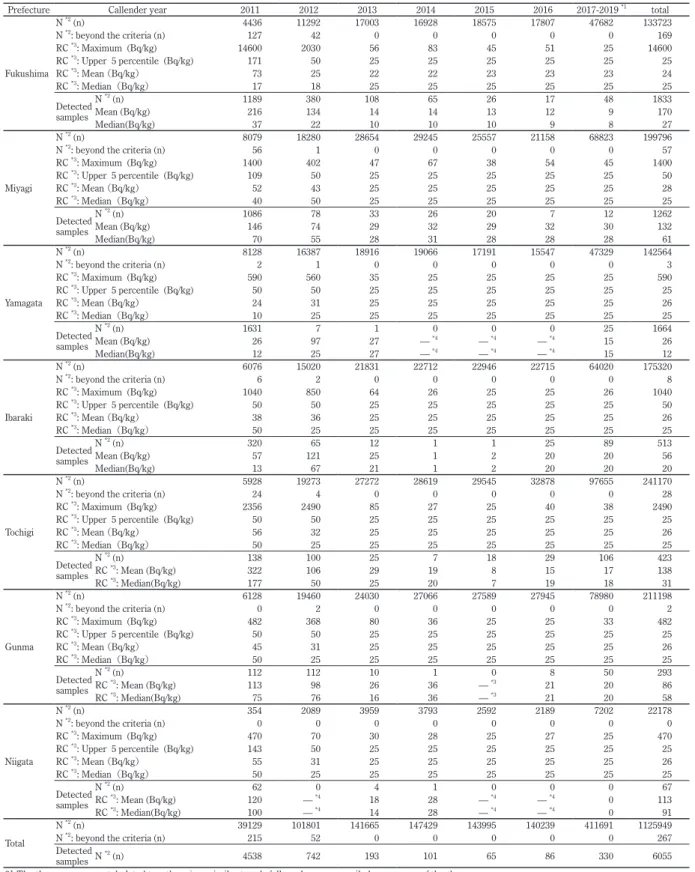
Table 1 (A)-(D) provides the number of samples and the maximum, upper 5th percentile, arithmetic mean, and me-dian of radioactive Cs concentrations in each food category, such as vegetables (A), wild meats (B), fishery products (C), and livestock products (D). Milk and Infant Foods, drinking water and others are omitted in these tables due to lower concentrations.
The largest number of cases was found for livestock meat, which accounted for 1,125,949 out of the 1,484,266 samples (75.8%) (Table 1(D). The ratio of livestock samples increased every year from 2011 to 2019. Out of the total 1,119,894 were below the detection limit (99.4%). Among all samples including other food categories, 1,401,345 did not exceed the detection limit (1,401,345/1,484,266 =
Table 1A Basic statistics of radiocesium concentration in food samples of vegetables by year and prefecture
Prefecture Callender year 2011 2012 2013 2014 2015 2016 2017-2019 *1 total
Fukushima
N *2 (n) 9309 12213 12593 13256 10095 7598 17238 82302
N *2: beyond the criteria (n) 294 199 152 53 11 6 39 754
RC *3: Maximum (Bq/kg) 82000 5600 12000 700 260 180 310 82000 RC *3: Upper 5 percentile (Bq/kg) 280 77 75 25 19 19 20 47 RC *3: Mean (Bq/kg) 130 22 23 11 10 10 11 28 RC *3: Median(Bq/kg) 10 9 9 9 8 9 9 9 Detected samples N *2 (n) 2889 3312 3830 2348 1698 1258 2816 18151 Mean (Bq/kg) 391 55 53 18 13 15 17 91 Median(Bq/kg) 47 23 19 8 7 9 10 14 Miyagi N *2 (n) 921 5923 7399 6347 4604 4612 9493 39299
N *2: beyond the criteria (n) 3 67 46 30 41 33 98 318
RC *3: Maximum (Bq/kg) 1400 1600 1700 1200 690 720 630 1700 RC *3: Upper 5 percentile (Bq/kg) 62 27 35 25 28 28 25 31 RC *3: Mean (Bq/kg) 27 16 18 17 18 18 16 17 RC *3: Median(Bq/kg) 10 9 10 11 11 14 10 10 Detected samples N *2 (n) 203 1003 1639 1508 695 961 1546 7555 Mean (Bq/kg) 77 37 29 27 37 29 11 33 Median(Bq/kg) 50 14 19 16 20 17 8 17 Yamagata N *2 (n) 670 940 1096 1049 598 623 1430 6406
N *2: beyond the criteria (n) 0 0 2 2 2 3 5 14
RC *3: Maximum (Bq/kg) 62 50 240 200 129 260 300 300 RC *3: Upper 5 percentile (Bq/kg) 50 25 25 25 25 25 26 25 RC *3: Mean (Bq/kg) 14 11 13 14 12 12 14 13 RC *3: Median(Bq/kg) 10 10 11 14 10 10 12 10 Detected samples N *2 (n) 127 38 49 57 17 30 126 444 Mean (Bq/kg) 30 17 25 37 33 40 41 33 Median(Bq/kg) 50 22 11 20 15 21 29 24 Ibaraki N *2 (n) 1771 4894 2293 2344 1718 1665 3094 17779
N *2: beyond the criteria (n) 48 31 1 3 0 0 11 94
RC *3: Maximum (Bq/kg) 8000 2080 110 140 78 98 630 8000 RC *3: Upper 5 percentile (Bq/kg) 232 29 25 25 25 25 25 33 RC *3: Mean (Bq/kg) 52 16 14 14 13 13 14 18 RC *3: Median(Bq/kg) 10 9 10 10 10 9 9 10 Detected samples N *2 (n) 592 708 188 455 224 252 649 3068 Mean (Bq/kg) 132 46 14 17 11 14 19 45 Median(Bq/kg) 50 11 8 12 7 9 9 12 Tochigi N *2 (n) 1235 7236 4571 4296 3194 3349 6433 30314
N *2: beyond the criteria (n) 38 126 9 11 3 2 0 189
RC *3: Maximum (Bq/kg) 6940 31000 500 400 450 2200 68 31000 RC *3: Upper 5 percentile (Bq/kg) 183 43 25 25 25 25 25 28 RC *3: Mean (Bq/kg) 70 27 11 10 10 12 11 17 RC *3: Median(Bq/kg) 19 7 7 7 8 8 8 8 Detected samples N *2 (n) 402 2924 1142 818 565 703 1024 7578 RC *3: Mean (Bq/kg) 173 55 14 13 12 20 13 38 RC *3: Median(Bq/kg) 47 10 8 7 8 9 9 9 Gunma N *2 (n) 1095 2750 2217 1706 1329 1135 2035 12267
N *2: beyond the criteria (n) 11 19 12 2 3 1 34 82
RC *3: Maximum (Bq/kg) 2867 2500 590 530 420 2000 780 2867 RC *3: Upper 5 percentile (Bq/kg) 79 40 25 25 25 25 33 40 RC *3: Mean (Bq/kg) 36 15 13 12 13 14 18 17 RC *3: Median(Bq/kg) 11 19 12 9 10 10 15 10 Detected samples N *2 (n) 193 407 210 113 117 99 396 1535 RC *3: Mean (Bq/kg) 116 43 34 26 26 40 39 47 RC *3: Median(Bq/kg) 36 15 19 17 14 15 19 18 Niigata N *2 (n) 1114 1608 1900 1616 1145 922 1475 9780
N *2: beyond the criteria (n) 0 1 1 5 2 1 17 27
RC *3: Maximum (Bq/kg) 106 450 230 280 210 220 260 450 RC *3: Upper 5 percentile (Bq/kg) 10 12 11 17 18 17 25 20 RC *3: Mean (Bq/kg) 10 10 8 8 8 8 12 9 RC *3: Median(Bq/kg) 10 10 7 7 7 7 7 7 Detected samples N *2 (n) 26 26 48 49 44 46 134 373 RC *3: Mean (Bq/kg) 23 34 22 38 22 21 41 32 RC *3: Median(Bq/kg) 13 11 10 17 9 9 19 13 Total N *2 (n) 16115 35564 32069 30614 22683 19904 41198 198147
N *2: beyond the criteria (n) 394 443 223 106 62 46 204 1478
Detected
samples N *2 (n) 4432 8418 7106 5348 3360 3349 6691 38704
*1 The three years were tabulated together since similar trends followed, so we compiled a summary of the three years. *2 Number of samples
*3 Radiocesium concentration
Data provided to Ministry of Health, Labour and Welfare (MHLW) by each prefecture were used for the analysis.
The monthly percentage of samples below the detection limit for each food item (number of items is 99) by prefecture was calculated, and if the percentage was more than 60%, the detection limit value divided by two was used; otherwise, the detection limit value was used for each sample.
Table 1B Basic statistics of radiocesium concentration in food samples of wild poultry and animal meats by year and prefecture
Prefecture Callender year 2011 2012 2013 2014 2015 2016 2017-2019 *1 total
Fukushima
N *2 (n) 0 266 363 362 275 388 805 2459
N *2: beyond the criteria (n) 0 166 271 201 178 171 160 1147
RC *3: Maximum (Bq/kg) — *4 33000 61000 15000 30000 13000 14000 61000 RC *3: Upper 5 percentile (Bq/kg) — *4 1575 7400 1100 1760 1265 620 2500 RC *3: Mean (Bq/kg) — *4 645 2063 387 733 349 209 637 RC *3: Median(Bq/kg) — *4 170 370 120 190 75 28 88 Detected samples N *2 (n) 0 261 350 347 266 356 604 2184 Mean (Bq/kg) — *4 657 2139 404 758 379 273 715 Median(Bq/kg) — *4 180 400 130 200 92 45 120 Miyagi N *2 (n) 0 53 78 122 134 162 724 1273
N *2: beyond the criteria (n) 0 27 25 35 44 39 56 226
RC *3: Maximum (Bq/kg) — *4 470 640 1300 820 3800 670 3800 RC *3: Upper 5 percentile (Bq/kg) — *4 378 334 290 390 288 130 250 RC *3: Mean (Bq/kg) — *4 150 112 97 108 104 38 68 RC *3: Median(Bq/kg) — *4 110 69 55 57 44 17 24 Detected samples N *2 (n) — *4 53 76 117 131 150 428 955 Mean (Bq/kg) — *4 150 114 100 110 111 53 86 Median(Bq/kg) — *4 110 71 58 58 53 24 41 Yamagata N *2 (n) 0 14 6 23 31 29 56 159
N *2: beyond the criteria (n) 0 2 1 0 0 0 3 6
RC *3: Maximum (Bq/kg) — *3 110 180 63 48 53 160 180 RC *3: Upper 5 percentile (Bq/kg) — *3 110 144 59 41 49 103 66 RC *3: Mean (Bq/kg) — *3 42 47 30 17 21 28 27 RC *3: Median(Bq/kg) — *3 36 19 29 11 13 20 18 Detected samples N *2 (n) — *3 10 5 21 15 18 54 123 Mean (Bq/kg) — *3 53 53 32 23 27 29 31 Median(Bq/kg) — *3 50 20 29 15 22 20 22 Ibaraki N *2 (n) 0 30 40 35 36 29 79 249
N *2: beyond the criteria (n) 0 5 10 6 3 1 1 26
RC *3: Maximum (Bq/kg) — *3 240 250 330 180 110 160 330 RC *3: Upper 5 percentile (Bq/kg) — *3 187 152 150 120 85 70 140 RC *3: Mean (Bq/kg) — *3 65 70 61 51 41 25 48 RC *3: Median(Bq/kg) — *3 48 50 40 35 38 18 34 Detected samples N *2 (n) 0 27 39 33 35 28 60 222 Mean (Bq/kg) - 72 72 64 52 42 31 53 Median(Bq/kg) - 57 50 42 36 39 26 38 Tochigi N *2 (n) 0 241 282 299 141 199 1150 2312
N *2: beyond the criteria (n) 0 58 79 53 48 20 61 319
RC *3: Maximum (Bq/kg) — *3 1100 1000 450 500 250 600 1100 RC *3: Upper 5 percentile (Bq/kg) — *3 360 240 211 260 141 110 180 RC *3: Mean (Bq/kg) — *3 105 87 66 85 49 34 57 RC *3: Median(Bq/kg) — *3 53 56 40 48 36 25 29 Detected samples N *2 (n) — *3 233 271 277 125 196 860 1962 RC *3: Mean (Bq/kg) — *3 107 91 70 95 50 39 63 RC *3: Median(Bq/kg) — *3 55 58 44 67 37 23 37 Gunma N *2 (n) 2 214 218 183 134 111 367 1229
N *2: beyond the criteria (n) 0 85 72 63 43 22 72 357
RC *3: Maximum (Bq/kg) 160 1100 500 1100 370 440 880 1100 RC *3: Upper 5 percentile (Bq/kg) — *3 280 262 377 214 270 250 270 RC *3: Mean (Bq/kg) 128 115 98 118 86 73 73 93 RC *3: Median(Bq/kg) 128 85 72 63 43 22 30 62 Detected samples N *2 (n) 2 195 209 176 129 100 294 1105 RC *3: Mean (Bq/kg) 128 124 102 121 89 79 86 101 RC *3: Median(Bq/kg) 128 94 76 76 76 40 44 69 Niigata N *2 (n) 0 8 54 79 22 21 27 211
N *2: beyond the criteria (n) 0 2 0 1 0 0 0 3
RC *3: Maximum (Bq/kg) — *3 130 75 130 32 83 87 760 RC *3: Upper 5 percentile (Bq/kg) — *3 540 45 61 20 78 40 59 RC *3: Mean (Bq/kg) — *3 30 16 19 9 26 15 21 RC *3: Median(Bq/kg) — *3 2 37 57 13 19 7 8 Detected samples N *2 (n) 0 7 37 57 13 19 19 152 RC *3: Mean (Bq/kg) — *3 147 20 24 12 28 17 27 RC *3: Median(Bq/kg) — *3 36 10 12 10 17 9 12 Total N *2 (n) 2 826 1041 1103 773 939 3208 7892
N *2: beyond the criteria (n) 0 345 458 359 316 253 353 2084
Detected
samples N *2 (n) 2 786 987 1028 714 867 2319 6703
*1 The three years were tabulated together since similar trends followed, so we compiled a summary of the three years. *2 Number of samples
*3 Radiocesium concentration *4 Not existence
Data provided to Ministry of Health, Labour and Welfare (MHLW) by each prefecture were used for the analysis.
The monthly percentage of samples below the detection limit for each food item (number of items is 99) by prefecture was calculated, and if the percentage was more than 60%, the detection limit value divided by two was used; otherwise, the detection limit value was used for each sample.
Table 1C Basic statistics of radiocesium concentration in food samples of fishery products by year and prefecture
Prefecture Callender year 2011 2012 2013 2014 2015 2016 2017-2019 *1 total
Fukushima
N *2 (n) 2378 6294 8396 10462 9069 9227 24481 70307
N *2: beyond the criteria (n) 161 792 341 118 13 4 19 1448
RC *3: Maximum (Bq/kg) 14400 18700 12000 740 260 170 480 18700 RC *3: Upper 5 percentile (Bq/kg) 640 314 91 37 20 19 19 70 RC *3: Mean (Bq/kg) 178 79 28 19 16 16 16 29 RC *3: Median(Bq/kg) 67 19 16 16 16 15 16 16 Detected samples N *2 (n) 1921 3693 2805 2125 1189 773 1573 14079 Mean (Bq/kg) 217 123 53 34 22 19 16 83 Median(Bq/kg) 94 51 25 17 14 13 16 28 Miyagi N *2 (n) 415 2837 2601 3272 2952 2738 6763 21578
N *2: beyond the criteria (n) 0 60 16 5 1 0 0 82
RC *3: Maximum (Bq/kg) 305 3300 310 190 240 68 71 3300 RC *3: Upper 5 percentile (Bq/kg) 50 71 33 25 25 24 25 25 RC *3: Mean (Bq/kg) 16 22 13 13 12 12 13 14 RC *3: Median(Bq/kg) 7 10 9 9 9 8 9 9 Detected samples N *2 (n) 270 1733 1240 549 314 211 349 4666 Mean (Bq/kg) 22 30 16 12 12 9 11 20 Median(Bq/kg) 10 12 9 6 6 6 8 9 Yamagata N *2 (n) 16 65 53 59 69 43 79 384
N *2: beyond the criteria (n) 0 0 0 0 0 0 0 0
RC *3: Maximum (Bq/kg) 50 57 25 25 20 20 25 57 RC *3: Upper 5 percentile (Bq/kg) 49 25 19 16 18 17 16 20 RC *3: Mean (Bq/kg) 16 12 13 11 11 11 11 12 RC *3: Median(Bq/kg) 10 11 11 11 10 11 11 11 Detected samples N *2 (n) 7 14 2 1 0 0 0 24 Mean (Bq/kg) 28 20 5 6 — *4 — *4 — *4 21 Median(Bq/kg) 27 18 5 6 — *4 — *4 — *4 18 Ibaraki N *2 (n) 890 2967 3070 3148 2649 2159 3305 18188
N *2: beyond the criteria (n) 7 59 6 2 0 0 0 74
RC *3: Maximum (Bq/kg) 1374 600 1000 180 68 80 60 1374 RC *3: Upper 5 percentile (Bq/kg) 129 88 37 26 24 18 13 41 RC *3: Mean (Bq/kg) 41 26 13 11 9 10 9 14 RC *3: Median(Bq/kg) 50 12 12 10 10 9 9 10 Detected samples N *2 (n) 761 2232 1610 1305 691 320 368 7287 Mean (Bq/kg) 46 30 16 11 10 13 11 22 Median(Bq/kg) 24 19 9 6 5 6 7 11 Tochigi N *2 (n) 33 901 591 368 296 333 631 3153
N *2: beyond the criteria (n) 0 52 9 4 3 1 3 72
RC *3: Maximum (Bq/kg) 460 420 210 260 130 110 160 460 RC *3: Upper 5 percentile (Bq/kg) 384 140 25 25 14 49 19 73 RC *3: Mean (Bq/kg) 128 35 16 14 11 17 11 21 RC *3: Median(Bq/kg) 50 12 12 10 10 9 9 11 Detected samples N *2 (n) 27 535 168 72 40 96 86 1024 RC *3: Mean (Bq/kg) 155 48 22 27 23 38 24 41 RC *3: Median(Bq/kg) 117 26 12 10 9 43 9 20 Gunma N *2 (n) 33 292 463 349 340 266 694 2437
N *2: beyond the criteria (n) 10 9 25 9 3 1 3 60
RC *3: Maximum (Bq/kg) 741 768 340 260 380 120 230 768 RC *3: Upper 5 percentile (Bq/kg) 688 315 110 95 71 43 34 85 RC *3: Mean (Bq/kg) 231 49 24 22 24 14 12 25 RC *3: Median(Bq/kg) 50 12 12 10 10 9 9 10 Detected samples N *2 (n) 15 104 192 156 196 126 235 1024 RC *3: Mean (Bq/kg) 492 117 40 37 35 20 18 45 RC *3: Median(Bq/kg) 563 45 20 19 23 13 10 16 Niigata N *2 (n) 62 142 181 224 159 115 122 1005
N *2: beyond the criteria (n) 0 0 0 0 0 0 0 0
RC *3: Maximum (Bq/kg) 21 44 39 25 25 25 25 44 RC *3: Upper 5 percentile (Bq/kg) 10 10 14 9 16 9 25 14 RC *3: Mean (Bq/kg) 10 9 8 8 8 7 7 8 RC *3: Median(Bq/kg) 10 10 8 8 8 7 4 8 Detected samples N *2 (n) 6 3 10 2 6 5 1 33 RC *3: Mean (Bq/kg) 11 9 15 6 4 4 2 9 RC *3: Median(Bq/kg) 9 7 14 6 4 5 2 6 Total N *2 (n) 3827 13498 15355 17882 15534 14881 36075 117052
N *2: beyond the criteria (n) 178 972 397 138 20 6 25 1736
Detected
samples N *2 (n) 3007 8314 6027 4210 2436 1531 2612 28137
*1 The three years were tabulated together since similar trends followed, so we compiled a summary of the three years. *2 Number of samples
*3 Radiocesium concentration *4 Not existence
Data provided to Ministry of Health, Labour and Welfare (MHLW) by each prefecture were used for the analysis.
The monthly percentage of samples below the detection limit for each food item (number of items is 99) by prefecture was calculated, and if the percentage was more than 60%, the detection limit value divided by two was used; otherwise, the detection limit value was used for each sample.
Table 1D Basic statistics of radiocesium concentration in food samples of livestock products by year and prefecture
Prefecture Callender year 2011 2012 2013 2014 2015 2016 2017-2019 *1 total
Fukushima
N *2 (n) 4436 11292 17003 16928 18575 17807 47682 133723
N *2: beyond the criteria (n) 127 42 0 0 0 0 0 169
RC *3: Maximum (Bq/kg) 14600 2030 56 83 45 51 25 14600 RC *3: Upper 5 percentile (Bq/kg) 171 50 25 25 25 25 25 25 RC *3: Mean (Bq/kg) 73 25 22 22 23 23 23 24 RC *3: Median(Bq/kg) 17 18 25 25 25 25 25 25 Detected samples N *2 (n) 1189 380 108 65 26 17 48 1833 Mean (Bq/kg) 216 134 14 14 13 12 9 170 Median(Bq/kg) 37 22 10 10 10 9 8 27 Miyagi N *2 (n) 8079 18280 28654 29245 25557 21158 68823 199796
N *2: beyond the criteria (n) 56 1 0 0 0 0 0 57
RC *3: Maximum (Bq/kg) 1400 402 47 67 38 54 45 1400 RC *3: Upper 5 percentile (Bq/kg) 109 50 25 25 25 25 25 50 RC *3: Mean (Bq/kg) 52 43 25 25 25 25 25 28 RC *3: Median(Bq/kg) 40 50 25 25 25 25 25 25 Detected samples N *2 (n) 1086 78 33 26 20 7 12 1262 Mean (Bq/kg) 146 74 29 32 29 32 30 132 Median(Bq/kg) 70 55 28 31 28 28 28 61 Yamagata N *2 (n) 8128 16387 18916 19066 17191 15547 47329 142564
N *2: beyond the criteria (n) 2 1 0 0 0 0 0 3
RC *3: Maximum (Bq/kg) 590 560 35 25 25 25 25 590 RC *3: Upper 5 percentile (Bq/kg) 50 50 25 25 25 25 25 25 RC *3: Mean (Bq/kg) 24 31 25 25 25 25 25 26 RC *3: Median(Bq/kg) 10 25 25 25 25 25 25 25 Detected samples N *2 (n) 1631 7 1 0 0 0 25 1664 Mean (Bq/kg) 26 97 27 — *4 — *4 — *4 15 26 Median(Bq/kg) 12 25 27 — *4 — *4 — *4 15 12 Ibaraki N *2 (n) 6076 15020 21831 22712 22946 22715 64020 175320
N *2: beyond the criteria (n) 6 2 0 0 0 0 0 8
RC *3: Maximum (Bq/kg) 1040 850 64 26 25 25 26 1040 RC *3: Upper 5 percentile (Bq/kg) 50 50 25 25 25 25 25 50 RC *3: Mean (Bq/kg) 38 36 25 25 25 25 25 26 RC *3: Median(Bq/kg) 50 25 25 25 25 25 25 25 Detected samples N *2 (n) 320 65 12 1 1 25 89 513 Mean (Bq/kg) 57 121 25 1 2 20 20 56 Median(Bq/kg) 13 67 21 1 2 20 20 20 Tochigi N *2 (n) 5928 19273 27272 28619 29545 32878 97655 241170
N *2: beyond the criteria (n) 24 4 0 0 0 0 0 28
RC *3: Maximum (Bq/kg) 2356 2490 85 27 25 40 38 2490 RC *3: Upper 5 percentile (Bq/kg) 50 50 25 25 25 25 25 25 RC *3: Mean (Bq/kg) 56 32 25 25 25 25 25 26 RC *3: Median(Bq/kg) 50 25 25 25 25 25 25 25 Detected samples N *2 (n) 138 100 25 7 18 29 106 423 RC *3: Mean (Bq/kg) 322 106 29 19 8 15 17 138 RC *3: Median(Bq/kg) 177 50 25 20 7 19 18 31 Gunma N *2 (n) 6128 19460 24030 27066 27589 27945 78980 211198
N *2: beyond the criteria (n) 0 2 0 0 0 0 0 2
RC *3: Maximum (Bq/kg) 482 368 80 36 25 25 33 482 RC *3: Upper 5 percentile (Bq/kg) 50 50 25 25 25 25 25 25 RC *3: Mean (Bq/kg) 45 31 25 25 25 25 25 26 RC *3: Median(Bq/kg) 50 25 25 25 25 25 25 25 Detected samples N *2 (n) 112 112 10 1 0 8 50 293 RC *3: Mean (Bq/kg) 113 98 26 36 — *3 21 20 86 RC *3: Median(Bq/kg) 75 76 16 36 — *3 21 20 58 Niigata N *2 (n) 354 2089 3959 3793 2592 2189 7202 22178
N *2: beyond the criteria (n) 0 0 0 0 0 0 0 0
RC *3: Maximum (Bq/kg) 470 70 30 28 25 27 25 470 RC *3: Upper 5 percentile (Bq/kg) 143 50 25 25 25 25 25 25 RC *3: Mean (Bq/kg) 55 31 25 25 25 25 25 26 RC *3: Median(Bq/kg) 50 25 25 25 25 25 25 25 Detected samples N *2 (n) 62 0 4 1 0 0 0 67 RC *3: Mean (Bq/kg) 120 — *4 18 28 — *4 — *4 0 113 RC *3: Median(Bq/kg) 100 — *4 14 28 — *4 — *4 0 91 Total N *2 (n) 39129 101801 141665 147429 143995 140239 411691 1125949
N *2: beyond the criteria (n) 215 52 0 0 0 0 0 267
Detected
samples N *2 (n) 4538 742 193 101 65 86 330 6055
*1 The three years were tabulated together since similar trends followed, so we compiled a summary of the three years.
*2 Number of samples *3 Radiocesium concentration *4 Not existence
Data provided to Ministry of Health, Labour and Welfare (MHLW) by each prefecture were used for the analysis.
The monthly percentage of samples below the detection limit for each food item (number of items is 99) by prefecture was calculated, and if the percentage was more than 60%, the detection limit value divided by two was used; otherwise, the detection limit value was used for each sample.
94.4%).
The percentage of samples above the regulatory limit was the highest (1.34%) in 2011, which dropped to 0.1% in 2019. According to food category, wild bird and animal meat obtained the highest percentage of exceeding the limit, with 2,084 of the 7,892 cases exceeding the standard (26.4%) (Table 1(B)). Annual changes in the percentage of vegeta-bles and wild bird and animal meat above the standard are shown in Figure 3 and Figure 4, respectively.
In general, the maximum and average concentrations decreased over time. In certain cases, however, the aver-age concentrations, such as those for Fukushima, Ibaraki, Gunma, and Niigata Prefectures for vegetables, Yamagata Prefecture for wild game, and Miyagi Prefecture for fish and shellfish, increased since 2017 (Figure.4).
For vegetables, an increase in the number of cases that exceeded the standard was observed in Gunma and Niigata Prefectures since 2016, whereas no downward trend was noted for Miyagi and Yamagata Prefectures (Table 1A).
For wild bird and animal meat, increases were observed in Yamagata and Gunma Prefectures since 2016, whereas the opposite is true for Tochigi Prefecture. In Miyagi Pre-fecture, a similar upward trend was observed since 2012 (Table 1B).
For fish and shellfish, an increase was found for Ibaraki Prefecture since 2016 (Table 1C). Moreover, deviations be-tween the medians and means were observed.
2. Dose estimation
In June 2011, the median committed effective dose for adult males was estimated at 18.3 µSv (without regulation: 31.6 µSv) in Fukushima Prefecture (Table 2). Doses gener-ally decreased with time since the accident. However, the estimated dose for 2011 was not the highest in Yamagata and Niigata Prefectures. The committed effective dose due to internal exposure by ingestion demonstrated regional
3 9
Figure 3 Annual change in the percentage of wild bird and animal meat 10
above the standard among each prefecture 11
12
4 13
Figure 4 Annual change in the percentage of vegetables above the 14
standard among each prefecture 15
Figure 3 Annual change in the percentage of wild bird and animal meat above the standard among each prefecture
Figure 4 Annual change in the percentage of vegetables above the standard among each prefecture
Table 2 Commited effective dose for adult males in Fukushima prefecture and neighbouhood prefectures in June of each year
Radiation dose Median among population Prefecture year
Without
restriction sd restrictionWith sd
Effect of restriction (*) [µSv] [µSv] [µSv] [µSv] a b (b-a)/a Fukushima 2011 31.6 0.083 18.3 0.018 -42.2% 2012 3.9 0.004 3.7 0.004 -6.9% 2013 6.4 0.011 6.0 0.007 -6.7% 2014 5.3 0.008 5.2 0.009 -1.9% 2015 1.8 0.002 1.8 0.003 -0.1% 2016 2.4 0.003 2.4 0.003 -0.3% Miyagi 2011 5.5 0.010 5.5 0.016 -0.1% 2012 2.6 0.004 2.5 0.005 -6.3% 2013 3.2 0.004 3.1 0.004 -3.0% 2014 1.6 0.002 1.6 0.002 -0.0% 2015 1.9 0.002 1.9 0.002 -1.3% 2016 2.0 0.004 1.9 0.002 -1.5% Yamagata 2011 1.3 0.001 1.3 0.001 -0.0% 2012 1.1 0.002 1.1 0.002 -0.0% 2013 1.1 0.002 1.1 0.002 -0.0% 2014 1.0 0.002 1.0 0.002 -0.0% 2015 1.0 0.002 1.0 0.002 0.0% 2016 0.8 0.002 0.8 0.001 0.0% Ibaraki 2011 6.9 0.009 6.9 0.013 0.1% 2012 2.8 0.005 2.8 0.004 -0.8% 2013 2.3 0.004 2.3 0.004 -0.1% 2014 2.5 0.002 2.5 0.003 -0.0% 2015 2.0 0.002 2.0 0.002 0.0% 2016 2.1 0.004 2.1 0.003 -0.2% Tochigi 2011 3.7 0.007 3.7 0.007 0.2% 2012 2.6 0.004 2.5 0.004 -4.6% 2013 1.9 0.004 1.8 0.003 -3.9% 2014 1.9 0.002 1.8 0.002 -0.8% 2015 1.6 0.002 1.6 0.003 -1.0% 2016 1.5 0.002 1.5 0.002 -0.9% Gunma 2011 4.4 0.009 4.4 0.015 0.0% 2012 2.3 0.004 2.2 0.005 -1.6% 2013 2.4 0.007 2.2 0.005 -6.0% 2014 1.8 0.002 1.8 0.002 -0.0% 2015 1.8 0.002 1.8 0.003 0.0% 2016 1.8 0.003 1.8 0.003 -0.4% Niigata 2011 1.4 0.001 1.4 0.001 -0.0% 2012 2.2 0.004 2.2 0.004 -0.1% 2013 1.3 0.002 1.3 0.002 0.0% 2014 1.2 0.002 1.2 0.002 -0.0% 2015 1.0 0.001 1.0 0.001 -0.0% 2016 1.1 0.002 1.1 0.002 -0.0% (*) The impact of the regulation was defined as the difference between real-life dose tions using only food concentrations below the reference value and unrealistic dose calcula-tions using all food concentracalcula-tions.
Dose distributions were calculated for each region using the concentrations of radiocesium in 99 different food items by year.
Consumed food amounts were established using the annual National Health and Nutrition Survey for the 99 food items.
The distribution of doses in each area was determined by repeated resampling 100,000 times. This calculation was carried out for 10 trials and the average value was obtained. The monthly percentage of samples below the detection limit for each food item (number of items is 99) by prefecture was calculated, and if the percentage was more than 60%, the detection limit value divided by two was used; otherwise, the detection limit value was used for each sample.
differences even in Fukushima Prefecture.
High concentrations of radioactive materials have been detected in food even after 2017, but the attribution to dose was limited. Even at the 99.99th percentile in Fukushima Prefecture for 2018, the dose reduction effect reached only 46%.
3. Effects of regulation on radiation safety of food after the nuclear accident
In June 2011, a median of committed effective dose among adult males in Fukushima Prefecture was estimat-ed at 18.3 µSv (without regulation: 31.6 µSv) (Table 2). In 2018, no reduction was observed at the median, where the 99.99th percentile values reached 67 µ Sv with a reduction of only 26%. In the case of the coastal region, 40% of the collective dose consisted of the upper 10% of residents.
Cardis used the concept of collective dose to estimate population risk11).
Additional risk from accidents due to the consumption of marine products from an international perspective was compared to the existing risk from natural radioactive
ma-terials [16]. During 2011 to 2019, the total collective dose reduction among Fukushima Prefecture was 23.9 man·Sv for every June (Table 3). Assuming a VSL of 600,000 US dollar per 1 man·Sv [13], savings due to the radiation pro-tection measures for food safety was estimated at 14 million US dollars.
IV. Discussion
Estimation of committed effective dose from ingestion of radioactive materials due to the TEPCO FDNPP accident
The median dose was estimated at 0.29 mSv among the central part of Fukushima Prefecture during 2011 to 2019.
The dose estimates obtained by the study were less than those of studies conducted after the Chernobyl accident be-cause such studies reported that 57% of subjects obtained an annual committed effective dose of 0.1 mSv or more even 23 years after the accident not showing a monoto-nous decrease[17]. The difference depends on the amount of radioactive material reaching the soil per unit area, the initial shipment limit, and the soil-to-plant transfer factor
Table 3 Commited effective dose for adult males at three regions in Fukushima prefecture in June of each year
Radiation dose Median among population Population dose
Area Year
Without
restriction sd restrictionWith sd
Effect of restriction
(*)
Without
restriction restrictionWith Averteddose sd Saved livesValue of [µSv] [µSv] [µSv] [µSv] [man·Sv] [man·Sv] [man·Sv] [man·Sv]
a b (b-a)/a a b a-b Central region 2011 7.7 0.025 4.6 0.015 -40.6% 15.2 9.3 5.88 0.06 $3.53M Naka-doori 2012 2.5 0.005 2.3 0.004 -9.3% 4.8 3.6 1.22 0.02 $0.73M 2013 5.6 0.015 5.0 0.011 -11.1% 8.2 6.3 1.82 0.04 $1.09M 2014 4.6 0.006 4.4 0.006 -4.5% 5.9 5.5 0.33 0.02 $0.20M 2015 1.5 0.002 1.5 0.003 -1.0% 3.1 3.1 0.02 0.02 $0.01M 2016 4.0 0.007 4.0 0.005 -0.5% 5.0 4.9 0.04 0.02 $0.02M 2017 1.6 0.002 1.6 0.002 0.4% 2.2 2.1 0.01 0.01 $0.01M 2018 2.5 0.001 2.4 0.002 3.0% 3.4 3.1 0.22 0.01 $0.13M 2019 2.6 0.004 2.6 0.004 0.0% 3.2 3.2 0.00 0.01 $0.00M East region 2011 1.8 0.003 1.8 0.003 -1.3% 2.7 2.6 0.09 0.01 $0.05M Aizu Region 2012 2.0 0.003 2.0 0.003 -0.4% 2.9 2.9 0.02 0.01 $0.01M 2013 2.8 0.004 2.7 0.004 -1.1% 3.5 3.4 0.08 0.02 $0.05M 2014 1.7 0.002 1.7 0.002 -1.1% 2.2 2.1 0.12 0.01 $0.07M 2015 1.5 0.002 1.5 0.002 0.0% 1.9 1.9 0.00 0.01 $0.00M 2016 1.6 0.002 1.6 0.002 -0.0% 2.1 2.1 0.00 0.01 $0.00M 2017 1.6 0.002 1.6 0.002 0.0% 2.1 2.1 0.00 0.01 $0.00M 2018 2.2 0.003 2.1 0.003 3.5% 3.0 2.8 0.27 0.01 $0.16M 2019 1.9 0.002 1.9 0.002 -0.0% 2.3 2.3 0.00 0.01 $0.00M Coastal region 2011 12.0 0.045 2.8 0.045 -76.9% 26.3 5.1 21.21 0.11 $12.72M Hama-doori 2012 1.7 0.004 1.6 0.004 -5.7% 3.0 2.5 0.44 0.01 $0.26M 2013 3.3 0.008 3.0 0.008 -9.8% 6.4 3.8 2.62 0.03 $1.57M 2014 3.9 0.005 3.9 0.005 -1.5% 5.0 4.9 0.11 0.02 $0.07M 2015 3.5 0.007 3.5 0.007 0.0% 4.4 4.4 0.00 0.03 $0.00M 2016 0.6 0.001 0.6 0.001 -2.3% 0.9 0.8 0.07 0.00 $0.04M 2017 0.6 0.001 0.6 0.001 0.0% 0.8 0.8 0.00 0.00 $0.00M 2018 1.0 0.001 1.0 0.001 0.0% 1.2 1.2 0.00 0.01 $0.00M 2019 1.0 0.001 1.0 0.001 -0.0% 1.2 1.2 0.00 0.01 $0.00M
(*) The impact of the regulation was defined as the difference between real-life dose calculations using only food concentrations below the reference value and unrealis-tic dose calculations using all food concentrations.
Dose distributions were calculated for each region using the concentrations of radiocesium in 99 different food items by year. Consumed food amounts were established using the annual National Health and Nutrition Survey for the 99 food items.
The distribution of doses in each area was determined by repeated resampling 100,000 times. This calculation was carried out for 10 trials and the average value was obtained.
The monthly percentage of samples below the detection limit for each food item (number of items is 99) by prefecture was calculated, and if the percentage was more than 60%, the detection limit value divided by two was used; otherwise, the detection limit value was used for each sample.
[18]. The obtained median results were consistent with the estimation presented in a report of the United Nations Scientific Committee on the Effects of Atomic Radiation (UNSCEAR) for 2013. The estimation was presented as the “25% local, standard result” model, which indicated 0.06 and 0.14 mSv for the first year and 10 years after the acci-dent, respectively. In addition, the“100% local, but allowing for imports” model indicated 0.20 and 0.50 mSv for the first year and 10 years after the accident, respectively[19], be-cause the estimated median dose for 2011 to 2019 was 0.29 mSv. Furthermore, the results nearly slightly exceeded a previously estimated dose, such as “The committed effec-tive dose ranged from 0.01–0.06 and 0.01–0.02 mSv in the first and second screening, respectively,” using the WBC measurement in 2013 [20] because the estimated median dose was 0.07 mSv in the central part of Fukushima Prefec-ture. Such results were also consistent with studies using the duplicate diet methods conducted in 2012, which did not exceed 0.1 mSv[21].
Nuclear disasters render the public prone to radiation exposure, which is divided into internal and external expo-sure. External exposure can be assessed using dosimeters, whereas internal exposure is difficult to estimate. Internal exposure is derived from inhalation and oral intake. Of these routes, inhalation dose can be roughly estimated by the location of residence, whereas oral intake can be esti-mated through drinking water and food. Estimating internal dose from food consumption is complicated because it re-flects the diversity of behaviors toward food consumption, especially in Japan, due to the flourishing food distribution. The contribution of food intake to radiation dose is greater in groups with high doses. Therefore, understanding the ac-tual situation in terms of radiation protection is important.
The methods for estimating internal exposure include external counting, such as WBC and bioassays for human measurements, as well as food-targeted methods, such as the market basket methods and duplicate diet methods, which are conducted on a large scale. However, sampling bias is possible[22]. Among these methods, WBC was implemented in the early phase for a limited number of persons[23]. It is widely used in Fukushima and maintained a high degree of representativeness within a limited area, thus promoting research[24].
To obtain a holistic picture of radiation exposure from food consumption, the study estimated radiation dose dis-tribution from ingestion of radioactive materials due to the TEPCO FDNPP accident by analyzing the food monitoring database for Fukushima Prefecture and six neighboring pre-fectures from 2011 to 2019.
The study infers that much of the initial internal dose may have been derived from inhalation exposure and
drink-ing water because measures were taken immediately and normal food distribution was disrupted after the earthquake [25]. Doses from food can be controllable given appropriate information dissemination. However, some residents did not comply with the evacuation protocols. In addition, di-versity was observed in behavior toward food consumption. These aspects suggested possible exceptions to the rule. However, the estimated median doses were in close agree-ment with the previous estimates of the WHO [19,26] and other studies [21,24,27-28].
The current study did not consider the contribution of other radionuclides apart from 131I, 134Cs, and 137Cs. In establishing the reference values, the study assumed that the contribution of radiocesium was approximately 10%. For marine products, this value was assumed at 50%. Impor-tantly, however, previous studies have verified these values to be on the safe side [29].
The results of the JNHNS contained sampling bias. In addition, food intake may vary with the seasons due to the limitations of the sample size. However, the JNHNS exclud-ed this factor from analysis.
1. Assessment of collective committed effective dose
The additional collective dose due to ingestion was 853 man·Sv for a population of 2 million (2011) in Fukushima during 2012 to 2019, thus accomplishing a dose reduction of 89 man·Sv. A conservative estimation was compared to the UNSCEAR 2013 report, which indicated that the additional collective dose due to ingestion was 3.5 man·kSv for a pop-ulation of 128 million (2010) in Japan during 2012 to 2020 [19].
Dose from oral intake was the dominant component in high-dose populations, thus giving a dose larger than that estimated by UNSCEAR. However, when taken on an indi-vidual basis, the dose was negligible for the majority of the population.
Therefore, the current measures should be updated to reflect the dose estimation and estimated effect of public health measures given an appropriate representative person in terms of radiation protection to adapt to changing situa-tions.
2. Effect of public health mitigation
The efficiency of protective measures on food radiation safety during June 2011 was assessed at 42.2% for the median dose among Fukushima. The reduction of internal exposure due to ingestion of affected foodstuff was evaluat-ed by assuming food restriction and utilizing the monitoring data of radionuclide concentration in food.
In Fukushima Prefecture, public health measures ef-fectively reduced radiation doses in the early years. Such
a dose reduction was particularly effective for high-dose populations. However, this effect worsened over time. Out-side Fukushima Prefecture, the effect was poor even during 2011.
Differences in effectiveness were noted between “tim-ing,” “region,” and “distribution within a population” in the evaluation of public health measures. The effect was great-est in the first year in Fukushima Prefecture, which was greater in the high-dose groups. Furthermore, regional dif-ferences were observed even within Fukushima Prefecture. Of the three regions in Fukushima Prefecture, the largest effect in the first year was seen in Hamadori, followed by Nakadori. In the high-dose cohort, specific food categories contributed to the dose.
Moreover, the effectiveness of the countermeasures em-ployed in Fukushima Prefecture decreased over time. After 2014, the 99.99th percentile value of the annual oral intake of committed effective doses have fallen below 1 mSv even in the northern part of the prefecture. In addition, the 2018 regulatory reduction in the 99.99th percentile was greatest in the northern part of the prefecture. However, the size of effectiveness reached only 63%.
One of the major contributors to radiation doses from ra-dionuclides emitted from the nuclear facilities is oral inges-tion [19]. Thus, public health mitigainges-tions have been taken to successfully reduce the dose to residents.
Conversely, the values for cost per life-year saved should be considered because it was estimated at 6.6–8.0 million yen and 23–51 million yen for vegetables in March and April in 2011, respectively, reflecting the decline in concentra-tions in a short period of time, even immediately after the accident [30] . Therefore, based on the results of 9 years of monitoring, the measurement of all cattle and rice samples is expected to be streamlined in the future.
3. Concentration of radioactive substances in food
The concentrations of radioactive substances in foodstuff in each prefecture were generally consistent with the fall-out. The amount of 137Cs for March 2011 was nearly within
10 kBq/m2 to 3 MBq/m2 except for sites near to and far from
the damaged power plant, which was estimated at 1.2 Bq/m2
(Niigata) to 17 kBq/m2 (Ibaraki) during the same period [31].
The concentrations of radioactive substances in foodstuff tended to decrease over time. However, the percentage of cases that exceeded the concentration standards for several wild vegetables continued to increase for several prefec-tures. Previous studies reported a new restriction on wild plants, such as that for Nagano Prefecture (however, it is not adjacent to Fukushima Prefecture) as of June 18, 2020 even 9 years after the accident. The reason for the delay in the introduction of shipping restrictions on these foods is
that the level of priority for sampling these foodstuffs is low, which reflects the market size of seasonal local foodstuff and small amount of consumption.
The accident at Fukushima was characterized by a sub-stantial emission of radioactive materials to the ocean because the nuclear power plant is located on the coast. In fact, the spillage of radioactive materials continues into the sea through rivers. However, concentrations of radioactive materials in fish were generally low except for fish harvest-ed very close to the accident site or other species of fresh-water fish.
4. Impact of past fallouts
Although data on shipment restrictions were exclud-ed from the study, such restrictions were observexclud-ed (i.e., mushrooms in Aomori and Yamanashi Prefectures), which indicate the impact of past fallouts including the Chernobyl accident.
5. Necessity of long-term monitoring
Long-term monitoring of wild meat, especially wild game, is necessary considering the half-life of 137Cs [32].
However, the intake weight of this group of food is low, and radiation doses that can be obtained from them are limited. Differences in the distribution pattern of food concentration were also observed among municipalities. This scenario may reflect differences in sampling methods. However, risk for consumers was adequately controlled due to concentra-tion distribuconcentra-tion.
6. Significance of the study
Responses to the Fukushima nuclear accident are under-way. In the aftermath of the Chernobyl nuclear power plant accident, each member state implemented the PDCA mech-anisms of safety countermeasures for food radiation to seek optimization given international coordination [11].
7. Characteristics of data used
Sampling is conducted in accordance with the latest plan at each time point, and the sampling method is intended to minimize the risk of missing excess samples. Therefore, sample selection bias, such as the selection of the target food item, is considered to have influenced the dose esti-mates.
The highest number of samples was found in beef, but the concentrations decreased over time, and most of them were below the detection limit. The mean values detected were lower than the mean of the total samples. The trend was similar to that of a previous study [33]. According to the revised sampling plan, the sample size for beef will be decreased dramatically after 2020.