A Doctoral Thesis
Presented to
Interdisciplinary Graduate School of Medicine and Engineering
University of Yamanashi
March 2016
Yuji Chino
Research and Development of Pt Catalysts Supported on
Tin-based Oxides with High Performance and Durability for
General introduction
1-1 Background 1
1-1-1 Polymer electrolyte fuel cells 2 1-1-2 Role and issue of catalyst support materials in cathode catalyst layers 5 1-1-3 Review of conductive ceramics support research 8
1-2 Research objective 12
1-3 Reference 14
Chapter 2
Investigation for electrochemical stability of Pt/Sb-SnO
2and Pt/Nb-SnO
2in both half-cell study and single cell study
2-1 Introduction 17
2-2 Experimental 17
2-2-1 Synthesis and characterization of Pt/Nb-SnO2 and Pt/Sb-SnO2 18
2-2-2 Electrochemical measurements by use of rotating disk electrode. 20 2-2-3 Electrochemical measurements in single cell. 21 2-3 Results and Discussion 23 2-3-1 Catalytic activity for oxygen reduction reaction 23 2-3-2 Electrochemical stability in half-cell 29 2-3-3 Electrochemical stability in single-cell 35 2-3-4 Effect of lower limit potential on single-cell performance 37
2-4 Conclusions 42
3-1 Introduction 44
3-2 Experimental 45
3-2-1 Synthesis and characterization of Pt/Nb-SnO2 45
3-2-2 Preparation of MEAs 45 3-2-3 Fuel cell operating conditions 47 3-2-4 Durability evaluation simulating the start/stop operation of the PEFC 48 3-3 Results and Discussion 50 3-3-1 Characterization of cathode catalyst layer 50 3-3-2 Humidity dependence of single cell performance using Pt/Nb-SnO2 cathodes 52
3-3-3 Effect of the addition of GCB on the cell performance 56 3-3-4 Durability of Pt/Nb-SnO2 with/without GCB at high cathode potentials 61
3-4 Conclusions 68
3-5 Reference 69
Chapter 4
Influence of Pt-loading, cathode atmosphere and cell potential on
electron-conducting path in Pt/Nb-SnO
2cathode
4-1 Introduction 70
4-2 Experimental 71
4-2-1 Synthesis and characterization of Pt/Nb-SnO2 catalysts 71
4-2-2 Preparation of .MEAs 71 4-2-3 Fuel cell operating conditions 73 4-3 Results and Discussion 75 4-3-1 Characterization of cathode CL and impedance measurements 75 4-3-2 Influence of Pt loading on Nb-SnO2.and atmosphere on cell ohmic resistance 79
4-3-3 Correlation between apparent ohmic resistance and Pt oxidation 84 4-3-4 Effect of GCB addition on the ohmic resistance 90
4-4 Conclusions 93
5-2 Future prospects 99 5-3 Reference 103 List of publications 104 Meeting abstracts 105 Awards 108 Acknowledgements 109
1
Chapter 1
General introduction
1-1 Background
The depletion of natural resources, such as fossil fuel, is one of the most severe problems on a global basis. The environmental problems, such as global warming, which were associated with large consumption of the fossil fuel, have lately attracted considerable attention. The rapid growth of population, as well as that of economy, magnified and spread these problems. Moreover, the growth is expected to continue over the next few decades. In the Intergovernmental Panel on Climate Change fifth Assessment Report (IPCC AR5), it was reported that substantial emission reduction over the next few decades can suppress climate risks in 21 century and contribute to climate-resilient pathways for sustainable developments [1]. Therefor renewable energies, such as solar, wind and geothermal power generation could be required in the near future. In addition, energy storage systems and energy carriers will be needed to solve the localization and the instability of the renewable energies. The utilization of hydrogen gas and hydrogen carriers (like hydrogen hydride and ammonia) have attracted from the point of view of the high energy density [2,3], various production methods related with the renewable energy and combination fuel cell systems [4]. Japanese government had promoted the utilization of hydrogen resource as alternatives, so called hydrogen use society [3].
Fuel cells (FCs) are power generation devices which are able to directly produce electric power by means of the electrochemical reaction of oxygen and fuels (like hydrogen and methanol) with high efficiency. In the case of use of hydrogen as fuel, water
2
is the only product for emission as shown in Eq. 1, thus FCs are essentially a ‘Zero-emission’ device.
H2 + 1/2 O2 → H2O with ΔG0 = -237 kJ mol-1 (E0 = 1.23 V)
1-1-1 Polymer electrolyte fuel cells
Polymer electrolyte fuel cells (PEFCs) had been investigated for the various applications, such as the portable devices, the stationary power supply systems and the automobile power systems, because of the high power density and low emission at relatively low operating temperatures (60-120 oC) compared with the other types of FCs [4].
Schematic model of PEFCs and chemical reactions were described in Fig. 1-1(a). PEFCs were composed with the anode and cathode on both sides of the polymer electrolyte membrane (PEM), where hydrogen and oxygen are supplied, respectively. On the anode catalyst, hydrogen is changed to protons and electrons. The proton move to cathode though hydrophilic clusters in PEM. The electrons reach the cathode through the external circuit and react with oxygen and protons to produce water on the cathode catalyst.
Typical structure of a single cell of PEFCs is shown in fig. 1-1(b). The PEFCs consists of conductive separators with gas flow channels and the membrane electrode assembly (MEA) coupled with a PEM, the catalyst layers and gas diffusion layers. MEA is sandwiched between two separators (carbon or metal plates) and stabilized by two endplates. The performance of the single cell was influenced by the combination of materials, such as membranes, catalysts and gas diffusion layers, manufacturing process of catalyst layers, flow channels in separators.
3
PEFCs were the first to be used in space. The Gemini program employed a 1 kW fuel cell stack as an auxiliary power source [3]. Recently, stationary FCs ‘ENE-FARM’ by electronic manufacturers (Panasonic Co., TOSHIBA Co.) and energy companies (Tokyo Gas Co., Ltd., Osaka Gas Co., and JX Nippon Oil & Energy Co.) resulting in receiving a broad attention [5]. The FC vehicles (FCVs) were on sale starting by Toyota Motor Co. on December 15th, 2014 [6].
5
1-1-2 Role and issue of catalyst support materials in cathode catalyst layers
Although a huge variety of catalysts had been investigated for PEFC cathode, Pt based catalysts are the superior materials for the oxygen reduction reaction (ORR) [4, 7-10]. The Pt-loadings for the ORR are significant to compensate for the slow reaction kinetics due to the low operating temperature in PEFCs. Pt nano-particles dispersed on carbon black (Pt/CB) was developed to improve the mass specific surface area of Pt (see Fig. 1-2(a)) [11-14].
Electrodes in PEFCs are generally porous gas diffusion electrodes to ensure the supply of the reactant gas to the noble metal surface (active zones) where the surface is in contact with the ionic and electronic conductor as described in Fig. 1-2(b). Therefor the function of the electrodes was influenced by not only the catalysis of noble metal for the reaction, but also the conductivity and pore structure of support materials, and ionomers on the surface of the support, which play a role of electron conduction path and gas diffusion path, and ion (Proton) conduction path, respectively. CB have been a typical support materials, which has fused aggregated structure as shown in Fig. 1-2(a) and (b). This structure is constructed by the fusion of nearest-neighbor particles to form a branched structure, which provides high electronic conductivity due to the low grain boundary resistance and also has a large pore volume. From these advantages of CB, Pt/CB catalyst layer can increase the Gas-Proton-Electron interface on Pt (three-phase interface), which is the cathode reaction site.
However, the carbon black corrodes seriously during startup and shutdown of the fuel cell, when the cathode is exposed to potentials significantly higher than the thermodynamic potential for the following reaction [15-20],
6
Carbon corrosion also leads to the isolation of Pt particles from the support surface, deterioration of the cell performance, and shortening of the lifetime of the PEFC [21-24]. Graphitized carbon black (GCB), which has a high degree of graphitization, has been used to mitigate such corrosion. The high stability of a Pt catalyst supported on GCB (Pt/GCB) was confirmed by use of simulated startup/shutdown evaluation [25, 26]. The details of the corrosion mechanisms of the Pt/GCB during the evaluation were investigated by use of electron microscopy and Raman spectroscopy [27]. However, these efforts were not able to completely solve the problem of carbon corrosion. Therefore, an alternative support to CB for the cathode will be required in order to improve the durability, one that has high stability at low pH, high surface area, and high electrical conductivity.
8
1-1-3 Review of conductive ceramics support research
Current research for cathode catalyst have focused on the development of transition metal oxides as cathode catalyst supports to improve the durability for high potential. Various metal oxides were proposed as a candidates from the point of view of thermodynamic stability, which were summarized clearly by prof. Sasaki et al. (See fig. 1-4). In particular, Ti-based oxides are some of the most promising candidate materials. High stabilities of Pt catalysts supported on Magneli phase Ti4O7 and TiOx at high cathode
potentials (<1.5 V) were reported by Ioroi et al. [28, 29]. Sn-based oxides are also noteworthy materials. The long-term durability at high cathode potentials of a Pt/SnO2
catalyst was shown by Sasaki et al. by means of the rotating disk electrode (RDE) technique [30]. However, the ORR activities for Pt supported on the metal oxide were not comparable to that of Pt/CB, because the conductivity of the metal oxide was lower than that of CB. The effects of cation doping (e.g., Sb5+, Nb5+) on the conductivity of TiO
2 and
SnO2 were investigated in order to improve the ORR activity [31-36]. In some of these
studies, it was demonstrated that the activities of Pt/doped metal oxide were higher than that of Pt/CB in half cell study. These high activities have indicated the occurrence of strong interactions between the Pt catalyst particles and the metal oxide. To understand this phenomenon, a fundamental study (i.e., utilizing a model electrode) was conducted recently [37].
As the other approach, metal carbides and nitrides have been investigated because of their high bulk conductivity, even compared with that of carbon. Titanium carbide (TiC) has been investigated as a support for PEFC cathodes [38, 39]. It was reported that a Pt catalyst supported on TiC exhibited ORR activity comparable to that of Pt/CB, and superior stability at high cathode potentials, in a half-cell study [40]. High catalytic
9
activity and stability of Pt supported on titanium nitride (TiN) were also found in half-cell studies [41, 42].
One of the issues for these materials, including metal oxide, is the electrical resistance between nanoparticles, so-called ‘‘grain boundary resistance’’, which influences on the resistance of the single cell. It was mentioned that the ohmic resistance of a single cell using a Pt/TiN cathode was higher than that using a Pt/CB cathode, due to high grain boundary resistance of TiN nano particles. And it was able to be decreased by the addition of acetylene black (AB) to the cathode CL because of the formation of electronic transport paths in the CL [43]. These results have indicated that the other strategies for improvement of grain boundary resistance of the nano-particles are required. Moreover, not only electronic transport path but also gas diffusion network in CL should be accomplished.
From these points, our research group has focused on the structure of the metal oxide particles. We developed new synthesis method, called ‘‘flame combustion method’’, for doped SnO2 with fused aggregate structures, which are similar to that of CB as mentioned
in chapter 1-1-2. It was found that the Sb-SnO2 with fused aggregate structure provides
the comparable catalytic activity, in addition to superior durability for high cathode potential, to conventional Pt/CB catalyst was found in RDE studies [44].
We also reported that increasing the Pt loading (to 20 wt. %) on the doped SnO2
improves the electrical conductivity [45]. This phenomenon should be strongly related to the thickness of the depletion layer of the doped SnO2 support. In that work, it was
mentioned that the Pt nanoparticles might lower the influence of adsorbed oxygen species on the charge carriers on the tin oxide nanoparticle surface. Conducting oxide nanoparticles have been shown to exhibit lower conductivity under oxidizing atmospheres, compared with those under reducing atmospheres [45, 46]. Chemisorbed molecules such
10
as charged oxygen species (O2-, O-, O2-), generated by the reduction of oxygen molecules,
introduce a depletion layer with band bending on the oxide surface. This band bending in the depletion layer makes it difficult for electrons to be transported between particles. This phenomenon is a key factor for fuel cell performance in terms of the ohmic resistance.
12 1-2 Research objective
In the present research, I conducted a detailed investigation of a single cell using Pt/doped SnO2 with the fused aggregate structure under actual operating conditions, in
order to clarify the design guidelines to develop the high performance and high durability cathode for PEFCs.
In chapter 2, I tried to synthesize two type of Pt-catalysts using Sb-SnO2 and Nb-SnO2
with fused aggregated structure. First, I investigated the stability in half cell conditions, in which catalyst exposes from 0.1 to 1.3 V vs. RHE in electrolyte solution during cyclic voltammetry and potential step cycles. Second, I tried to measured stability in single cell conditions (actual operating conditions). I discussed the influence of lower limit of cathode potential on stability of Pt/doped SnO2 catalyst. I also mentioned the deference
of electrochemical stability between Sb-doping and Nb-doping.
In chapter 3, I investigated the cell performances of single cell using Pt/Nb-SnO2
catalyst under actual operating conditions in details. I demonstrated utilities of the fused aggregated structure for reactant transport path in CLs. I also confirmed that the steady-state current-potential (I–E) curves of MEAs using Pt/Nb-SnO2 catalyst were strongly
dependent on the humidity condition of the supplied gases, due to hydrophilic surface of Nb-SnO2. We investigated the effects of the addition of GCB, whose surface is
hydrophobic, into the Pt/Nb-SnO2 cathode on the cell performance to understand the
effect of the surface property of support materials. Secondly, I examined durability of these composite catalyst layers for high cathode potential. The results approaches clearly showed the feasibility and issue of the Pt/Nb-SnO2 catalyst being adopted in PEFC
cathodes.
13
the conductivity of doped SnO2 on the ohmic resistance of single cell and the cell
performance under electrochemical cell conditions was investigated, specifically, the effect of both the loading amount of Pt and the cathode atmosphere on the impedance, ohmic resistance, and cell performance for single cells using Pt supported on Nb-SnO2,
which had the fused aggregate structure. A correlation between the ohmic resistance of the Pt/Nb-SnO2 cells and the cathode potential (oxidation state of Pt particles and SnO2
support) was found. We show that increased Pt loadings and addition of GCB to the Pt/SnO2 cathode mitigate the increase of the ohmic resistance that results from the
increase of the cathode potential.
From the results of these investigations, I summarized the future prospects for the Pt catalysts supported on doped SnO2, and also for the other metal oxides to obtain the high
performance and durability cathode for next generation of PEFCs as general conclusions in chapter 5.
14 1-3 Reference
[1] Intergovernmental Panel on Climate Change fifth Assessment Report (IPCC AR5), submitted by IPCC: hppt://www.ipcc.ch/.
[2] Y. Ando, K. Kuramoto, J. Jpn. Inst. Energy, 85 (2006) 494-498
[3] The Basic Energy plan of Japan, Cabinet council decided on April 11, 2014. Agency for Natural Resources and Energy of Japan (in Japanese):
hppt://www.enecho.meti.go.jp/category/others/basic_plan/pdf/140411.pdf [4] L. Carrette, K. A. Friedrich, and U. Stimming, Fuel cell 1 (2001) 5-39. [5] Household Fuel Cell Cogeneration System, Panasonic Co.:
http://panasonic.co.jp/ap/FC/en_index.html
[6] Fuel cell vehicle ‘‘Mirai’’, environment tech. in Toyota Motor Co. (in Japanese): http://www.toyota.co.jp/jpn/tech/environment/fcv/
[7] T. Toda, H. Igarashi, H. Uchida, M. Watanabe, J. Electrochem. Soc. 146 (1999) 3750. [8] S. Mukerjee, S. Srivanasan, M.P. Soriaga, J. Electrochem. Soc. 142 (1995) 1409. [9] A. Seo, J. Lee, K. Han, H. Kim, Electrochim. Acta, 52 (2006) 1603.
[10] M. Watanabe, D. A. Tryk, M. Wakisaka, H. Yano, H. Uchida, Electrochim. Acta, 84 (2012) 187.
[11] A. Ohma, K. Shinohara, A. Iiyama, T. Yoshida, and A. Daimaru, ECS Trans., 41(1) (2011) 775.
[12] A. Iiyama, K. Shinohara, S. Iguchi, and A. Daimaru, in Handbook of Fuel cells, W. Vielstich, H. Yokokawa, and H. A. Gasteiger, Editor, 6 (2009) p. 905, John Wiley & Sons, Ltd., West Sussex.
[13] L. M. Roen, C. H. Paik, and T. D. Jarvi, Electrochem. Solid-State Lett., 7 (2004) A19. [14] T. Yoda, H. Uchida, and M. Watanabe, Electrochim. Acta, 52 (2007) 5997.
[15] K. Kinoshita and J.A.S. Bett, Carbon, 11 (1973) 403.
[16] J. Willsau and J. Heitbaum, J. Electroanal. Chem., 161 (1984) 93.
[17] G.A. Gruver, R.F. Pascoe, and H.R. Kunz, J. Electrochem. Soc., 127 (1980) 1219. [18] J. P. Meyers and R. M. Darling, J. Electrochem. Soc., 153 (2006) A1442.
15
[20] N. Linse, G. G. Scherer, A. Wokaun, and L. Gubler, J. Power Sources, 219 (2012) 240.
[21] Y. Shao, G. Yin, and Y. Gao, J. Power Sources, 171 (2007) 558.
[22] R. Makharia, S. S. Kocha, P. T. Yu, M. A. Sweikart, W. Gu, F. T. Wagner, and H. A. Gasteiger, ECS Trans., 1 (2006) 185.
[23] C. Hartnig and T. J. Schmidt, J. Power Sources, 196 (2011) 5564.
[24] Y.-C. Park, K. Kakinuma, M. Uchida, H. Uchida, and M. Watanabe, Electrochim. Acta, 123 (2014) 84.
[25] H. Yano, T. Akiyama, P. Bele, H. Uchida, and M. Watanabe, Phys. Chem. Chem. Phys., 12 (2010) 3806.
[26] M. Uchida, Y.-C. Park, K. Kakinuma, H. Yano, D. A. Tryk, T. Kamino, H. Uchida, and M. Watanabe, Phys. Chem. Chem. Phys., 15 (2012) 11236.
[27] M. Hara, M. Lee, C.-H. Liu, B.-H. Chen, Y. Yamashita, M. Uchida, H. Uchida, and M. Watanabe, Electrochim. Acta, 70 (2012) 171.
[28] T. Ioroi, Z. Siroma, N. Fujiwara, S. Yamazaki, and K. Yasuda, Electrochemical Communication, 7 (2005) 183.
[29] T. Ioroi, H. Senoh, S. Yamazaki, Z. Siroma, N. Fujiwara, and K. Yasuda, J. Electrochem. Soc., 4 (2008) B321.
[30] A. Masao, S. Noda, F. Takasaki, K. Ito, and K. Sasaki, Electrochem. Solid-State Lett.,
12 (2009) B119.
[31] S.-Y. Huang, P. Ganesan, and B. N. Popov, Applied Catalysis B: Environmental, 96 (2010) 224.
[32] A. Kumar and V. Ramani, ACS Catal. 4 (2014) 1516.
[33] F. Takasaki, S. Matsuie, Y. Takabatake, Z. Noda, A. Hayashi, Y. Shiratori, K. Ito, and K. Sasaki, J. Electrochem. Soc., 10 (2011) B1270.
[34] E. Fabbri, A. Rabis, R. Kotz, and T. J. Schmidt, Phys. Chem. Chem. Phys., 16 (2014) 13672.
[35] Y. Liu and W. E. Mustain, Electrochim. Acta, 115 (2014) 116.
16
and K. Sasaki, J. Electrochem. Soc., 161 (2014) F1208.
[37] A. Rabis, D. Kramer, E. Fabbri, M. Worsdale, R. Kotz, and T. J. Schmidt, Phys. Chem. Chem. Phys., 118 (2014) 11292.
[38] A. Ignaszak, C. Songa, W. Zhu, J. Zhang, A. Bauer, R. Baker, V. Neburchilov, S. Ye, S. Campbell, Electrochim. Acta, 69 (2012) 397.
[39] L. Yang, Y. C. Kimmel, Q. Lu, J. G. Chen, J. Power Sources, 287 (2015) 196. [40] M. Chiwata, K. Kakinuma, M. Wakisaka, M. Uchida, S. Deki, M. Watanabe, H. Uchida, Catalysts, 5 (2015) 966.
[41] B. Avasarala, P. Haldar, Electrochim. Acta, 55 (2010) 9024.
[42] K. Kakinuma, Y. Wakasugi, M. Uchida, T. Kamino, H. Uchida, S. Deki, and M. Watanabe, Electrochim. Acta, 77 (2012) 279.
[43] H. Shintani, K. Kakinuma, H. Uchida, M. Watanabe, and M. Uchida, J. Power Sources, 280 (2015) 593.
[44] K. Kakinuma, M. Uchida, T. Kamino, H. Uchida, and M. Watanabe, Electrochim.
Acta, 56 (2011) 2881.
[45] Y. Senoo, K. Kakinuma, M. Uchida, H. Uchida, S. Deki, and M. Watanabe, RSC Adv., 4 (2014) 32180.
17
Chapter 2
Investigation for electrochemical stability
of Pt/Sb-SnO
2
and Pt/Nb-SnO
2
in both half-cell study and single cell study
2-1 Introduction
Alternative support materials to conventional carbon materials, such as metal oxide, are required to solve the heavy degradation of PEFC cathode derived from carbon corroding. The detail background and objectives of this research are described in chapter 1. High electronic conductivity and large pore volume of metal oxide support, which provide the fine electronic conducting path and gas diffusion path in catalyst layer (CL), were key considerations for achievement of high performance of cathode CL. The flame combustion method had been developed by Kakinuma et al. [1] to establish both high conductivity and large pore volume of metal oxide. The high catalytic activity of Pt/Sb-SnO2 catalysts, synthesized with this method, was found in half cell study.
In this research, I tried to prepare the two kind of doped SnO2, and evaluated by use of
half-cell measurement and single cell measurement. In chapter 2, the electrochemical stabilities for severe environment of PEFC cathode, such as low pH (nearly pH = 0), high temperature (60~100 oC), wide potential region between 0.1 to 1.3 V vs. the reversible hydrogen electrode (RHE), were examined in the Pt/Sb-SnO2 and Pt/Nb-SnO2 systems.
18 2-2 Experimental
2-2-1 Synthesis and characterization of Pt/Sb-SnO2 and Pt/Nb-SnO2
T
he Sb-SnO2 support and Nb-SnO2 support, with an aggregated network structurewere synthesized with the flame combustion method [1]. Tin 2-ethylhexanoate Sn(C7H15COO)4 and Antimony 2-ethylhexanoate Sb(C7H15COO)5, or Niobium
2-ethylhexanoate Sb(C7H15COO)5 were used as precursors. These materials were mixed at
the desired mole ratio and were dissolved in terpene oil. These solutions were mixed by use of a magnetic stirrer at room temperature. The obtained solutions were supplied to an atomizer by a peristaltic pump and were injected into a flame with oxygen gas at a rate of 9 L min-1. The temperature of the flame, which was generated by propane (1 L min-1) and oxygen (5 L min-1), was about 1600 oC. The gas flow rates mentioned above were maintained constant for all samples to unify the oxidation conditions. Each as-prepared oxide was sintered at 800 ◦C for 2 h in air in a rotary kiln furnace. Pt nanoparticles were loaded on the doped SnO2 by a colloidal method [2]. A measured amount of reagent grade
chloroplatinic acid was dissolved in a sodium bisulfate aqueous solution, followed by stirring for several minutes until the orange color disappeared. In order to decompose the intermediate complex, formed in the above step, to a Pt hydroxide colloid, hydrogen peroxide was added to the colorless solution at a rate of 2 ml min−1 under pH control of the solution to 5.0 by adding 5 wt.% sodium hydroxide solution. Synthesis of the Pt hydroxide nanoparticle colloidal solution was complete when the colorless solution took on a clear yellow color. The support particles were dispersed in ultrahigh purity (UHP) water (Milli-Q water, Millipore Japan Co., Ltd., ultrapure water, 18.2 MΩ cm), and this suspension was mixed with the Pt hydroxide nanoparticle colloidal suspension at room temperature. After stirring the resulting mixture overnight at room temperature, it was
19
filtered. The powder obtained was washed well with UHP water to remove trace amounts of remaining chlorides. The Pt hydroxide nanoparticle colloid deposited on these supports was reduced to Pt metal nanoparticles by stirring in a 50 wt.% ethanol aqueous solution for 2 h at 40 ◦C.
Crystallographic structures and crystallites sizes of the obtained doped SnO2 were
confirmed by X-ray diffraction measurements (XRD, Ultima 4, Rigaku Co.) with Cu Ka radiation (0.15406 nm, 40 kV, 40 mA). The conductivities of the doped SnO2 were
estimated by the four-point probe method (MCP-PD51, Mitsubishi Chemical Analytech Co., Ltd.). The morphology of the catalysts and support materials was observed by transmission electron microscopy (TEM, H-9500, Hitachi High-Technologies Co.). The average particle diameters and size distributions of the Pt nanoparticles were also estimated from the TEM images. The surface area of the oxide support was estimated by the Brunauer, Emmett and Teller absorption method (BET, BELSORP-max, Nippon BEL Co.). The amounts of Pt, supported on the support, were quantitatively analyzed by use of an inductively coupled plasma-mass spectrometric analyzer (ICP-MS, 7500CX, Agilent Technologies Inc.). The analysis of the Pt content was carried out with aqueous solutions that were prepared by the dissolution of the Pt catalysts in hot aqua regia. . The solubility of Pt/Sb-SnO2 and Pt/Nb-SnO2 in 0.1 mol dm−3 H2SO4 aqueous
solutions was evaluated at 80 oC under reducing conditions (H
2 bubbling) and oxidizing
conditions (air bubbling). Each component (Sn, Sb and Nb) in the H2SO4 aqueous
20
2-2-2 Electrochemical measurements by use of rotating disk electrode
The half-cell study was carried out with rotating disk electrode technique. The preparation method used for the test electrodes for this experiment was similar to those of previous our works (see, e.g., Ref. [3]), as briefly explained below. Pt/Nb-SnO2 and
Pt/Sb-SnO2 catalysts were uniformly dispersed on the glassy carbon substrate (5 mm in
diameter) by delivering an appropriate amount of a mixed solution of ethanol and water (9:1, v/v), in which the catalyst was suspended, for a constant Pt loading of 11 μg cm−2. Then, a suspension of 0.2 wt.% Nafion® diluted with a mixed solution of ethanol and water (4:1, v/v) was spread evenly over the catalyst layer to yield an average film thickness of 0.05 μm. The Nafion®-coated electrode was dried in air at room temperature overnight. The counter electrode was a platinum wire. The potential of the working electrode was referenced to a reversible hydrogen electrode (RHE) immersed in the same solution. The electrolyte solution of 0.1 mol dm−3 HClO4 was prepared from reagent grade
chemicals (Kanto Chemical Co.) and UHP water.
A potentiostat (HZ-5000, Hokuto Denko Co.) was used for the electrochemical measurements. Cyclic voltammetric (CV) measurements were performed with RDE for the investigation for electrochemical stabilities of the catalyst, and determination of electrochemically active surface area (ECSA). The CV was recorded by sweeping the potential between 0.05 and 1.00 V vs. RHE at 0.1 V s−1 at the room temperature after the electrolyte solution was purged with N2 gas for at least 1 h. The ECSA of Pt was evaluated
from the electrical charge for the hydrogen adsorption (QH) in the negative-going potential sweep from 0.40 to 0.05 V in the CV at a sweep rate of 0.1 V s−1, after subtraction of the double layer charge (QDL) [4], assuming QH = 0.21 mC cm−2, conventionally
21
Linear sweep voltammogram measurements of the oxygen reduction reaction (ORR) activity were performed. Prior to ORR measurements, the electrolyte solution was saturated with O2 gas by purging for at least 1 h. The hydrodynamic voltammograms for
the ORR at the working disk electrode were recorded by sweeping the potential from 0.05 to 1.0 V (5 mV s−1) at rotation rates in the 1000–2750 rpm range at room temperature.
2-2-3 Electrochemical measurements in single cell
The catalyst pastes were prepared, by use of a planetary ball mill, from Pt/Sb-SnO2 and
Pt/Nb-SnO2 catalysts mixed with Nafion® binder (DE521, E.I. Du Pont de Nemours &
Co., Inc.) for 30 min. The mass ratio of Nafion® binder (dry basis) to support oxide (Nafion binder/oxide) was adjusted to 0.67. The catalyst paste was directly sprayed onto the gas diffusion layers (GDLs, 25BCH, SGL Carbon Group Co., Ltd.) at 80 oC by use of a pulse-swirl-spray apparatus (PSS, Nordson Corp.), and then dried at 60 oC in air in an
electric oven. On the resulting gas diffusion electrode (GDE), the active geometric area of the electrodes used as cathodes was 3.81 cm2 and the loading amount of Pt was 0.2 mg
cm−2. In a similar manner, anodes for fuel cell tests were prepared from commercial Pt/CB, and the loading amount of Pt was 0.5 mg cm−2. MEAs were formed by sandwiching an electrolyte membrane (commercial Nafion® membrane, NRE 212, Dupont, 50 μm thickness) between the anode and cathode prepared without a conventional hot-press process and were assembled into a circular test cell holder (electrode area, 3.81 cm2). All cells were operated under 40 oC or 80 oC, with humidified H
2 and air, 53% or 100%
relative humidity (RH) at 80 oC under ambient pressure. Hydrogen and air were supplied at 200 mL min−1 on a dry basis, which corresponds to 13% and 32% utilization, respectively, at 1 Acm−2. The I–E curves and ohmic potential drops (IR-drop) were
22
measured by use of a current interrupter (NCPG1010, Nikko Keisoku Co.) by applying a current-off pulse for 100 μs to the cell and recording the resulting potential drop with a storage oscilloscope (VC6023A, Hitachi). All of the potentials are referred to the hydrogen anode, which is assumed to approximate the RHE potential.
23 2-3 Results and Discussion
2-3-1 Characterization of Pt/Nb-SnO2 and Pt/Sb-SnO2 systems
The XRD pattern of an Nb-SnO2 and an Sb-SnO2 are shown in Fig. 2-1. All peaks of
both samples were assigned to those of rutile-type SnO2, without any impurity phase such
as Nb2O5. The surface areas of the Nb-SnO2 support and Sb-SnO2 support were 37 m2 g−1
and 33 m2 g−1, respectively, estimated by the Brunauer-Emmett-Teller adsorption method. The electrical conductivities of the Nb-SnO2 and Sb-SnO2 were 0.7 S cm−1 and 40 S cm−1,
24
TEM images of Nb-SnO2 and Sb-SnO2 are shown in Fig. 2-2(a) and (b). It can be seen
that these substrate particles aggregated in the form of strings of beads, similar to the structure of carbon blacks (Fig. 2-2(c)), which is desirable to reduce the contact resistance between particles. The aggregates further agglomerated with each other. These aggregation and agglomeration processes may lead to the formation of different size pores in the catalyst layers. The cumulative pore volumes for Nb-SnO2 and Sb-SnO2 are shown
in Fig. 2-3. The pore volume for a typical CB is also shown in the same figure for reference. It was found that there appear primary pores (<ca. 30 nm in diameter) and secondary pores (>ca. 30 nm in diameter) for both of Nb-SnO2 and Sb-SnO2, which are
quite similar to those of CB. From the good correspondence of the primary pore sizes of the oxide supports with their primary particle sizes, and the similarity of both to those of CB, the pore walls can be considered to be the exposed oxide particle surfaces, which are useful surfaces for Pt support [8]. On the other hand, although the secondary pore size of Nb-SnO2 was on the same order as that of CB, that of Sb--SnO2 was larger. The pore
volumes of most CBs have been confirmed to be sufficiently large to act as effective gas diffusion channels in the catalyst layer [9, 10]. Thus, we consider that Nb-SnO2 and
particularly Sb-SnO2 with their aggregated structures, are attractive for use in gas
27
The TEM images of Pt/Nb-SnO2 and Pt/Sb-SnO2 are shown in Fig. 2-4(a) and (b). Pt
nanoparticles were dispersed extremely uniformly on both of the oxide supports, as seen in Fig. 2-4(a) and (b). The insets of Fig. 2-4 (a) and (b) (second row) show magnified images focused on the interfaces of Pt particles and the substrates. Itis clear that the supported Pt catalyst particles are well oriented, with clear alignment of their crystal planes with those of the support, indicating the strong mutual interaction. The average sizes of the Pt particles were 2.8 ± 0.4 nm (Pt/Nb-SnO2) and 2.7 ± 0.5 nm (Pt/Sb-SnO2),
i.e., with a very narrow size distribution (See third row of Fig. 2-4), nearly monodisperse. Sn was not detected in any of the Pt particles by EDX, which indicates that none of the support materials reacted with the Pt catalyst by the present treatment method.
29 2-3-2 Electrochemical stability in half-cell
Fig. 2-5 shows the CVs for the Pt/Nb-SnO2 and Pt/Sb-SnO2 electrodes in 0.1 mol dm−3
HClO4 solution saturated with N2 at 25 oC. The hydrogen adsorption/desorption peaks
were clearly evident. The ECSA values, which were based on the hydrogen adsorption process, reached 79.7 m2 g-Pt−1 (Pt/Nb-SnO2) and 68.6 m2 g-Pt−1 (Pt/Sb-SnO2), respectively.
Anodic current due to oxide formation on the platinum surface also appeared above 0.7 V vs. RHE. These peak positions correspond well to those for the commercial Pt/CB or Pt/GCB for the similar potential sweep range (0.05 V to 1.3 V vs. RHE) cited from the previous work [3].
The insets in Fig. 2-6(a) and (b) show the initial hydrodynamic voltammograms for the ORR at the Pt/Nb-SnO2 and Pt/Sb-SnO2 RDEs in 0.1 mol dm−3 HClO4 solutions saturated
with oxygen at room temperature at various rotation rates (ω). The onset potentials for ORR at these catalysts were both ca. 0.98 V, and the ORR current approached the diffusion limiting value at around 0.7 V. The effect of the solution phase mass transport was removed with plots of the inverse current vs. the inverse of the square root of rotation rate (ω−1/2) obtained from these current-potential curves, based on the Koutecky–Levich
equation, as shown in Fig. 2-6(a) and (b). Linear relationships with a constant slope were obtained at 0.85 V vs. RHE for the Pt/Nb-SnO2 and Pt/Sb-SnO2 catalysts. By
extrapolating ω−1/2 to 0 (infinite mass transport rate), the kinetically controlled currents I k
were determined. Using these data, the kinetically controlled current densities based on Pt area per unit geometric area (jk_geo/(APt/Ageo) = jk_Pt) were determined, and the
corresponding mass activities (MA) were calculated by dividing the Ik values by the mass
of loaded Pt on the RDE. The jk-Pt and MA values at 0.85 V for Pt/Sb-SnO2 and
30
catalysts and were higher than that of the Pt/CB catalyst cited from Ref. [3], perhaps due to a so-called “strong metal/support interaction” (SMSI). The MA value for Pt/Nb-SnO2
32
The durabilities of the Pt/Nb-SnO2 and Pt/Sb-SnO2 catalysts were tested with the FCCJ
protocol [11] for the start/stop cycling operations and were compared with those of commercial Pt/CB and Pt/GCB. Changes in the ECSA values are summarized as a function of the logarithm of the number of potential step cycles N in Fig. 2-7. Similar to the results for the commercial Pt/CB and Pt/GCB cited from Ref. [3], the ECSA values for Pt/Nb-SnO2 and Pt/Sb-SnO2 did not change significantly in the initial stage of the
cycling. However, after several hundred cycles, they decreased linearly with respect to log N, as seen in the figure, which allows us be able to predict their ECSA values after many start/stop cycles by extrapolation of the linear relationships. We define their effective lifetime or cycle half-life N1/2 as the number of cycles at which the ECSA values
either reached or were projected to reach half the initial value for each catalyst. Although the durabilities, as estimated by N1/2, for both Pt/CB and Pt/GCB were ca. 1000 [3], those
for Pt/Nb-SnO2 and Pt/Sb-SnO2 were ca. 100,000, i.e., 100 times longer, which is
sufficient for practical application in fuel cell vehicles (FCEVs). It was also estimated that both of the oxide supported catalysts maintained ECSA values of approximately 78% of the initial values after 5000 cycle operations, but Pt/GCB showed only 26% and Pt/CB showed a complete loss.
TEM images of the Pt/Nb-SnO2 and Pt/Sb-SnO2 taken after the durability test are
shown in Fig. 2-8(a) and (b). Although the ECSA values for all of the catalysts decreased during the start/stop cycling tests, it is clear that particle size growth was suppressed for the oxide substrate catalysts. The average particle sizes and standard deviations for Pt/Nb-SnO2 and Pt/Sb-SnO2 were 4.1 ± 0.6 and 4.3 ± 0.6, although those for Pt/GCB and Pt/CB
were 5.5 ± 0.8 and 5.1 ± 1.0 nm, respectively [3]. As shown by the insets of Fig. 2-4(a) and (b), the SMSI effect was indicated by the fact that the Pt particles exhibited an
33
excellent orientation on the Pt/Nb-SnO2 and Pt/Sb-SnO2 support surfaces. We believe that
such a SMSI effect should contribute to suppressing the migration and aggregation of the Pt nanoparticles on these supports. I will discuss this point in chapter 3. Nevertheless, some Pt particle size growth was observed, even on the Pt/Nb-SnO2 and Pt/Sb-SnO2 after
the durability test, which was likely to be influenced by a dissolution and re-deposition process, i.e., an “electrochemical Ostwald ripening” process during the potential cycling [11,12].
35 2-3-3 Electrochemical stability in single-cell
Fig. 2-9 shows steady-state I–E curves for the PEFCs with the Pt/Nb-SnO2 and
Pt/Sb-SnO2 and Pt/CB cathodes (Pt loading, 0.20 mg cm−2) operated under the conditions
described in the Chapter 2-2-3. Each cell was pre-conditioned by sweeping the potential from 0.1 to 1.0 V vs. RHE at 10 mV s−1 100 times under humidified H2 and N2
atmospheres (1 atm), respectively, for the anode and cathode before the measurements in order to ensure steady performance. We found that the cells using the Pt/Nb-SnO2 and
Pt/Sb-SnO2 exhibited an inferior output performance at cathode potentials below 0.7 V,
compared to that using Pt/CB. The ohmic resistances of the cells, which were mainly due to the membrane resistances, may not be considered as the cause of the inferior performances, since their values were nearly equal to that for Pt/CB, as shown in the inset of Fig. 2-9. On the other hand, low O2 diffusivity may not be considered as the reason for
the inferior performance for the Pt/Nb-SnO2 and Pt/Sb-SnO2, since they have sufficient
primary and secondary pore volumes, at least equivalent to those for Pt/CB, as shown in Fig. 2-3. The mean Pt particle sizes of Pt/Nb-SnO2 and Pt/Sb-SnO2 after the measurement
remained at 3.30 nm and 3.50 nm, respectively, so support particle size changes can also be ruled out in explaining the inferior performance. The ECSA values of Pt/Nb-SnO2,
which were based on the hydrogen adsorption process in the CV at 40 oC in 100% RH (Fig. 2-10), reached 75.2 m2 g−1 . Pt utilization of Pt/Nb-SnO
2 reached 89.2%, which was
higher than that of Pt/CB (62%) [13], although the ECSA value of Pt/Sb-SnO2 was only
42.0 m2 g−1. Thus, we considered a possible poisoning of catalysts and/or ionomers in the
cathode catalyst layers by impurities originating from the oxide components as a reason for the inferior performances.
37
2-3-4 Effect of lower limit potential on single-cell performance
Fig. 2-11(a) and (b) show CVs for different potential sweep regions obtained by triangular potential sweeping between various lower potential limits Elower with a constant
upper limit of 1.0 V on both cathodes applying the same oxide-supported catalysts in the MEAs at 100% RH and 40 oC. The starting potentials were lowered stepwise for the CV measurements. The CVs for Pt/Nb-SnO2 showed both hydrogen adsorption/desorption
and Pt oxidation/reduction peaks, with an ECSA (Elower = 0.1 V) of 75.7 m2 g−1, which
was estimated from the electrical charge for the QH in the negative-going potential sweep
from 0.4 to 0.1 V in the CV. On the CVs for Pt/Sb-SnO2, an extra set of anodic–cathodic
peaks appeared from 0.5 V to 0.8 V when the starting potential was extended below 0.4 V. The extra peaks grew with decreasing Elower, which could presumably be attributed to
a cathodic dissolution/redeposition of these substrate oxides. The ECSA (Elower = 0.1) of
Pt was 42.0 m2 g−1, which clearly suggests that the hydrogen adsorption/desorption
reactions on Pt were disturbed by re-deposition of some dissolved species. Such dissolution/re-deposition phenomena had scarcely been observed in the CV measurements in liquid electrolyte solution, most likely because the species was at a very low concentration and diffused into the electrolyte immediately. Since the I–E performances shown in Fig. 2-9 were measured after the pre-conditioning at 0.1 V for 24 h, it is very likely that some component of the supports, the majority being Sn, might dissolve into the solid ionomer used in the catalyst layer as the binder for the supported Pt catalysts and redeposit on the Pt surface under the existing operating conditions. The deposited species has a high possibility of disturbing the cathodic reaction on the Pt/Sb-SnO2 cathode. Accordingly, we performed experiments to confirm the solubility of the
39
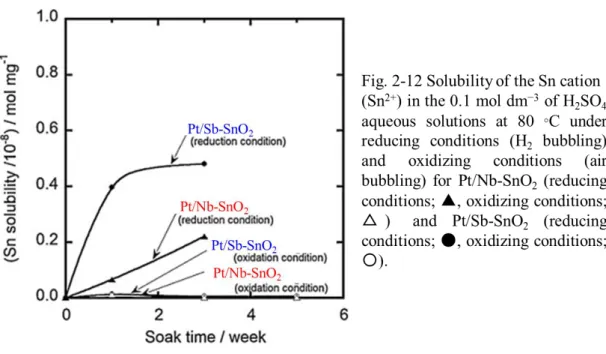
Fig. 2-12 shows the solubility of Pt/Nb-SnO2 and Pt/Sb-SnO2 in 0.05 mol dm−3 H2SO4
aqueous solutions at 80 oC under reducing conditions (H2 bubbling) and oxidizing
conditions (air bubbling). Neither of the dopants, Sb and Nb, was detected in the H2SO4
solutions under either condition. The major component Sn was also not detected in the H2SO4 solutions for either oxide-supported catalyst under the oxidizing condition, but it
was detected at both catalysts even at short immersion times under reducing conditions. The Sn-cation (Sn2+) content in the solution reached 0.46 × 10⁻⁸ mol mg-support−1 after three
weeks. The value was corresponded to 0.075 atom% Sn in the Sb-SnO2 support. The Sn
dissolution from Pt/Nb-SnO2 was a factor of ca. 2 less than that for Pt/Sb-SnO2 after three
weeks. In the MEA, Sn dissolution should occur under similar conditions, accompanied by the possible under potential deposition of Sn ad-atoms on the Pt nanoparticle surfaces in the less positive potential region, particularly lower than 0.4 V, which apparently led to the decrease of ECSA and cathodic performance, as shown in Fig. 2-10.
40
In order to avoid the influence of Sn dissolution/re-deposition, we evaluated the cell performance while the operation was conducted at cathodic potentials greater than 0.4 V. The results are shown in Fig. 2-13. The steady performances of the cells using Pt/Nb-SnO2 and Pt/Sb-SnO2 exhibited superior output, compared to that obtained using Pt/CB,
with behavior different from that shown in Fig. 2-9. Fig. 2-14 shows the steady-state I–E curves (IR-free) in air for Pt/Nb-SnO2, Pt/Sb-SnO2 and Pt/CB. The slopes at the
Pt/Nb-SnO2, Pt/Sb-SnO2 and Pt/CB were close to the theoretical value for the kinetically
controlled oxygen reduction process, i.e., −70 mV decade−1
, consistent with that for Pt/CB. We consider that the protons, oxygen and conducting electrons appear to be supplied sufficiently well to the Pt catalysts in the Tafel-linear region. We conclude that the aggregate-structured Nb-SnO2 is a good candidate support for high durability cathodes
42 2-4 Conclusions
I prepared Pt nanoparticle supported on Nb-SnO2 and Sb-SnO2. Both of these
conductive oxides, which were synthesized by the flame combustion method, were in the form of nanometer-sized particles. Each of the oxide particles was aggregated with nearest neighbors, thus creating a structure similar to that of CB. This structure is considered to be beneficial for the lowering of contact resistance between Nb-SnO2 and
Sb-SnO2 particles, for the high dispersion of Pt nanoparticles, and for the formation of
gas diffusion paths. We synthesized the Pt/Nb-SnO2 (Pt loading, 10.0 wt.%) and
Pt/Sb-SnO2 (Pt loading, 12.3 wt./%) catalysts by the colloidal method. The Pt nanoparticles
were found to be well oriented on the Nb-SnO2 and Sb-SnO2 support surfaces. Their initial
ECSA values were 79.7 m2 g-Pt−1 and 68.6 m2 g-Pt−1, respectively, at room temperature,
and these values were maintained at a high value during the potential step cycling test (0.9–1.3 V). The ORR mass activity value for Pt/Nb-SnO2 was superior to that for
Pt/Sb-SnO2, the latter being very similar to that for Pt/CB. The high durability and high catalytic
activity would rely both on the significant Pt-support interaction and on the stability of these supports.
I also evaluated the I–E performance of single cells utilizing Pt/Nb-SnO2 and
Pt/Sb-SnO2 cathodes. During operation at potentials above 0.4 V, the I–E performances of the
cells utilizing Pt/Sb-SnO2 and Pt/Nb-SnO2 cathodes were superior to that for a cell
utilizing Pt/CB. The Sb-SnO2 support with aggregated structure had durability at high
operating potentials, although the cell performance using a Pt/Sb-SnO2 cathode decreased
during operation at potentials below 0.4 V as a result of the slight dissolution of the Sn cation. I conclude that the Nb-SnO2 with high durability over a wide potential range, is a
43 2-5 Reference
[1] K. Kakinuma, M. Uchida, T. Kamino, H. Uchida, and M. Watanabe, Electrochim. Acta,
56 (2011) 2881.
[2] M.Watanabe, M.Uchida, S.Motoo, J.Electroanal.Chem, 229 (1987) 395.
[3] H. Yano, T. Akiyama, P. Bele, H. Uchida, M. Watanabe, Phys. Chem. Chem. Phys.,
12 (2010) 3806.
[4] A. Pozio, M. De Francesco, A. Cemmi, F. Cardellini, L. Giorgi, J. Power Sources, 105 (2002) 13.
[5]M. Watanabe, S. Motoo, J. Electroanal. Chemisty, 60 (1975) 259. [6] M. Watanabe, S. Motoo, J. Electroanal. Chem., 60 (1975) 267.
[7] M. Uchida, Y. Aoyama, M. Tanabe, N. Yamagihara, N. Eda, A. Ohta, J. Electrochem. Soc. 142 (1995) 2572.
[8] M. Watanabe, M. Tomikawa, A. Motoo, J. Electroanal. Chem. 195 (1985) 81. [9] M. Uchida, Y. Aoyama, N. Eda, A. Ohta, J. Electrochem. Soc., 142 (1995) 463. [10] M. Uchida, Y. Aoyama, N. Eda, A. Ohta, J. Electrochem. Soc., 142 (1995) 4143. [11] A. Iiyama, K. Shinohara, S. Iguchi, and A. Daimaru, in Handbook of Fuel Cells, W. Vielstich, H. Yokokawa, and H. A. Gasteiger, Editors, 6 p. 905, John Wiley &Sons, Ltd., West Sussex (2009).
[12] K. Kinoshita, J.T. Lundquist, P. Stonehart, J. Electroanal. Chem. 48 (1973) 157. [13] K. Yasuda, A. Taniguchi, T. Akita, T. Ioroi, Z. Siroma, Phys. Chem. Chem. Phys., 8 (2006) 746.
[14] M. Uchida, Y.C. Park, K. Kakinuma, H. Yano, D.A. Tryk, T. Kamino, H. Uchida, M. Watanabe, Phys. Chem. Chem. Phys., 15 (2013) 11236.
44
Chapter 3
Effects of Structure, Hydrophilicity of Nb-SnO
2and Addition of Graphitized CB on
the Single Cell Performance and the Durability
3-1 Introduction
I developed the Pt/Nb-SnO2 catalyst as an alternative to conventional Pt/CB catalyst in
order to solve the heavy degradation of PEFC cathode due to the carbon corrosion. In chapter 2, it was mentioned that Pt/Nb-SnO2 catalyst has the high electrochemical
stability for typical cathode operating conditions. In this chapter, I focus on the reactant transport in the membrane electrode assembly (MEA) using Pt/Nb-SnO2 catalyst layer
(CL).
The formation of reactant transport path in catalyst layer is one of the most important factors to enhance the single cell performance. The structure of support materials is key consideration for the electronic path and gas diffusion path in CL. For example, the structure of CB support, called fused aggregate structure, could provide high electronic conductivity (fine electronic path) due to the low grain boundary resistance, and large pore volume (gas diffusion path) as explained in chapter 1-1-2. From this point, we had adapted the fused aggregate structure for metal oxide as described in chapter 2.
I report here detailed investigations of a single cell using Pt/Nb-SnO2 with the fused
aggregate structure under actual operating conditions. For instance, I mention that the steady-state current-potential (I–E) curves of membrane-electrode assemblies (MEAs) were strongly dependent on the humidity condition of the supplied gases. I also
45
investigated the effects of the addition of GCB into the Pt/Nb-SnO2 cathode for the
improvement of the cell performance. The results of these approaches clearly indicate the feasibility of the Pt/Nb-SnO2 catalyst being adopted in PEFC cathodes.
3-2 Experimental
3-2-1 Synthesis and characterization of Pt/Nb-SnO2
Nb-SnO2 nanosized particles were synthesized by the flame combustion method;
details of the method were described in section 2-2-1. The as-prepared oxide was sintered at 800oC for 4 h in air in a rotary kiln furnace. The surface areas of the Nb-SnO2 nanosized
particles were 37 m2 g−1, estimated by the Brunauer-Emmett-Teller adsorption method (BET, 3Flex Surface Characterization Analyzer, Micromeritics Instrument Co.). Also, water vapor adsorption measurements of support materials were performed after drying at 105 oC for 6 h in vacuum. The Pt nanoparticles were synthesized by the colloidal
method; details of the method were described in an earlier paper [1]. Pt/Nb-SnO2 catalyst
with a Pt loading of 16.4 wt. % (determined by inductively couple plasma-atomic emission spectrometry (ICP-AES)) was used for further electrochemical and fuel cell characterization studies.
3-2-2 Preparation of MEAs
The catalyst inks for cathodes were prepared with the Pt/Nb-SnO2, Nafion® binder (ion
exchange capacity IEC = 0.9 meq g-1, DE521, E. I. Du Pont de Nemours & Co., Inc.),
ethanol and pure water by use of a planetary ball mill. The volume ratio of Nafion® binder (dry basis) to support oxide (Nafion® binder/oxide) was adjusted to 0.67. In addition,
46
in volume ratios from 0% to 38% of GCB to GCB+Nb-SnO2 and mixed by use of a
planetary ball mill for 30 min and use of a thin-film spin system high-speed mixer (Model 30-L, PRIMIX Corporation) for 30 min. Pt/GCB catalyst (TEC10EA30E, 29 wt.%-Pt, Tanaka Kikinzoku Kogyo K.K.) was used for reference for the cathode measurements and for all anodes of the test cells; the inks were prepared with the same Nafion® binder/GCB ratio of 0.67 in a manner similar to that mentioned above. These catalyst inks were directly sprayed onto both sides of the Nafion membrane (NRE 212, Dupont, 50 μm thickness) as the anode and cathode by the pulse-swirl-spray (PSS) technique to prepare the catalyst-coated membranes (CCM), which were then dried at 60 oC in an electric oven. The CCMs were annealed by hot-pressing at 140 oC and 1.0 MPa for 3 min, and then they were assembled with two gas diffusion layers (GDLs, 25BCH, SGL Carbon Group Co., Ltd.) and a single serpentine pattern cell (Japan Automobile Research Institute (JARI) standard cell [2]) with an active geometric area of 29.2 cm2. Pt loadings of the cathodes
with Pt/Nb-SnO2 or Pt/GCB were 0.05 ± 0.01 mg cm-2, and those of the anodes with
Pt/GCB were 0.55 ± 0.05 mg cm-2. The high Pt loading at the anode was used to maintain
a negligibly small polarization under all of the experimental conditions, so that it could be used as a reversible hydrogen electrode (RHE) for the evaluation of the polarization behavior of each cathode. The cross-sectional images of the CLs were observed by a scanning transmission electron microscope, STEM (HD-2700, Hitachi) in both secondary electron (SE) and transmission electron (TE) modes after the performance evaluation. Small pieces of the samples, cut from the centers of the MEAs, were prepared at a thickness of about 100 nm with a focused ion beam apparatus (FB2200, Hitachi).
47 3-2-3 Fuel cell operating conditions
The cell potential (E) as a function of current density (I) was measured with hydrogen and oxygen/air at 80 oC under ambient pressure (1 atm). Hydrogen gas was supplied to the anode and oxygen/air to the cathode. The flow rates of all gases were controlled by mass flow controllers. The utilizations of the reactant gases were 70% for H2, 40% for O2
and 40% for air. These gases were humidified at 100% relative humidity (RH) by bubbling through a hot water reservoir. The I-E curves were galvanostatically measured under steady-state operation, with a measurement time of 5 min for each point by use of an electronic load (PLZ-664WA, Kikusui Denshi) controlled by a measurement system (FCE-1, Panasonic Production Technology). The resistances were measured at 10 kHz under load by use of a digital ac milliohmmeter (Model 356E, Tsuruga Denki) and were used as the cell ohmic resistances. In Table 3-1, the resistance values for the three different types of cells were compared with those of impedance measurements by a potentiostat (PGST30 Autolab system, Eco-Chemie) under a constant-current load at 200 mA cm−2 in H2 (anode) and air (cathode) with 100% RH at 80 oC; H2 flow rate 58 ml min−1, air flow
rate 242 ml min−1, ambient pressure. The differences of the resistances measured by these methods were less than 15% in all cells. Therefore, we used values measured with the milliohmmeter as the cell ohmic resistances (R).
48
The I-E (IR-free) curves, corrected for ohmic potential drops, were used for the cathode polarization curves and were referred to the reversible hydrogen electrode (RHE), because the polarization of the hydrogen anode was negligibly small, even in the high current density region.
3-2-4 Durability evaluation simulating the start/stop operation
The durability evaluation simulating the start/stop operation of the PEFC was performed according to the procedure of the standard potential cycle protocol recommended by the Fuel Cell Commercialization Conference of Japan (FCCJ), as reported in our previous papers [3]. Before the potential cycling test, the initial performance test, which was an I–E measurement at 80 oC and 100% RH, was carried out in the manner described in chapter 3-2-3. Cyclic voltammetry (CV) was carried out for each cathode at 80 oC and 100% RH by use of a potentiostat (PGST30 Autolab system,
Eco-Chemie). The cathode was purged with N2 (100 mL min−1, 100% RH), while H2 gas
(100 mL min−1, 100% RH) was supplied to the anode. The anode was used as both reference electrode and counter electrode for the CV. The cathode potential was maintained at 0.078 V for 3 s to obtain a reproducibly reduced state of Pt. Then, the potential was swept from 0.078V to 1.000 V at 20 mV s−1 and reversed back to 0.078 V. The durability evaluation was performed at a cell temperature (Tcell) of 80 oC with
humidified H2 and N2 supplied to the anode and cathode, respectively. Both of the gases
were humidified at 100% RH by bubbling through a water reservoir maintained at 80 oC.
The gas flow rate during the potential cycling was controlled at 100 mL min−1. The potential at the cathode was swept between 1.0 and 1.5 V at a scan rate of 0.5 V s−1. Before the durability evaluation and after given numbers of potential cycles, CV was
49
performed to examine changes in the electrochemically active surface area (ECSA) value of Pt. The value of ECSA was determined from the hydrogen adsorption charge referred to QH◦ = 0.21 mC cm−2, which is adopted conventionally for clean polycrystalline
platinum. The hydrogen adsorption charge was calculated from current in the negative-going potential sweep in the range from ca. 0.4 V vs. RHE to 0.1 V at the cathode, with subtraction of the double layer current. After the durability evaluation, the I–E curves were obtained. All of the cells were operated under ambient pressure in the measurements. Before and after 60,000 cycles of durability cycling, surface morphological states of GCBs in the cathodes were evaluated by means of Raman spectra recorded with a confocal micro-Raman instrument (LabRAM HR-800 spectrometer, HORIBA Jobin Yvon, Ltd.), obtained by excitation with a He–Ne laser (632.8 nm) of approximately 2 mW. The measurements were carried out with a 100× magnification objective and a 100-μm confocal aperture for the sample illumination. The collection of the scattered light was performed with a 600-line mm−1 grating and a Peltier-cooled CCD camera as a detector. The instrument control and spectral analysis were performed with the software programs Labspec 5 (HORIBA Jobin Yvon Ltd.) and GRAMS/AI 8.0 (Thermo Scientific). In order to compare easily the results for each sample, the Raman spectra of the Pt catalysts illustrated in the figures were normalized by the intensity of the peak at ca. 1580 cm−1, which corresponds to the spectrum for a stable graphitic lattice, as discussed in our previous paper [4]. The cross-sectional images were observed both before and after the durability evaluation with a scanning transmission electron microscope, STEM (HD-2700, Hitachi). Small pieces of the samples, cut from the centers of the MEAs, were prepared at a thickness of about 100 nm with a focused ion beam apparatus (FB2200, Hitachi).
50 3-3 Results and Discussion
3-3-1 Characterization of cathode catalyst layer
Table 3-2 shows the BET surface areas for each support, Nb-SnO2 and GCB, and also
shows the corresponding water adsorption volumes, both per unit weight and per unit surface area (H2Oads-w and H2Oads-s). The BET surface area of the Nb-SnO2 support was
35.4 m2 g-1, which is lower than that of GCB (144 m2 g-1). The adsorbed water volume per unit weight of Nb-SnO2 support was 8 times greater than that of GCB, and the
volume per unit surface area was 34 times greater than that of GCB. These results clearly indicate that the surface of Nb-SnO2 is more hydrophilic than that of GCB.
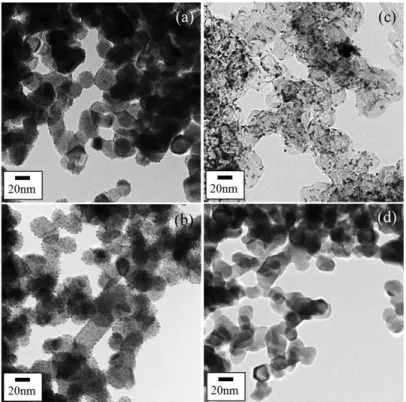
The SE images and TE images of the cross-sections of the Pt/Nb-SnO2 cathode
with/without GCB (13 vol. %) are shown in Fig. 3-1, (a) to (d), respectively. The CL of Pt/Nb-SnO2 without GCB had a porous structure, which was formed from the fused
aggregate Nb-SnO2, as shown in Fig. 3-1, (a) and (b). In Fig. 3-1, (a) and (c), the existence
of Pt particles on the Pt/Nb-SnO2 is clearly observed. The added GCB can be
distinguished from the Pt/Nb-SnO2 by the absence of supported Pt particles and by its
lower electron density than the metal oxide and consequently its lighter gray, as shown in Fig. 3-1, (c) and (d). It was confirmed from these observations for the mixed CL of Pt/Nb-SnO2 + GCB that the CL consisted of segregated agglomerates with a similar size
(sub-μm), which have distinctive properties from each other, as shown in Table 3-2, that is, highly hydrophilic and hydrophobic, respectively.
52
3-3-2 Humidity dependence of single cell performance using Pt/Nb-SnO2 cathodes
Fig. 3-2 shows IR-free E-I curves and ohmic resistances of the cells using Pt/Nb-SnO2 and Pt/GCB as cathodes (Pt loading, 0.05 mg cm−2) at 80 oC under various
operating conditions, as indicated in the figure caption. The first point to be discussed is that the ohmic resistances of the two cells, or the Pt/Nb-SnO2 and Pt/GCB cathodes,
were approximately the same in the whole current density regions as well as all humidity conditions measured. These resistances largely correspond to those of the electrolyte membranes, not of the CLs, because of the insensitivity of the latter to the application of the frequency of around 10 kHz, due to the presence of the additional large capacitance in the CLs. In spite of the lack of noticeable difference in the resistances, however, the IR-free performances of the cells, or the cathode polarizations, exhibit significant differences, i.e., the performance of the cell with Pt/Nb-SnO2,
measured with air was lower than that of the Pt/GCB cathode at 100% RH but equal at 80% RH and superior to those for Pt/GCB in the low humidity region, from 30 to 53% RH. This dependence of the cathode performances on the humidity should be ascribed to the properties of the cathode CLs. These properties, such as the electronic conductivity of the catalyst supports, protonic conductivity of Nafion binder, or diffusivity of reactant air or product H2O, should be considered as the
performance-controlling factors. In Chapter 2, the fused aggregate structure of the Nb-SnO2 was
found to form fine electronically conductive networks, resulting in orders of magnitude lower cell resistances, which were comparable to that using Pt/CB. Therefore, the electronic conductivity should be excluded as a possible reason for the significant dependence of the performance on humidity. The hydrophilic character of the Pt/Nb-SnO2, which was several-fold higher than that of Pt/GCB, as described above, may play
53
a significant advantageous role in improving the protonic conductivity of the binder in the low humidity condition but may play a disadvantageous role under excess humidification conditions, e.g., at 100% RH. In general, the cell performance in the high current density region is also governed by an increase of the diffusivity of reactants and/or products in the CLs. I will now examine in more detail the effects of proton conductivity and diffusivity of air in the CLs on the properties of both Pt/Nb-SnO2 and
54
The humidity dependences of the cell potentials (IR-free) on the Pt/Nb-SnO2 and
Pt/GCB cathodes for the ORR at 0.4 A cm-2 and the corresponding O2 gains are shown
in Fig. 3-3, which were obtained under pure O2 and air feed. The oxygen gain was
calculated from the difference of the cathode potentials measured for oxygen supply vs. those for air supply at 0.4 A cm-2. The surface of Nb-SnO2 adsorbs water easily
compared with that of GCB, as shown in Table 3-2. This strongly indicates the possibility that the hydrophilic surface of Nb-SnO2 was responsible for the adsorption
of the generated water in the cathode, which contributed to an increase in the proton conductivity of the Nafion binder in the CL at humidities lower than 80% RH; however, in contrast, this led to a decrease in the gas diffusivity by excess swelling under high humidity conditions such as 100% RH.
The potentials both of Pt/Nb-SnO2 and Pt/GCB cathodes for pure O2 increased with
increasing humidity. However, the former showed rather lower performance than the latter, which might be due to a low O2 diffusivity to Pt catalyst sites resulting from
higher swelling of the Nafion binder in the CL of Pt/Nb-SnO2 than that of Pt/GCB, due
to a lower removal rate of produced water under the slow O2 feed conditions. In contrast,
the ORR potentials for air at the Pt/Nb-SnO2 cathode were higher than those of Pt/GCB
in the low to middle humidity region (< 80% RH), which may be attributed to effective use of Pt catalysts, due to effective removal of the water and higher protonic conductivity in the CL with Pt/Nb-SnO2 under the high air flow rate. Beyond 80% RH,
however, this cathode exhibited degradation of the performance presumably by the excess flooding, although those of the Pt/GCB cathode were improved monotonically up to 100% RH by the improved effectiveness of the Pt catalysts with the increase of protonic conductivity in the CL.
55
The O2 gain values at the Pt/Nb-SnO2 cathode decreased with increasing the
humidity from 30 to 80% RH, which was smaller than that of the Pt/GCB cathode. We consider that the smaller O2 gains as well as the superior performance of the
Pt/Nb-SnO2 cathodes for air in the low to middle humidity range were due to the high
effectiveness of Pt, resulting in the superior cathode performances compared to those for the Pt/GCB cathode. This resulted from the high protonic conductivity, brought about by the hydrophilicity of the Nb-SnO2 support. In contrast, both the low
performance and the high O2 gains at 100% RH were due to the low effectiveness of
Pt, which resulted from the low O2-gas diffusivity in the excessively swollen Nafion
binder or the flooded CL with the Nb-SnO2 support. The results described above
suggest clearly the necessity of the suppression of flooding of the CLs with Nb-SnO2
under high RH conditions for the best use of this oxide support, with its advantages for cathode operation.
56
3-3-3 Effect of the addition of GCB on the cell performance
The IR-free polarization curves and the ohmic resistances of the cells using Pt/Nb-SnO2 cathodes with/without various contents of GCB (Pt loading, 0.05 mg cm−2) as
gas-diffusion paths provided by its hydrophobic property, as seen in Table 3-2, and that of the cell using Pt/GCB cathode as a reference at 80 oC under various RH conditions, are shown in Fig. 3-4. The performance of the cell using a Pt/Nb-SnO2 cathode at high humidity
(100% RH) improved significantly by the addition of GCB. The performance of the Pt/Nb-SnO2 cathode with the 38 vol. % of GCB was the highest of all of the cathodes at
100% RH. The details of the correlation between the performance and composition ratio of GCB are presented below.