1
Analyses of Highly Conserved Nucleotide Sequences within
Protein Coding Regions of Eukaryotes
Rumiko Suzuki
Department of Genetics
School of life science
The Graduate University for Advanced Studies
2010
2
ABSTRACT
Nucleotide substitutions in the synonymous sites of codons do not alter amino acid
sequences, therefore they are considered to be basically neutral. In some cases, however,
synonymous sites accept selective constraints.
Requirement for translational efficiency or accuracy enhances the optimum codon usage
and suppress the synonymous changes. Other than this, a certain region of a protein coding gene
may function as exonic splicing signals, RNA editing targets, and RNA secondary structures that
affect on gene expression. There is also possibility that messenger RNAs have interaction with
non-protein coding transcripts. The existence of such functional regions would be detected from
suppression of nucleotide substitution in the area.
Preceding studies have revealed many facts about codon biases and exonic splicing
signals, however, other factors have not been extensively surveyed. The aim of this study is to
explore unknown factors that affect on the nucleotide conservation in the coding regions in
various taxa and to predict potential functionality of the conserved sequences.
For this purpose, I investigated significantly conserved coding sequences (SCCSs) in
orthologous genes in seven taxa: mammals (Homo sapiens, Macaca mulatta, Mus musculus,
3
Rattus norvegicus, Bos taurus, and Canis familiaris), teleosts (Tetraodon nigroviridis, Takifugu
rubripes, Gasterosteus aculeatus, Oryzias latipes), Drosophilas (Drosophila melanogaster, D.
simulans, D. sechellia, D. yakuba, D. erecta, D. ananassae), nematodes (Caenorhabditis elegans,
C. briggsae, C. remanei, C. japonica), dicots (Arabidopsis thaliana, A. lyrata, Vitis vinifera),
monocots (Oryza sativa japonica, O. s. indica, Sorghum bicolor, Brachypodium distachyon), and
budding yeasts (Saccharomyces cerevisiae, S. paradoxus, S. mikatae, S. bayanus). I analyzed the
ratio of preferred codons, or the most frequently used codons for each amino acid, GC content,
and codon degeneracy of SCCSs. The result clarified different characteristics of SCCSs among
the seven taxa. The preferred codon ratio decreases as the conservation length elongates in the
four animal taxa (mammals, teleosts, Drosophilas, and nematodes), while GC content and codon
degeneracy do not show notable fluctuation. This result implies that selection toward optimum
codons may not be the dominant factor in the above taxa.
To extract sequences whose conservation is significantly stronger than others, I took a
permutation approach. I permuted codons of each alignment and surveyed the length and
frequency of invariant sequences in the permuted alignment. In the mammals, the result of
permutation showed significant deviation from the number of invariant sequences in the original
alignments (p < 2.2E-16) but deviation is subtle in budding yeasts. This result implies that the
4
distribution of conserved sites is skewed in mammals, while the distribution is rather
homogeneous in the budding yeasts. I extracted invariant sequences that have significantly low
expectancy (P < 0.01) in comparison with the permutation results and defined them as
significantly conserved coding sequences (SCCSs).
These analyses revealed different characteristics of conserved nucleotide sequences
among the taxa. In mammals and teleosts, it’s not likely that long SCCSs have been retained
solely by amino acid constraint judging from the codon degeneracy and negative correlation
between the conservation length and preferred codon ratio. The sequence characteristics and
skewed distribution of conserved sites predicted from the permutation result suggest that SCCSs
of the above tow taxa have rather preferable traits as functional nucleotide elements.
There are cases that specific RNA secondary structures exert some functions. I
computationally predicted RNA secondary structures of SCCS regions using Vienna RNA
package and detected five SCCSs that form secondary structures of significantly low folding free
energy (P < 0.05). The corresponding regions of platypus and opossum orthologs showed
sequence similarity but the structures are more stable in the placental mammals. Although the
roles of these structures are unknown, strong conservation and significantly low free energy
suggest the possibility that these regions have some functions.
5
As for mammals, I investigated exonic splicing signals and non-protein coding RNAs
that overlaps with SCCSs or non-SCCS coding regions. No significant difference is observed in
splicing signal density between SCCSs and non-SCCS coding regions, however, the component
of non-protein coding RNAs overlapped with SCCSs show difference from those overlapped
with non-SCCS regions. This result suggests that non-protein coding RNAs may have some
association with SCCSs in mammals.
6
Contents
Chapter 1 Introduction
7Chapter 2 Materials and Methods
11Chapter 3 Results and discussion
18Chapter 4 Conclusion 54
Acknowledgements 57
Literature cited 58
Appendix 60
7
Chapter 1
Introduction
The neutral theory of molecular evolution (Kimura 1983; Nei 1987) predicted that
synonymous sites of codons are evolving faster than no synonymous sites because of the weaker
selective pressure. This is true as a whole, however, synonymous sites also accept constraints in
some cases.
Several factors are known to affect on synonymous substitution. One of the well-known
factors is the codon bias toward optimum codons. Optimal codons reflect the composition of the
genomic tRNA pool. As optimal codons are advantageous for fast and accurate translation,
highly expressed or biologically important genes would prefer optimal codons. Changes from an
optimum codon to a non-optimal codon will be suppressed in these genes. Because optimal
codons are similar among closely related species, highly expressed or important genes tend to
have similar codons, therefore synonymous sites will show low substitution. Actually
requirement for translational efficiency or accuracy are reported to reduce nucleotide changes
through purifying selection (Ikemura 1985; Sharp, Li 1987; Akashi 1994; Kanaya et al. 2001;
Akashi 2003). Codon optimization is strong in fast growing organisms, like Escherichia coli or
8
Saccharomyces cerevisiae, but generally weak in organisms that do not show high growing rates
or species of small population size.
Splicing signals embedded in exons (exonic splicing enhancer or silencer) also suppress
the synonymous substitution (Parmley, Hurst 2007; Takahashi 2009). In addition, messenger
RNAs are targeted by various post-transcriptional modification (Licatalosi, Darnell 2010). RNA
editing is one example of post-transcriptional modification, where the target region forms
specific RNA secondary structure for recognition (Bhalla et al. 2004). RNA secondary structure
is also known to associate with regulation of gene expression (Serganov, Patel 2007).
Additionally, recent findings of various non-coding RNAs suggest possibility of interaction
between coding and non-coding RNAs.
Other than the above factors, ultra conserved regions (UCRs) found in non-protein
coding regions can extend to coding exons. In mammals, UCRs are reported to exist near to or
overlap with genes associated with nucleotide binding, transcriptional regulation, RNA
recognition motif, zinc finger domain, and homeobox domain (Bejerano et al. 2004; Schattner,
Diekhans 2006; Lareau et al. 2007). The similar GO terms are reported to be enriched with low
dS genes (Bejerano et al. 2004; Schattner, Diekhans 2006; Lareau et al. 2007). Extensively
conserved nucleotide sequences are also found in Hox genes outside of the homeobox domain
9
(Lin, Ma, Nei 2008). Though the importance of highly conserved regions is assumed from
evolutionary conservation, their functions are largely unknown.
In contrast with the suppressive factors mentioned above, GC rich regions are vulnerable
to mutation through cytosine methylation. Cytosine methylation in vertebrates targets CpG
dinucleotide and convert the cytosine to 5-methyl cytosine (Ticher, Graur 1989; Hurst, Williams
2000). Then 5-methyl cytosine turns into thymine by spontaneous deamination. This process
causes transitional mutation from C to T. Cytosine methylation is observed in vertebrates and
plants but absent or very weak in fruit flies, nematodes, and yeasts.
Thus, nucleotide conservation in the coding regions is affected by various factors. My
hypothesis is that some fraction of the conservation is caused by the existence of regulatory
elements within the coding regions. Although splicing signals and codon biases have been well
investigated by the preceding studies, not many studies have conducted extensive survey on
conserved sequences in coding regions or performed comparison among a wide variety of taxa.
This study focused on local and strong conservation within the coding regions in a wide
variety of taxa and assessed potential functionality of the conserved sequences. Analyses on
codon and nucleotide composition of conserved sequences revealed different characteristics
among the taxa. This suggests the difference of factors that affect on codon conservation.
10
Additional analyses on exonic splicing signals and non-protein coding RNAs in mammals show
little influence of exonic signals and possible contribution of overlapping non-coding RNAs to
the local nucleotide conservation in the coding regions.
11
Chapter 2
Materials and Methods
2.1 Data preparation
I obtained peptide and nucleotide sequences of protein coding genes of six mammalian
species (Homo sapiens, Macaca. mulatta, Mus musculus, Rattus norvegicus, Bos taurus, and
Canis familiaris), four teleost species (Tetraodon nigroviridis, Takifugu rubripes, Gasterosteus
aculeatus, Oryzias latipes), three dicot species (Arabidopsis thariana, A. lyrata, Vitis vinifera),
and four monocot species (0ryza sativa japonica, O. s. indica, Sorghum bicolor, Brachypodium
distachyon) from the Ensembl database (http://uswest.ensembl.org/index.html), six Drosophila
species (Drosophila melanogaster, D. simulans, D. sechellia, D. yakuba, D. erecta, D.
ananassae) from FlyBase (http://flybase.org/), four nematode species (Caenorhabditis elegans,
C. briggsae, C. remanei, C. japonica) from Wormbase (http://www.wormbase.org:80/), and four
budding yeasts (Saccharomyces cerevisiae, S. paradoxus, S. bayanus, S. mikatae) from
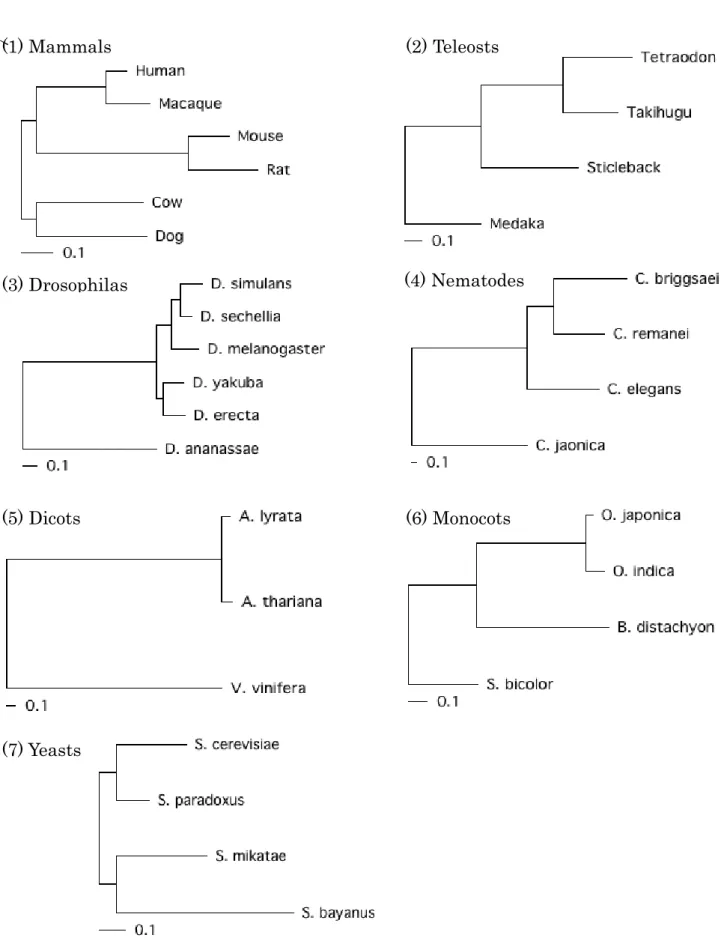
Saccharomyces Genome Database (http://www.yeastgenome.org/). Phylogenies of the species
are shown in Figure 3-1. These trees were drawn based on the averaged branch lengths of the all
gene trees estimated by codeML.
12
Orthology information of each taxon is also obtained from the corresponding databases. I
eliminated one to many and many to many type orthologs and selected 10,790, 11,604, 9,328,
7,102, 3,297, 6,647, and 11,754 single copy ortholog sets for mammals, teleosts, Drosophilas,
nematodes, budding yeasts, dicots, and monocots, respectively. First, multiple alignments of
peptide sequences are constructed using ClustalW (Thompson, Higgins, Gibson 1994), and
nucleotide alignments are constructed based on the peptide alignments. From the nucleotide
multiple alignments I extracted sequences that are invariant for 9 nucleotides (3 codons) or
longer. Gene and sequence data were stored and managed in a database constructed by MySQL
software package.
2.2 Identification of significantly conserved coding sequences (SCCSs)
I performed permutation simulation to identify significantly conserved coding sequences
(SCCSs). In this process, I narrowed down the targeted to ortholog sets that contain invariant
sequences longer than 30 nucleotides (2,309 ortholog sets containing 4,575 SCCSs in mammals).
This is to confine the run time required for the statistical correction within a feasible number. For
an N-codon long alignment, I generated a non-redundant series of random numbers from 1 to N
and permuted the codon sites according to the random numbers. Gap sites are fixed and the rest
13
of the sites are permuted. Then the length and numbers of invariant sequences in the permuted
alignment is surveyed and stored in the memory. This process was repeated 500,000 times per
ortholog set and the result gives a distribution of the length and relative frequency of invariant
sequences. The p-value of an invariant sequence in the original alignment is evaluated based on
the distribution predicted for that alignment. This approach helps identify sequences whose
conservation is rare to occur in the substitution background of each alignment. Multiple testing
correction of the p-values is done by FDR (False Discovery Rate)(Benjamini et al. 2001). Then I
identified invariant sequences with p < 0.01 as significantly conserved coding sequences
(SCCSs).
2.3 Analysis on codons and GC content
For each SCCS, I calculated preferred codon ratio, GC content and average codon
degeneracy. A preferred codon here refers to the most frequently used codons for a given amino
acid. Preferred codons are determined according to codon usage tables provided by Kazusa DNA
Research Institute (http://www.kazusa.or.jp/e/index.html). Because the codon usage is similar
among the species in a taxon, codon tables of H. sapiens, T. nigroviridis, D. melanogaster, C.
elegans, A. thaliana, O. s. japonica, and S. cerevisiae are used as representatives.
14
2.4 GO term enrichment
For mammals, Drosophilas, nematodes, dicots, monocots, and budding yeasts, we
used Fatigo web service (http://babelomics.bioinfo.cipf.es/functional.html) to identify gene
ontology (GO) terms that are significantly enriched with genes that contain SCCSs (SCCS
genes) compared to genes that do not (non-SCCS genes). Fatigo accepts a list of Ensembl
gene IDs as input and provides p-values for enrichment of a GO term in the gene group. The
p-values are calculated by Fisher’s exact test and corrected by FDR (false discovery rate). I
used Ensembl gene IDs of H. sapiens, D. melanogaster, C. elegans, A. thaliana, O. s.
japonica, and S. cerevisiae as input. Because Fatigo does not deal with the teleost and
monocot species I investigated, I performed the same procedure as Fatigo, i.e. Fisher’s exact
test and FDR correction by software package R (Ihaka 1996), to GO terms of T. nigroviridis
and O. sativa japonica,
2.5 Prediction of RNA secondary structures
I computationally predicted secondary structures and free folding energy of SCCSs using
Vienna RNA software package (Hofacker 2009) (http://www.tbi.univie.ac.at/~ivo/RNA/).
Because folding free energy varies depending on the sequence length, I constructed free energy
15
distribution by 1000 randomly chosen sequences for each length (12 to 246 nucleotides). The
p-value for a given free energy was evaluated based on these distributions. Multi testing
correction for the p-values is done by FDR.
2.6 Evaluation of exonic splicing enhancers
As for mammals, I obtained 238 hexamers from RESCUE-ESE Web Server (Fairbrother
et al. 2002) as candidates of exonic splicing enhancers. I counted the number of these hexamers
in SCCS genes and non-SCCS genes, as well as the total nucleotide numbers of the both regions.
The hexamer counting allows overlaps. Then I applied the Fisher’s exact test to the obtained
numbers.
2.7 Exploration for overlaps between non-coding RNAs and SCCSs
I obtained coordinate information of non-coding RNAs in the human and mouse genome
from the Functional RNA Database (Mituyama et al. 2009) (http://www.ncrna.org/). This
database also provides a list of non-coding RNAs that overlaps with protein coding regions.
Based on these information, I identified the types and numbers of non-coding RNAs that overlap
with SCCSs or non-SCCS coding regions.
16
2.8 Analysis on gene expression
We referred to EGenetics (http://www.nhmrc.gov.au/your_health/egenetics/index.htm) to
investigate gene expression of SCCS and non-SCCS genes. Human anatomical system data,
which give information about in what organs a gene is expressed, were obtained from EGenetics
database by way of Ensemble Biomart. For each organ we counted how many of SCCS genes or
non-SCCS genes are expressed. Then we performed the Fisher’s exact test to evaluate the
difference. All p-values were corrected by FDR.
17
Chapter 3
Results and Discussion
3.1 Different characteristics of conserved sequences in the coding regions of
seven taxa
3.1.1 Identification of significantly conserved coding sequences (SCCSs)
I selected single copy orthologs of the group of species (Figure 3-1) and constructed
multiple alignments by ClustalW. Then I extracted nucleotide sequences invariant among the
species. Nucleotide substitution ratio varies among the taxa reflecting the divergence of their
member species. Difference of substitution ratio also exists among genes. This affects on the
length and number of invariant sequences found in the alignments. For example, orthologous
genes that are highly conserved in all the species would have more invariant sequences.
In consideration of these issues, I used permutation test to identify significantly
conserved nucleotide sequences (SCCSs). First, I focused on invariant sequences longer than 30
nucleotides for mammals, 24, 27, 12, 21, 27 and 15 nucleotides for teleosts, Drosophilas,
nematodes, dicots, monocots, and budding yeasts, respectively. These numbers were chosen to
make permutation simulation in the next step to complete in a feasible computational time. Next,
18
the distribution of the length and frequency of invariant sequences is constructed for each
alignment by 500,000 runs of permutation for mammals, 300,000, 450,000, 300,000, 250,000,
400,000 and 300,000 runs for teleosts, Drosophilas, nematodes, dicots, monocots, and budding
yeasts, respectively. The number of run is decided depending on the number of invariant
sequences we focused on.
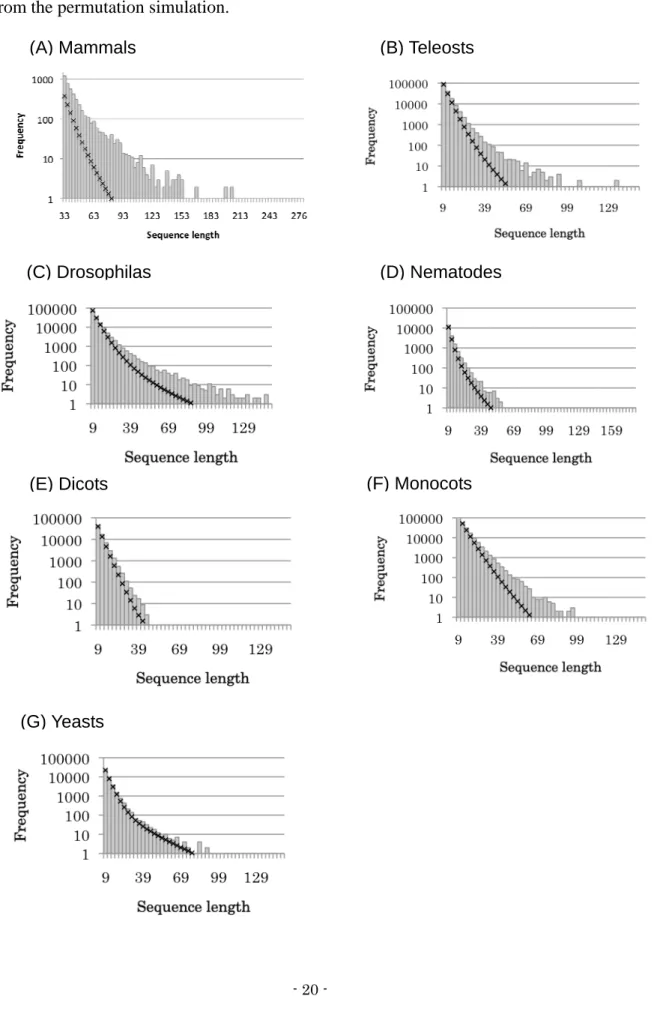
In mammals, teleosts, drosophilas, and monocots, the result of permutation show notably
smaller number of invariant sequences compared with the invariant sequences in the original
alignments (Figure 3-2). The difference between the permutation result and observed number
increases as the conservation length elongates. In nematodes and dicots, the expected number is
slightly lower than the observation. In yeasts, the observation and the permutation result
correspond fairly well.
19
(3) Drosophilas (1) Mammals
(4) Nematodes
(7) Yeasts
(5) Dicots (6) Monocots
Figure 3-1. Phylogenic trees of the species used in this study
Concatenating gene trees constructed by codeML. The root is placed in the middle point of the outmost branch. The scales indices nucleotide distances.
へ (2) Teleosts
- 20 -
Figure 3-2. Number of invariant sequences in original alignments and permuted alignments
X and Y-axes represent the length and frequency of invariant sequences, respectively. Gray bars are observed invariant sequences in the original alignment and black crosses are those obtained from the permutation simulation.
(A) Mammals (B) Teleosts
(C) Drosophilas (D) Nematodes
(E) Dicots (F) Monocots
(G) Yeasts
- 21 -
3.1.2 Length and number of SCCSs
After the extraction of invariant sequences and permutation simulation, the p values of
invariant sequences were determined based on the probability distributions constructed from the
permutation results. All the p-values are adjusted by FDR. I extracted invariant sequences of p <
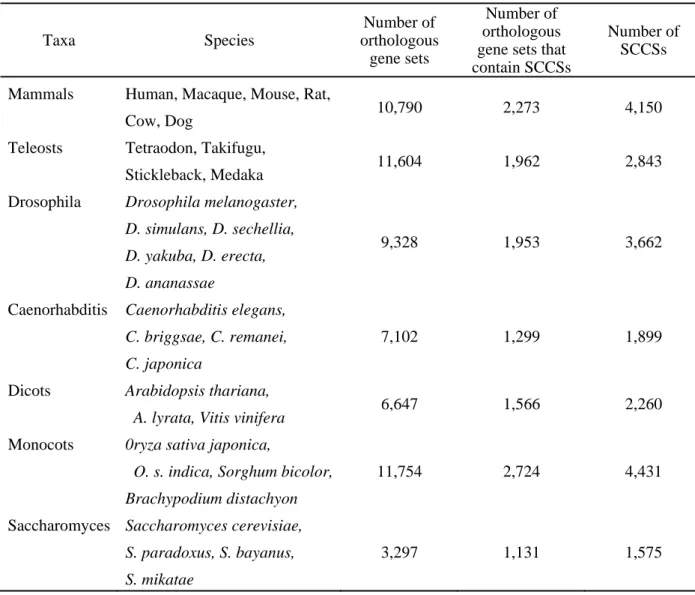
0.01 as significantly conserved coding sequences (SCCSs). Table 3-1 shows the numbers of
SCCSs and number of genes that contain SCCSs (SCCS genes). The full list is shown in
Appendix Table A2. The numbers of SCCSs in the yeast group is small because the difference
between the observed number of invariant sequences and the result of permutation is small.
The bar charts of Figure 3-3 show lengths and numbers of SCCSs in each taxon. The
length and number of SCCSs are influenced by divergence of the member species. The
evolutionary distances among the four nematode species and the three dicot species are larger
than the other taxa. Consequently, the number of SCCSs obtained from nematodes and dicots are
smaller and the length is shorter than others.
- 22 -
Table 3-1. Number of SCCSs and genes that contain SCCSs
Taxa Species
Number of orthologous
gene sets
Number of orthologous gene sets that contain SCCSs
Number of SCCSs Mammals Human, Macaque, Mouse, Rat,
Cow, Dog 10,790 2,273 4,150
Teleosts Tetraodon, Takifugu,
Stickleback, Medaka 11,604 1,962 2,843 Drosophila Drosophila melanogaster,
D. simulans, D. sechellia, D. yakuba, D. erecta, D. ananassae
9,328 1,953 3,662
Caenorhabditis Caenorhabditis elegans, C. briggsae, C. remanei, C. japonica
7,102 1,299 1,899
Dicots Arabidopsis thariana,
A. lyrata, Vitis vinifera 6,647 1,566 2,260
Monocots 0ryza sativa japonica,
O. s. indica, Sorghum bicolor, Brachypodium distachyon
11,754 2,724 4,431
Saccharomyces Saccharomyces cerevisiae, S. paradoxus, S. bayanus, S. mikatae
3,297 1,131 1,575
- 23 -
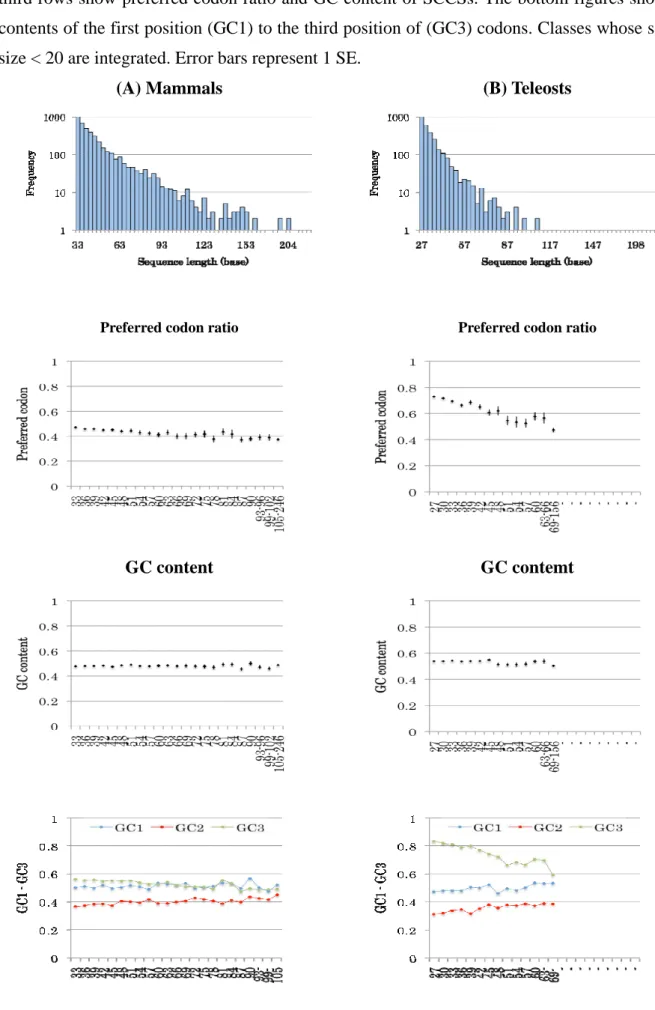
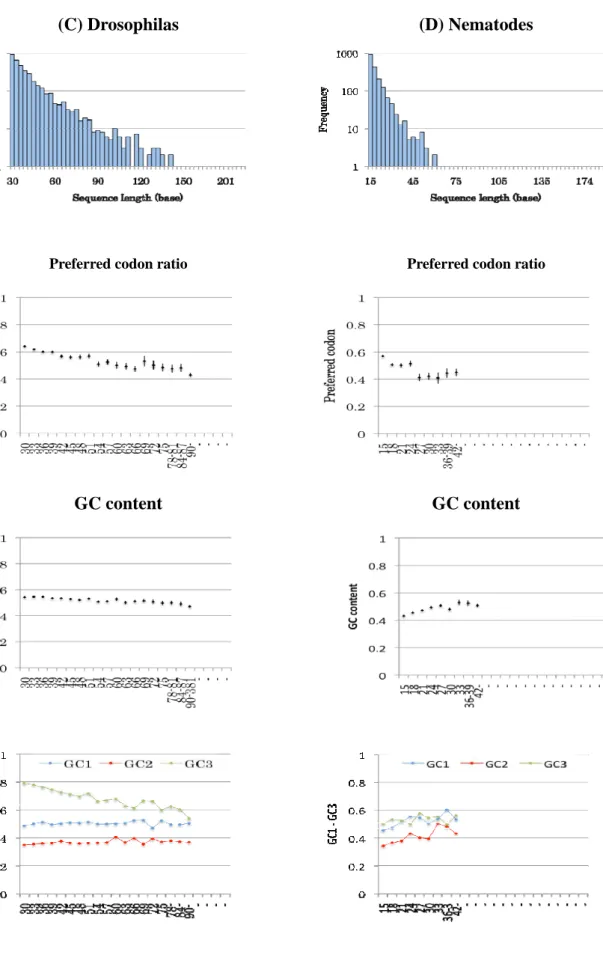
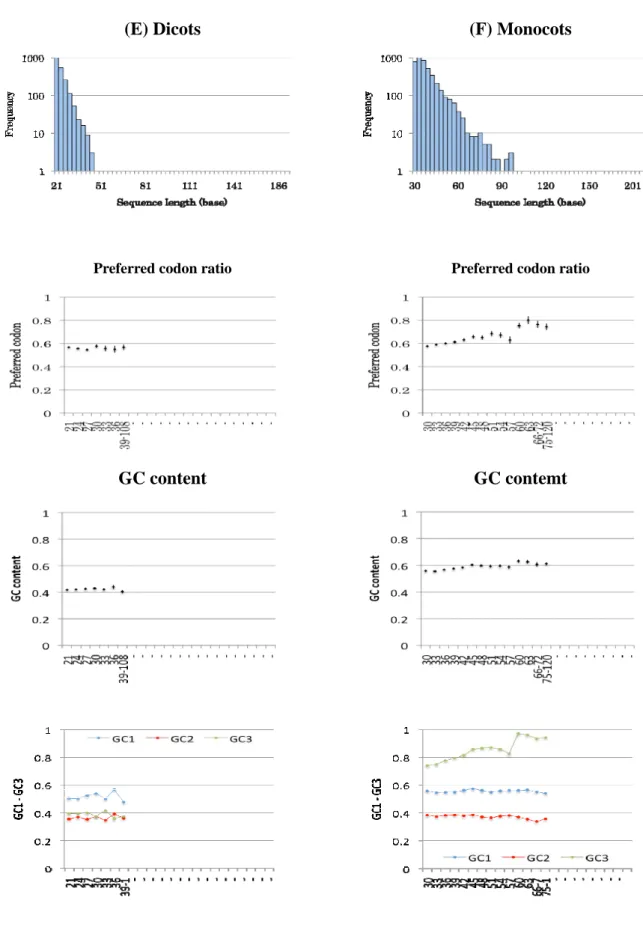
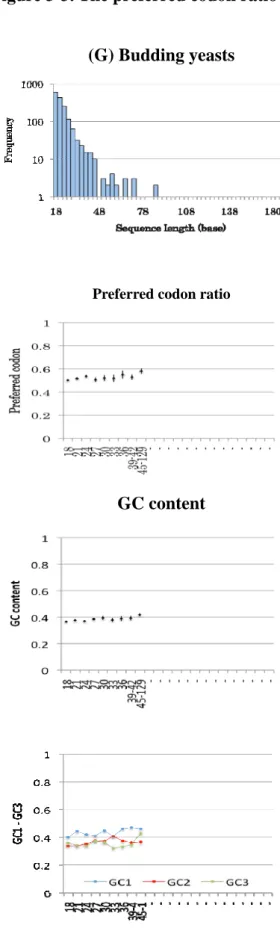
Figure 3-3. The preferred codon ratio and GC content of SCCSs
The blue bars in the top figures indicate the length and frequency of SCCSs. The second and the third rows show preferred codon ratio and GC content of SCCSs. The bottom figures show GC contents of the first position (GC1) to the third position of (GC3) codons. Classes whose sample size < 20 are integrated. Error bars represent 1 SE.
(A) Mammals (B) Teleosts
Preferred codon ratio
GC content
Preferred codon ratio
GC contemt
- 24 -
Figure 3-3. The preferred codon ratio and GC content of SCCSs (continued) .
(C) Drosophilas (D) Nematodes
Preferred codon ratio
GC content
Preferred codon ratio
GC content
- 25 -
Figure 3-3. The preferred codon ratio and GC content of SCCSs (continued) .
(E) Dicots (F) Monocots
Preferred codon ratio
GC content
Preferred codon ratio
GC contemt
- 26 -
Figure 3-3. The preferred codon ratio and GC content of SCCSs (continued) .
(G) Budding yeasts
Preferred codon ratio
GC content
- 27 -
3.1.3 The preferred codon ratio, GC content, and codon degeneracy of SCCSs
Codon usage biases toward optimum codons are known to suppress synonymoussubstitution. Optimal codons reflect the composition of the genomic tRNA pool and
advantageous for translation efficiency or accuracy. I used preferred codons, or most frequently
used codon for an amino acid, as approximate index of optimum codons.
In the mammals, teleosts, Drosophilas and nematodes, there is tendency that the preferred
codon ratio (PC ratio) decreases as the length of SCCS increases. The dicots show constant PC
ratio independent of sequence lengths, while the Monocots and budding yeast show increase of
PC ratio.
Because codon usage is associated with the genomic nucleotide composition, I also
investigated GC content. The GC content shows slight decrease along SCCS length drosophilas,
increase in nematodes, monocots and budding yeasts. Although the overall GC plot seems to be
flat, GC content in the first (GC1), second (GC2) and third position (GC3) of codons varies
greatly. Because most of preferred codons of mammals, teleosts, Drosophilas, and monocots are
GC-ending, the decrease or increase of the preferred codons in these taxa are mainly attributed to
the GC3. On the other hand, nematodes, dicots, and budding yeasts prefer AT-ending codons.
The decrease of preferred codons in nematodes is therefore due to the increase of GC content,
but in this case, not only the GC3 but also the GC1 and GC2. It’s notable that in mammals,
- 28 -
teleosts, and Drosophilas, the decrease of GC3 seems to be partly cancelled out by the increase
of GC1 and GC2 and they come closer as the conservation length elongates.
A precedent study investigated correlation between dS and fraction of optimal codons
(Fop) and detected negative correlations between dS and Fop in rodents (M. musculus and R.
norvegicus), Drosophilas (D. melanogaster and D. yakuba), nematodes (C. elegans and C.
briggsae), budding yeasts (S. cerevisiae and S. paradoxus) and bacteria (E. coli and S.
typhimurium) and positive correlation in human/dog (H. sapiens and C. familiaris), though the
correlation in rodents and human/dog seems subtle (Drummond, Wilke 2008). If the SCCSs have
the same trend as the dS of this study, preferred codon ratio of longer SCCSs would increase in
mice, Drosophilas, nematodes, budding yeasts and decrease in human/dog. My results agree with
this prediction in the budding yeast but not in other taxa. The methodological difference is that
my research focused on local and complete conservation instead of the dS in the entire gene, and
investigated conservation among three to six species instead of pair wise comparison. The
difference of results may suggest that factors working on SCCSs differ from the factors working
on the global conservation.
Judging from the decrease of preferred codons, the long conserved sequences of the four
animal taxa (mammals, teleosts, Drosophilas, and nematodes) are not likely being retained by
codon biases toward optimum codons.
- 29 -
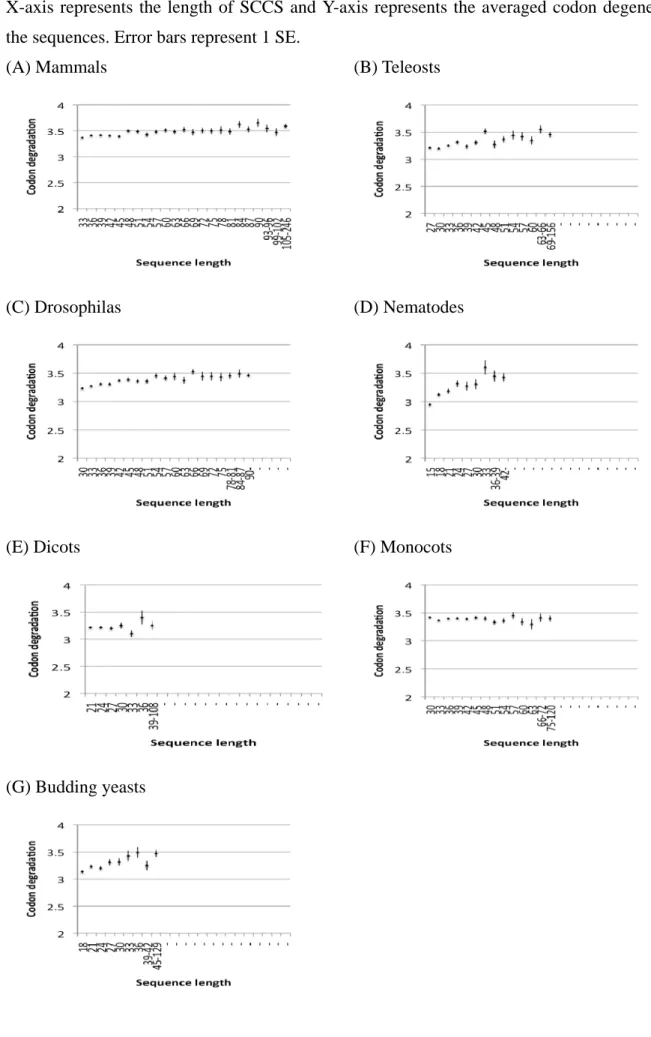
3.1.4 Codon degeneracy of the invariant
SCCSsThough the codon bias toward optimum codon seems not to be the major factor for
retaining long nucleotide conservation in the animal taxa, such conservation may occur by
chance where amino acid constraint is strong and codon degeneracy is low.
To examine this possibility, I investigated codon degeneracy of SCCSs (Figure 3-4). The
averaged degeneracy is constant or slightly increases along the sequence length. In most cases,
the average codon degeneracy is between three and four. Judging from this degree of degeneracy,
the probability is low for a long SCCS to be conserved due to amino acid constraint.
Makalowski and Boguski (1998) showed a correlation between synonymous substitution
rate (dS) and non-synonymous substitution rate (dN). Such correlation may occur when the
constraint on a certain nucleotide sequence is so strong that dN is also lowered.
- 30 -
Figure 3-4. Codon degeneracy of SCCSs
X-axis represents the length of SCCS and Y-axis represents the averaged codon degeneracy or the sequences. Error bars represent 1 SE.
(A) Mammals (B) Teleosts
(C) Drosophilas (D) Nematodes
(E) Dicots (F) Monocots
(G) Budding yeasts
- 31 -
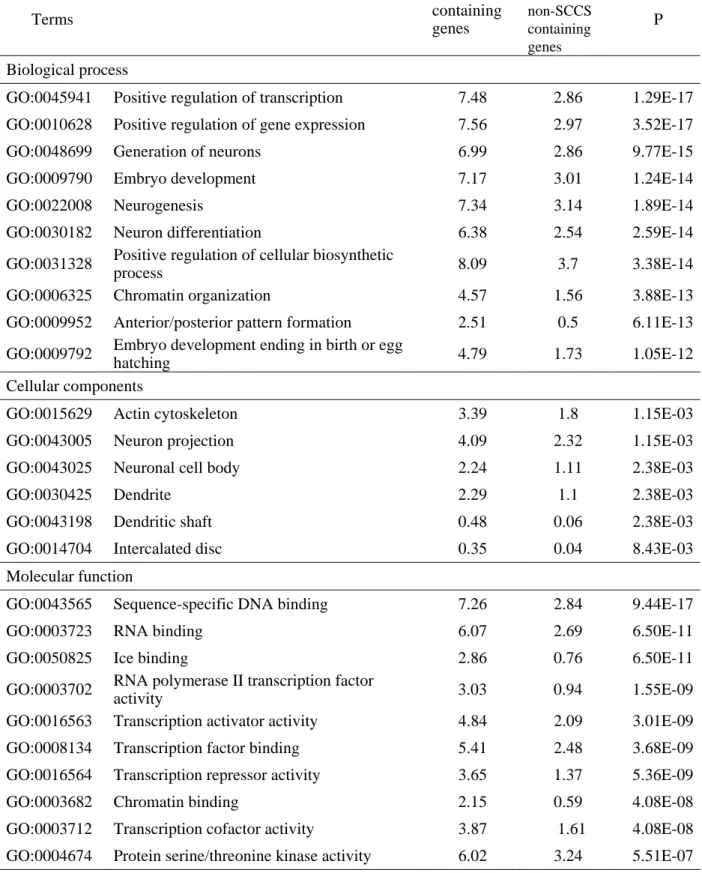
3.1.5 GO terms enriched with genes that contain SCCSs
I explored GO terms significantly (p < 0.01) enriched in SCCS genes compared with
non-SCCS genes (Table 3-2). Terms with the lowest ten probabilities are shown where there are
more than 10 significant terms (full list is shown in Appendix 1). There was no significant GO
term for nematodes.
The terms DNA, nucleotide, or nucleoside binding are commonly observed in the all taxa.
The terms related with transcription and protein kinase activity are notable in mammals, teleosts,
Drosophilas, and monocts. In plants (dicots and monocots) and budding yeasts, ATP binding and
ATPase activity are ranked high. SCCS genes of mammals show close association with neurons
and dendrites compared to other taxa.
Preceding studies report that low dS genes or genes that reside near or overlap with
ultraconserved elements of mammals and the chicken are enriched with these terms (Bejerano et
al. 2004; Schattner, Diekhans 2006). As for the mammalian SCCSs, twenty-eight of them
overlap with the ultraconserved elements (Appendix 2).
- 32 -
Table 3-2. GO terms significantly (P<0.01) enriched with genes that contain SCCSs (A) Mammals
Terms
%in SCCS
containing genes
%in non-SCCS containing genes
P
Biological process
GO:0045941 Positive regulation of transcription 7.48 2.86 1.29E-17 GO:0010628 Positive regulation of gene expression 7.56 2.97 3.52E-17 GO:0048699 Generation of neurons 6.99 2.86 9.77E-15 GO:0009790 Embryo development 7.17 3.01 1.24E-14 GO:0022008 Neurogenesis 7.34 3.14 1.89E-14 GO:0030182 Neuron differentiation 6.38 2.54 2.59E-14 GO:0031328 Positive regulation of cellular biosynthetic
process 8.09 3.7 3.38E-14
GO:0006325 Chromatin organization 4.57 1.56 3.88E-13 GO:0009952 Anterior/posterior pattern formation 2.51 0.5 6.11E-13 GO:0009792 Embryo development ending in birth or egg
hatching 4.79 1.73 1.05E-12
Cellular components
GO:0015629 Actin cytoskeleton 3.39 1.8 1.15E-03 GO:0043005 Neuron projection 4.09 2.32 1.15E-03 GO:0043025 Neuronal cell body 2.24 1.11 2.38E-03
GO:0030425 Dendrite 2.29 1.1 2.38E-03
GO:0043198 Dendritic shaft 0.48 0.06 2.38E-03 GO:0014704 Intercalated disc 0.35 0.04 8.43E-03 Molecular function
GO:0043565 Sequence-specific DNA binding 7.26 2.84 9.44E-17 GO:0003723 RNA binding 6.07 2.69 6.50E-11 GO:0050825 Ice binding 2.86 0.76 6.50E-11 GO:0003702 RNA polymerase II transcription factor
activity 3.03 0.94 1.55E-09
GO:0016563 Transcription activator activity 4.84 2.09 3.01E-09 GO:0008134 Transcription factor binding 5.41 2.48 3.68E-09 GO:0016564 Transcription repressor activity 3.65 1.37 5.36E-09 GO:0003682 Chromatin binding 2.15 0.59 4.08E-08 GO:0003712 Transcription cofactor activity 3.87 1.61 4.08E-08 GO:0004674 Protein serine/threonine kinase activity 6.02 3.24 5.51E-07 Note. The columns ‘% in SCCS containing genes’ and ‘% in non-SCCS containing genes’ represent percentages of genes that are labeled with the GO term in each gene group. P indicates probability for enrichment of the GO term in SCCS containing genes. Terms with the lowest ten probabilities are shown for Biological Process and Molecular function.
- 33 -
Table 3-2 (continued) (B) Teleosts
Terms
%in SCCS
containing genes
%in non-SCCS containing genes
P
Biological process
GO:0006355 Regulation of transcription, DNA -dependent
12.24 5.42 2.13E-16 GO:0006811 Ion transport 3.70 1.68 4.50E-05 GO:0006468 Protein amino acid phosphorylation 7.92 4.72 9.20E-05 GO:0006816 Calcium ion transport 1.71 0.56 2.61E-04 GO:0051056 Regulation of small GTPase mediated
signal transduction
1.13 0.30 9.94E-04 Cellular components
GO:0005634 Nucleus 19.27 10.31 1.35E-14
GO:0005891 Voltage-gated calcium channel complex 0.72 0.06 4.50E-05 GO:0005622 Intracellular 16.23 11.35 2.74E-04 Molecular function
GO:0003700 Transcription factor activity 9.43 3.20 4.74E-21 GO:0043565 Sequence-specific DNA binding 7.39 2.25 8.45E-20 GO:0003677 DNA binding 10.10 4.66 1.02E-12 GO:0008270 Zinc ion binding 16.16 8.95 1.55E-11 GO:0004672 Protein kinase activity 6.92 3.22 9.14E-09 GO:0004713 Protein tyrosine kinase activity 6.05 2.76 3.78E-08 GO:0005524 ATP binding 14.27 8.52 5.78E-08 GO:0003676 Nucleic acid binding 9.67 5.33 1.72E-07 GO:0005216 Ion channel activity 3.54 1.28 1.72E-07 GO:0004674 Protein serine/threonine kinase activity 6.28 3.04 1.99E-07 Note. Terms with the lowest ten probabilities are shown for Molecular function.
- 34 -
Table 3-2 (continued) (C) Drosophilas
Terms
%in SCCS
containing genes
%in non-SCCS containing genes
P Biological process
GO:0030154 Cell differentiation 8.85 8.85 7.89E-05 GO:0044267 Cellular protein metabolic process 11.98 11.98 7.89E-05 GO:0006464 Protein modification process 7.06 7.06 4.28E-04 GO:0016070 RNA metabolic process 10.64 10.64 4.28E-04 GO:0007275 Multicellular organismal development 13.61 13.61 4.53E-04 GO:0043687 Post-translational protein modification 6.04 6.04 4.53E-04 GO:0006355 Regulation of transcription, DNA-dependent 7.47 7.47 1.77E-03 GO:0009059 Macromolecule biosynthetic process 12.49 12.49 1.77E-03 GO:0006350 Transcription 8.65 8.65 1.79E-03 GO:0007166 Cell surface receptor linked signaling
pathway
7.27 7.27 1.79E-03 Cellular components
GO:0016021 Integral to membrane 12.49 8.55 3.37E-05 GO:0031224 Intrinsic to membrane 12.59 8.76 4.25E-05 Molecular function
GO:0008270 Zinc ion binding 10.85 6.89 1.00E-05 GO:0046914 Transition metal ion binding 13.05 8.92 2.88E-05 GO:0017076 Purine nucleotide binding 9.72 6.76 2.70E-03 GO:0000166 Nucleotide binding 11.26 8.26 4.18E-03 GO:0004672 Protein kinase activity 3.38 1.8 4.18E-03 GO:0016773 Phosphotransferase activity, alcohol group
as acceptor
4.4 2.59 4.18E-03 GO:0004674 Protein serine/threonine kinase activity 2.87 1.47 5.32E-03 GO:0016772 Transferase activity, transferring
phosphorus-containing groups
5.37 3.46 9.72E-03 Note. Terms with the lowest ten probabilities are shown for Biological process.
- 35 -
Table 3-2 (continued) (D) Dicots
Terms
%in SCCS
containing genes
%in non-SCCS containing genes
P Biological process
GO:0005975 Carbohydrate metabolic process 7.91 3.74 1.22E-07 GO:0044262 Cellular carbohydrate metabolic process 4.66 1.68 1.52E-07 GO:0007275 Multicellular organismal development 12.64 7.66 1.35E-06
GO:0006810 Transport 14.17 9.2 8.32E-06
GO:0009791 Post-embryonic development 7.91 4.52 7.15E-05 GO:0007017 Microtubule-based process 1.85 0.47 1.38E-04 GO:0048513 Organ development 5.49 2.81 1.38E-04 GO:0051641 Cellular localization 4.91 2.51 3.80E-04 GO:0009165 Nucleotide biosynthetic process 1.98 0.62 5.04E-04 GO:0007018 Microtubule-based movement 1.28 0.27 5.93E-04 Cellular components
GO:0043234 Protein complex 11.17 6.28 7.93E-08 GO:0015630 Microtubule cytoskeleton 2.3 0.55 9.89E-07 GO:0005886 Plasma membrane 12.32 7.64 1.29E-06 GO:0005856 Cytoskeleton 3.19 1.11 3.84E-06 GO:0005794 Golgi apparatus 3.13 1.46 9.90E-04 GO:0016021 Integral to membrane 11.87 8.42 1.03E-03 GO:0000325 Plant-type vacuole 0.89 0.16 1.25E-03
GO:0005773 Vacuole 3.89 2.07 1.38E-03
GO:0031224 Intrinsic to membrane 12.38 9.34 6.81E-03 GO:0034707 Chloride channel complex 0.32 0 7.24E-03 Molecular function
GO:0017076 Purine Nucleotide Binding 22.34 9.88 2.03E-31 GO:0001882 Nucleoside binding 20.49 9.02 6.13E-29 GO:0005524 ATP Binding 19.02 8.4 1.68E-26 GO:0017111 Nucleoside-triphosphatase Activity 9.7 3.12 3.22E-21 GO:0016462 Pyrophosphatase activity 9.89 3.45 2.36E-19 GO:0016818 Hydrolase activity, acting on acid anhydrides, in
phosphorus-containing anhydrides
9.96 3.53 4.25E-19 GO:0016787 Hydrolase activity 21.57 13.21 4.53E-13 GO:0016887 ATPase activity 4.72 1.64 5.08E-09 GO:0016740 Transferase activity 18.83 12.63 1.17E-07 GO:0004386 Helicase activity 2.49 0.68 1.73E-06 Note. Terms with the lowest ten probabilities are shown for Biological Process and Molecular function.
- 36 -
(E) Monocots Terms
%in SCCS
containing genes
%in non-SCCS containing
genes P
Biological process
GO:0006810 Transport 5.66 3.03 3.13E-06
GO:0008152 Metabolic process 9.35 6.00 3.15E-05 GO:0006812 Cation transport 0.89 0.20 3.46E-04 GO:0006468 Protein amino acid phosphorylation 7.24 4.72 6.45E-04 GO:0006350 Transcription 4.25 2.45 8.74E-04 GO:0045449 Regulation of transcription 7.16 4.72 1.04E-03 GO:0030244 Cellulose biosynthetic process 0.41 0.04 4.53E-03 GO:0006355 Regulation of transcription, DNA-dependent 5.99 4.04 6.18E-03 GO:0007047 Cellular cell wall organization 1.00 0.34 6.18E-03 Cellular component
GO:0016020 Membrane 14.50 7.83 1.05E-14
GO:0016021 Integral to membrane 11.73 6.81 1.21E-09
GO:0005634 Nucleus 11.55 8.71 9.21E-03
Molecular function
GO:0005524 ATP binding 18.08 9.98 4.84E-16 GO:0000166 Nucleotide binding 14.60 7.75 1.73E-15 GO:0003824 Catalytic activity 10.91 7.09 1.17E-05 GO:0017111 Nucleoside-triphosphatase activity 3.22 1.45 1.17E-05 GO:0004713 Protein tyrosine kinase activity 6.99 4.41 3.28E-04 GO:0004674 Protein serine/threonine kinase activity 7.20 4.59 3.37E-04 GO:0004672 Protein kinase activity 7.12 4.55 3.43E-04 GO:0016887 ATPase activity 1.60 0.59 3.43E-04 GO:0016757 Transferase activity, transferring glycosyl
groups
2.21 1.01 9.54E-04 GO:0008237 Metallopeptidase activity 0.85 0.22 2.79E-03 Note. Terms with the lowest ten probabilities are shown for Molecular function.
- 37 -
(F) Budding yeasts Terms
%in SCCS
containing genes
%in non-SCCS containing genes
P Cellular components
GO:0000166 Nucleotide binding 18.46 10.52 1.46E-07 GO:0005524 ATP binding 12.54 6.58 2.92E-06 GO:0017076 Purine nucleotide binding 15.19 8.92 1.12E-05 GO:0042623 ATPase activity, coupled 4.86 2.11 1.88E-03 GO:0004713 Protein tyrosine kinase activity 3.09 1.03 2.82E-03 GO:0016887 ATPase activity 5.65 2.72 2.82E-03 GO:0017111 Nucleoside-triphosphatase activity 8.3 4.79 4.09E-03
- 38 -
3.1.7 SCCSs that form stable RNA secondary structures
There are cases that a secondary structure of mRNA conveys functions (Delgado et al.
1998; Bhalla et al. 2004). I examined secondary structures and free energy of the SCCSs using
Vienna RNA package. There are 5 SCCSs whose local folding energy is significantly low (Table
3-3).
Cpt2 encodes a nuclear protein that is transported to the mitochondrial inner membrane.
Together with carnitine palmitoyltransferase I, the encoded protein oxidizes long-chain fatty
acids in the mitochondria. Gal3st3 encodes a member of the galactose-3-O-sulfotransferase
protein family. This protein exists on the membrane of Golgi apparatus. Plod3 encodes a
membrane-bound homodimeric enzyme that is localized to the cisternae of the rough
endoplasmic reticulum. The enzyme (cofactors iron and ascorbate) catalyzes the hydroxylation
of lysyl residues in collagen-like peptides. Polg encodes a catalytic subunit of mitochondrial
DNA polymerase. POLG protein is the only polymerase known to be involved in replication of
mtDNA. Smarcd3 encodes a protein of SWI/SNF family, whose members display helicase and
ATPase activities. This protein is thought to regulate transcription of certain genes by altering the
chromatin structure around those genes.
- 39 -
Table 3-3. Genes that contain an SCCS with significantly low free folding energy
(A) Mammals
Gene Length
Free energy
P
cpt2 Carnitine O-palmitoyltransferase 2 24 -13.4 1E-5
polg DNA polymerase subunit gamma-1 36 -19.9 3.1E-9
plod3 Lysyl hydroxylase 3 27 -20.9 0
gal3st3 Galactose-3-O-sulfotransferase 3 36 -22.6 0
smarcd3 SWI/SNF-related matrix-associated actin-dependent regulator of chromatin subfamily D member
39 -23.9 0
Note. The gene names are represented by those of human.
- 40 -
Figure 3-5 shows probability density of folding free energy constructed by randomly
extracted sequences. Each line shows free energy of the sequences of the same length as the
above five SCCSs. Gene names on the lines represent free energy of the SCCSs. Note that the
lower the free energy, the more stable the structure is. This figure implies the five SCCSs may
form stable secondary structures.
RNA secondary structures of the five SCCSs are shown in Figure 3-6. To explore how far
in the mammalian lineage the structure is conserved, I examined secondary structures of the
corresponding regions in platypus and opossum orthologs. The structure in smarcd3 is conserved
in opossum, though there are two nucleotide differences from the placental mammals. Because
of the two-nucleotide difference, the structure of the placental mammals is more stable. This is
similar for the structures in cpt2 and gal3st3. Two nucleotide differences from platypus or
opossum brought about the stretch of stem structures in the placental mammals.
- 41 -
Figure 3-5. Probability density of folding free energy.
Probability density was created from free energies of randomly extracted sequences (15 to 246 nt) using statistic package R. This graph shows probability density for 24 nt, 27 nt, 36 nt, and 39 nt sequences. The five SCCSs of significantly low energy are indicated on the graph.
- 42 -
Figure 3-6. RNA secondary structures of SCCSs that have significantly low folding free energy
The red circles indicate the sites where the placental mammals can form more stable base pairs than the non-placental mammals.
Mammals (placental) Platypus Opossum
cpt1
-13.4 Kcal/mol -8.4 Kcal/mol -7.4 Kcal/mol
polg
-22.6 Kcal/mol -12.2 Kcal/mol -10.2 Kcal/mol
plod3
-20.9 Kcal/mol -12.0 Kcal/mol -6.2 Kcal/mol
gal3st3
-20.9 Kcal/mol -8.8 Kcal/mol -6.2 Kcal/mol
smarcd3
-23.9 Kcal/mol
No gene data
-18.9 Kcal/mol
- 43 -
Figure 3-7 shows amino acid substitution and nucleotide substitution in the coding
regions of the above five genes. The red triangles at the bottom of the boxes represent SCCSs.
The number of substitution is counted parsimoniously in 30-nucleotide sliding windows. The red
and gray line plots depict nucleotide and amino acid substitutions, respectively. Because the
nucleotide substitution counts include both synonymous and non-synonymous changes, there is
correlation between the amino acid substitution and nucleotide substitution, however, nucleotide
substitution fluctuate in the regions where there’s no amino acid substitution.
These figures show that nucleotide substitution around the SCCSs is not necessarily low,
which indicates that the conservation occurs in a limited area, rather than a part of a low
mutation region.
Although there is no reported on the RNA secondary structure of these genes, there is
possibility that these structures have some functions judging from the strong conservation and
significantly low free energy.
- 44 -
Figure 3-7. Amino acid substitution and nucleotide substitution in the SCCSs
The box represents an alignment. The red and gray line plots indicate nucleotide and amino acid substitution, respectively. The red triangles on the bottom of the boxes represent SCCSs with significantly low free folding energy. The green triangles represent other SCCSs in the same alignment. Alignment gaps are shaded in gray.
(A) cpt2
(B) polg
(C) plod3
(D) gal3st3
(E) smarcd3
- 45 -
3.2 Additional analysis on conserved nucleotide sequences
in the coding regions of mammalian species
3.2.1 The density of exonic splicing enhancers in SCCSs and non-SCCS coding
regions
One of the well known functional nucleotide elements in the coding region is splicing
signals. We obtained 238 hexamers from RESCUE-ESE Web server as candidates of exonic
splicing enhancers, and counted the number of hexamers in SCCSs and the entire protein-coding
regions of the human genome (Table 3-5). Then I calculated the density of hexamer and applied
chi-square test. The density of hexamers is slightly lower in SCCSs than other regions and the
difference is significant at 0.05 significance level (p=0.013). This result implies that splicing
signals have little influence on SCCSs.
Table 3-5
Region size No. of hexamer (per nucleotide)
SCCS genes 192,314 nt 20,42 (0.106/nt)
Non-SCCS genes 73,367,573 nt 7,950,888 (0.108/nt)
- 46 -
3.2.2 Overlaps between SCCSs and non-protein coding RNAs
Recent advancement of RNA research revealed abundant non-protein coding RNAs in the
cell. Most of them derive from intergenic or intronic regions but some of them overlap with
coding regions. Such non-coding RNAs may affect on nucleotide substitution in coding regions.
If a non-coding RNA overlapping with a coding sequence contains functional nucleotide element,
nucleotide substitution in the coding region that corresponds with the functional element will be
suppressed.
For this reason, I surveyed non-coding RNAs that overlap with SCCSs. As the result, I
identified 962 ncRNAs overlapping with SCCSs (Table 3-6). Functions of antisense RNA,
miRNA, piRNA, 5’ UTR regulatory element are validated to some extent but functions of other
categories are less clear. ‘NcRNA’ namely represents non-coding RNA, refers to uncategorized
transcripts in general. ‘Mature transcripts’ have polyA and the 5’ cap like regular messenger
RNAs but seemingly do not produce proteins. ‘Non coding conserved regions’ are defined by
Evofold (Pedersen et al. 2006) or RNAdb (Pang et al. 2005). These regions are predicted by the
evolutionary conservation and the secondary structure but do not necessarily produce transcripts.
Thought named ‘non-coding’, not a few of them overlap with coding regions.
The overlap of the SCCS in CHPF2 and micro RNA (miR-671) is shown in Figure 3-7A.
The CHPF2 gene encodes chondroitin sulfate glucuronyltransferase. The bar pointed by the blue
- 47 -
arrow represents the precursor of mir-671. The thicker part of the bar corresponds to the mature
miRNA. The SCCS covers the mature miRNA region. Mir-671 was identified through extensive
analysis of small RNAs but its target is not known. Figure 3-7B shows the overlap of the SCCS
in the SPI1 gene and 5' UTR regulatory element. SPI1 is an ETS-domain transcription factor that
activates gene expression during myeloid and B-lymphoid cell development. 5' UTR regulatory
element of the SPI1 gene was identified from a highly conserved region between human and
mouse. The 5’UTR regulatory element inhibits translation in vitro, however, the effect of this
element is negligible in vivo. This regulatory element extends to the coding region and overlaps
with the SCCS. The SCCS continues 12 nucleotides upstream of the 5’ UTR element. This
excess region may also be involved in the regulatory element. These examples of known
functional elements support the idea that functional nucleotide elements in the coding region
may be detected by strong nucleotide conservation.
The component of overlapping non-coding RNAs is different between the SCCSs and the
non-SCCS coding regions. The SCCSs have less overlap with piRNAs and more overlaps with
ncRNAs. Although function of ncRNAs is largely unknown, they may have some association
with SCCSs.
- 48 -
Table 3-6. Non-protein coding RNAs that overlap with SCCSs Type of ncRNA # in SCCSs # in non-SCCS
coding regions
# in both coding and non-coding Function known
Antisense RNA 35 1,297 2,771
piRNA 31 3,002 10,4243
5’ UTR regulatory element *1 2 8 16
(Pre) miRNA 2 78 1,695
Others 0 75 7,056
Function unknown
ncRNA*2 406 7,492 34,156
Mature transcript *3 6 285 1,132
Non-coding conserved region *4 480 12617 84,964
Total 962 24853 236,032
Note. NcRNAs corresponding to SCCSs are selected from exon-overlapping ncRNAs stored in the database and from those of blast hits with E <= 1e-4. The number in the parenthesis denotes ncRNAs detected by blast hits. The number of ncRNAs registration in the database is shown in the fight column. The type of ncRNA is following to Sequence Ontology database (http://www.sequenceontology.org/index.html). *1: 5' UTR regulatory element of Spi1 (spleen focus forming virus proviral integration oncogene). *2: RNA transcripts that do not encode proteins. *3: RNA transcripts that have undergone processing of splicing and modifications to the 5' and/or the 3', but are not necessarily translated. *4: Non-coding regions (may partially overlap with coding regions) that retain similarity by descent from the common ancestor. The number in the databases indicates the number of human’s ncRNAs.
- 49 -
Figure 3-8. The components of non-protein coding RNAs that overlap with SCCSs, non-SCCS coding regions, and both coding and non-coding regions.
(A) SCCS
(B) Non-SCCS coding region
(C) Both coding and non-coding regions
- 50 -
Figure 3-9. Overlap of SCCSs with non-protein coding RNAs of known function. The red arrow represents an SCCS and the blue arrow represents an ncRNA.
(A) The SCCS in CHPF2 and miR-671
(B) The SCCS in SPI1 and 5' untranslated region (UTR) regulatory element
- 51 -
3.2.3 Gene expression
I investigated difference of gene expression between SCCS genes and non-SCCS genes
referring to anatomical system data of EGenetics, which give qualitative information about in
what organs a gene is expressed. I counted the number of SCCS genes and non-SCCS genes
expressed in the organs and performed the Fisher’s exact test as described in Materials and
Method section.
In general, higher percentage of SCCS genes is expressed in the organs than non-SCCS
genes. Table 3-7 shows organs with the lowest 20 p-values where the percentage of expressed
genes is higher in SCCS genes than non-SCCS genes. The difference is significant in all the
twenty organs. Table 3-8 shows organs with the lowest 20 p-values where the percentage of
expressed genes is lower in SCCS genes than non-SCCS genes. The difference is significant only
in medulla oblongata and trophoblast.
It is notable that the significantly higher ratio of SCCS genes is expressed in the new
brain as frontal lobe, while the significantly lower ratio of SCCS genes is expressed in the old
brain as medulla oblongata. SCCS genes also show high expression in organs involved with
mammalian specific reproduction specific to mammals such as breast, uterus, and endometrium.
- 52 -
Table 3-7. Organs with the lowest 20 p-values where the percentage of expressed genes is higher in SCCS genes than non-SCCS genes
Organ SCCS Non-SCCS P
#Express ed
#Not-exp ressed
%expresse d
#Express ed
#Not-exp ressed
%express ed
Breast 1133 905 55.59% 2430 3491 41.04% 7.68E-28 Frontal lobe 899 1139 44.11% 1803 4118 30.45% 1.05E-26 Thyroid 1076 962 52.80% 2375 3546 40.11% 1.44E-21 Cochlea 436 1602 21.39% 723 5198 12.21% 4.00E-21 Head and neck 1089 949 53.43% 2437 3484 41.16% 2.38E-20 Brain 1798 240 88.22% 4686 1235 79.14% 8.73E-20 Germinal center 1154 884 56.62% 2653 3268 44.81% 6.90E-19 Skeletal muscle 1252 786 61.43% 3003 2918 50.72% 7.57E-16 Retina 1360 678 66.73% 3372 2549 56.95% 7.68E-14 Parathyroid 1166 872 57.21% 2796 3125 47.22% 9.43E-14 Visual apparatus 1261 777 61.87% 3079 2842 52.00% 1.02E-13 Skin 1571 467 77.09% 4057 1864 68.52% 1.05E-12 Heart 1423 615 69.82% 3601 2320 60.82% 2.15E-12 Larynx 642 1396 31.50% 1385 4536 23.39% 7.78E-12 Amygdala 201 1837 9.86% 318 5603 5.37% 1.06E-10 Uterus 1553 485 76.20% 4056 1865 68.50% 2.20E-10 Bone marrow 939 1099 46.07% 2257 3664 38.12% 2.26E-09 Endometrium 1177 861 57.75% 2961 2960 50.01% 1.02E-08 Pituitary gland 421 1617 20.66% 877 5044 14.81% 1.08E-08 Blood 1204 834 59.08% 3051 2870 51.53% 2.14E-08