Genetic Structure of East African Populations
Based on HLA Class I Genes
Aamer, Waleed Hussein Omer
Doctor of Philosophy
Department of Genetics
School of Life Science
SOKENDAI (The Graduate University for
Advanced Studies)
Genetic Structure of East African
Populations Based on HLA Class I Genes
PhD thesis
Aamer, Waleed Hussein Omer
The Graduate University for Advanced Studies (SOKENDAI)
School of Life Science
Department of Genetics
December 2016
ii
Acknowledgments
I would like to thank everyone who made this work possible especially:
- My supervisor Professor Ituro INOUE for his patient, encouragement, guidance and personal support.
- Dr. Hirofumi Nakaoka for the unlimited support and continuous advice.
- Participants who gave their samples in this study are much appreciated.
- My colleagues at the division of human genetics and all of the other colleagues, thank you for providing the good scientific and friendly environment that was very helpful for me to do the work.
- Last not least, I would like to express my worm and deep gratitude to my lovely family. I really feel indebted to them for their continuous support and patient; my wife Huda, my son Sanad, my father Hussein, my mother Fatima, my brother Adil and my sisters Safa, Samar and Iman, I can't even find the words to express my love and care, but thank you for everything.
I also would like to thank MEXT for providing the scholarship during my stay in Japan, which made my dream possible.
iii
Contents
Acknowledgments... ii
List of Tables ... vi
List of Figures ... vii
Summary ... ix
1.1 Background ... 1
1.1 Genomic organization of MHC loci ... 2
1.2 Structure of MHC molecules ... 3
1.2 Function of MHC molecules ... 4
1.3 HLA and disease associations ... 6
1.3 Evolution of MHC loci ... 7
1.3.1 HLA genes evolve through segmental duplications and insertion/deletions ... 9
1.3.2 Natural selection in the HLA loci ... 11
1.3.1.1 Balancing selection as a driving force for HLA gene evolution ... 11
1.4 Nomenclature of HLA alleles/genes... 13
1.4 HLA typing... 16
1.4.1 HLA typing methods ... 16
1.4.2 Ambiguity in HLA typing ... 17
1.4.3 HLA typing using next-generation sequencing ... 18
1.5 HLA and genetic diversity in human populations ... 18
1.5.1 Genetic diversity of East African populations ... 18
1.5.2 History, linguistic, and genetic diversity of Sudanese population ... 19
Rationale ... 23
2.1 Sample information ... 25
2.2 Targeted sequencing of HLA genes ... 29
2.2.1 NGS library preparation and target enrichment protocol ... 29
2.2.1.1 Fragmentation and purification ... 29
iv
2.2.1.2 Amplification and adapter ligation ... 30
2.2.1.3 Hybridization step SeqCap EZ protocol ... 31
2.2.1.4 Amplification of post-capture library ... 32
2.2.2 Sequencing of the prepared library ... 33
2.3 Bioinformatics analysis ... 34
2.3.1 Quality control of NGS data ... 36
2.3.2 Mapping sequencing reads to the reference genome (hg19, GRCh37) ... 36
2.3.3 Phasing haplotypes from BAM files ... 37
2.3.4 Variant calling and building haplotype sequence ... 38
2.3.5 Determining genotypes of HLA genes ... 38
2.4 Sanger sequencing of new HLA alleles ... 40
2.5 Population genetics analysis ... 40
2.5.1 Allele frequencies and heterozygosities ... 40
2.5.2 Hardy-Weinberg equilibrium test ... 40
2.5.3 Measuring genetic distances ... 41
2.5.4 Ewens-Watterson homozygosity test of neutrality ... 41
2.5.5 Estimation of haplotype frequencies ... 42
2.5.6 Detection of ancestry-informative alleles ... 42
2.5.7 Estimation of linkage disequilibrium ... 43
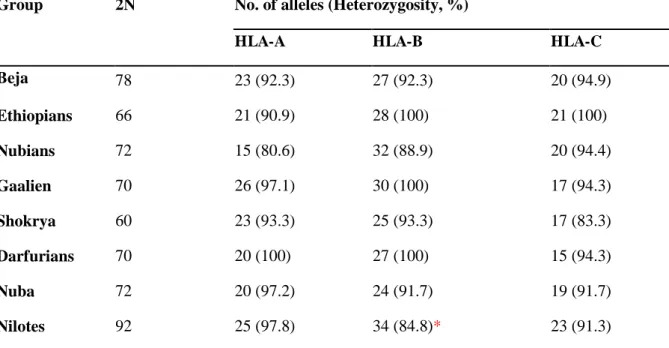
3.1 Measures of genetic diversity ... 44
3.1.1 Number of alleles and heterozygosity ... 44
3.1.2 Population differentiation ... 46
3.2 Test of Natural selection ... 48
3.3 Identification of new HLA alleles... 49
3.4 Common HLA alleles in the study populations ... 52
3.5 Identification of ancestry-informative alleles ... 55
3.6 Finding common shared haplotypes ... 66
v
3.7 Linkage disequilibrium between cluster 3 alleles ... 70
3.8 Searching for the ancestral haplotypes of Arab groups ... 73
4.1 HLA class I diversity of East African groups ... 78
4.2 Genetic structure of East African groups ... 79
4.3 Searching for the ancestry-informative haplotypes of Arab groups ... 82
Conclusions ... 85
References ... 86
Appendices ... 95
Appendix 1 ... 95
Appendix 2 ... 96
vi
List of Tables
Table 1.1: Previous HLA studies conducted in Sudan……….24
Table 2.1: Geographic distribution and linguistic affiliation of 8 East African populations...28 Table 3.1: Number of alleles and heterozygosity in HLA class I genes of eight East groups 45
Table 3.2: Fst indices for pairs of eight east African populations………47
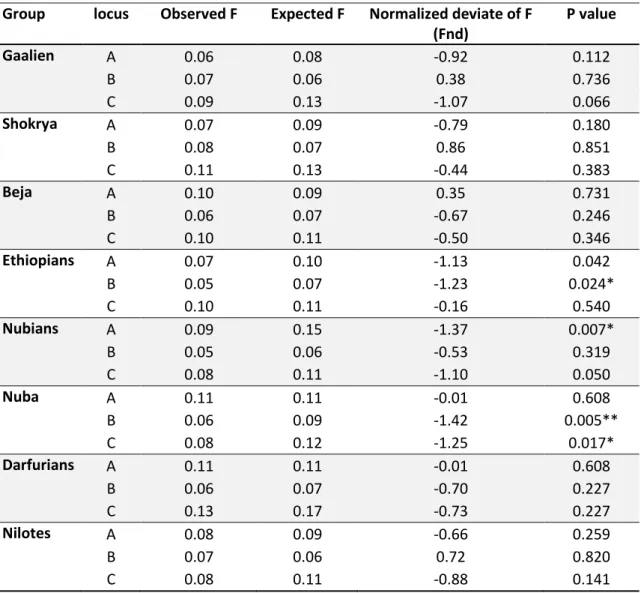
Table 3.3: Ewens-Watterson test of selective neutrality for eight East African groups …….48
Table 3.4: New HLA alleles found in Nubians and Darfurians populations… ………..50 Table 3.5: Most frequent HLA class I alleles among Afro-Asiatic groups (≥5%)…………..53
Table 3.6: Most frequent HLA class I alleles among Nilo-Saharan groups (≥5%)………….54
Table 3.7: Most common HLA class I alleles among Nilo-Saharan/Niger-Congo groups (≥5%)………54
Table 3.8: The most frequent HLA class I haplotypes among the study populations………..68 Table 3.9: Common HLA class I haplotypes in the Arab groups………69
Table 3.10: Most common 2-loci haplotypes (HLA-B & HLA-C) in Arab groups…..……..69
Table 3.11: Frequency of B*51:01-C*15:02 and B*52:01-C*12:02 haplotypes in various
population ………74
Table 3.12: Frequency of A*03:02-C*12:02-B*52:01 and A*11:01-C*12:02-B*52:01
haplotypes in various populations ………..75
Table A.1: Data sets downloaded from the AFND database………..……….96
vii
List of Figures
Figure 1.1: Genomic organization of the HLA loci ………. 2
Figure 1.2: Antigen presentation pathway of MHC class I & II molecules ………..5
Figure 1.3: Evolution of adaptive immune system………...8
Figure1.4: A screen shot from UCSC genome browser showing segmental duplication in HLA class I region ………. 10
Figure 1.5: Criteria for nomenclature of HLA alleles/genes………14
Figure 1.6: Number of HLA class I & II alleles in the IPD-IMGT/HLA database…………..15
Figure 1.7: Major linguistic families in Africa……….21
Figure 2.1: Approximate locations of populations in this study………..27
Figure 2.2: Overview of the analytical pipeline used in this study………..35
Figure 3.1: Neighbor-Joining phylogenetic tree based on Fst indices in Table 3.2………...47
Figure 3.2: New HLA class I alleles found in Nubians group……….……50
Figure 3.3: New HLA class I alleles found in Darfurians group ………51
Figure 3.4: Percentage of variances explained by each principal component……….57
Figure 3.5: PCA analysis of class I HLA genes in eight east African populations…………..58
Figure 3.6: PC scores of the 1st and 2nd principal components in class I HLA genes of eight east African groups ………..59
viii
Figure 3.7: Frequency distribution of cluster 1 alleles in the PC scores plot of Figure 3.6.... 60 Figure 3.8: Frequency distribution of cluster 2 alleles in the PC scores plot of Figure 3.6… 61
Figure 3.9: PCA of class I HLA genes in eight east African populations ………...62
Figure 3.10: PCSs of the 2nd and 3rd PCs in class I HLA genes of eight east African
group...63
Figure 3.11: Frequency distribution of clusters 1 & 2 alleles in the PCS plot of Figure
3.10………...64
Figure 3.12: Frequency distribution of cluster 3 alleles in the PCS plot of Figure 3.10…...65 Figure 3.13: Pairwise linkage disequilibrium (D`) between HLA alleles of common
haplotypes in Gaalien group……….71 Figure 3.14: Pairwise linkage disequilibrium (D`) between HLA alleles of common
haplotypes in Shokrya group ………...72 Figure 3.15: PCA of class I HLA genes in populations from Africa, Middle East and
Europe………..77
Figure A.1 Distribution of HLA data records per geographical region in the Allele Frequency
Net Database ………95
ix
Summary
East Africa is characterized by high levels of genetic, linguistic, and cultural diversity. Studies have shown that, in Africans, there is a strong correlation between genetic and linguistic families. Focusing on the Sudanic region of East Africa, a recent study based on genome-wide SNP data found two substructures in the Sudanese population. These two substructures were related to the Afro-Asiatic and Nilo-Saharan/Niger-Congo linguistic families. Furthermore, the Afro-Asiatic family contains several groups with different genetic backgrounds, which requires further differentiation. Here I studied the genetic diversity of HLA class I genes in eight ethnic groups from East Africa. The samples I used represent three countries in East Africa: Sudan, South Sudan and Ethiopia. The samples from Sudan have a wide geographical distribution and all samples belong to one of three known African linguistic families: Afro-Asiatic, Nilo-Saharan, and Niger-Congo.
I first sequenced the samples using next-generation sequencing on the Miseq platform. Then, I analyzed the sequence data and identified HLA-A, HLA-B, and HLA-C genotypes. While identifying the genotypes, I found four mutations not previously described in the sequence database, which can be considered to be new HLA alleles. I then confirmed all of the new mutations by Sanger sequencing. The HLA genotypes were then used to calculate allele frequencies and determine the distribution of allele frequencies in each group. To find out how diverse the study populations are, I calculated heterozygosity and Fst values, which indicated a high level of heterozygosity and population differentiation.
To examine the population structure, I performed principal component analysis (PCA) using the calculated allele frequencies. I found that most of the variances were explained by the first and second principal components. The PCA identified three clusters that correlated with the linguistic families of the study groups. The first cluster was defined by alleles common to
x
the Nilo-Saharan groups, the second cluster was defined by alleles that are common in Afro- Asiatic groups, and the third cluster was defined by alleles of the Sudanese Arab groups. Interestingly, the division in cluster 3 between Arabs and other groups within the Afro- Asiatic family was not previously seen in SNP data, suggesting the possibility of further differentiation within this family.
For further analysis, I focused on cluster 3 and investigated whether the identified alleles form haplotypes. I estimated haplotype frequencies and compared them to the PCA clustering patterns. I found that alleles of the most common haplotypes are also found in the same cluster and those alleles are informative for differentiation between groups because they have similar patterns of allele frequency distribution.
Having identified the informative haplotypes in cluster 3, I checked whether they are tightly linked by estimating pairwise linkage disequilibrium (LD) between alleles of the three HLA loci. I observed that the HLA-B and HLA-C alleles are in perfect LD most of the time. On the other hand, the HLA-A alleles show lower LD values, which are expected as LD decays with an increase in physical distance along the chromosome.
Furthermore, I decided to trace the ancestry of cluster 3 alleles, so I searched for the haplotypes common in the Sudanese Arabs in other populations in the Allele Frequency Net Database (AFND), which is the largest database for global distribution of HLA alleles. Interestingly, the most common two-locus haplotypes (HLA-B and HLA-C) among Arab groups were not found in all Sub-Saharan African populations and were found mainly in populations from Asia, Europe, and North America. More interestingly, I found that the most common B-C haplotype among Sudanese Arabs (B*51:01-C*15:02) has a frequency of 4.7% in the Saudi Arabian population.
xi
Finally, finding cluster 3 alleles exclusively outside of Africa strongly suggested that the Sudanese Arab groups have experienced gene flow from non-African sources. To understand further the population structure of the Sudanese groups in the context of other populations, I downloaded data from the AFND database, including on populations from Sub-Saharan Africa, the Middle East, and Europe, and merged them with the data from East Africa. PCA on the integrated data sets confirmed the previously seen clustering patterns in our own data. Intriguingly, the PCA of the merged data sets showed that Arab groups from Sudan are the closest to all non-African populations, particularly populations from the Middle East like the Saudi one.
In conclusion, this study identified four new HLA alleles and established a map of HLA class I allele and haplotype frequencies in Sudan. I also found a substructure within Afro-Asiatic groups, which separates Sudanese Arabs from non-Arab groups. The identified substructure seems to have been affected by gene flow from West Asia or the Middle East.
1
Chapter One
INTRODUCTION
1.1 Background
The human major histocompatibility complex (MHC) [in humans also called the human leukocyte antigen (HLA); I will use these two terms interchangeably] is a genomic complex located on 6p21.31. Spanning 3.6 Mb of the human genome, HLA loci have been associated with many diseases (Gough et al. 2007), making HLA the loci with the highest number of disease associations. The numerous diseases associated with HLA loci include type I diabetes (TID), rheumatoid arthritis (RA), and many other diseases related to the immune system. Two main features make HLA interesting genomic loci. The first is the higher gene density compared with the rest of the genome (224 genes according to the MHC Sequencing Consortium 2009, see section 1.2). The second, and most important, is the highly polymorphic nature of many genes located in this region (the IPD-IMGT/HLA database currently contains over 4000 HLA-B alleles, Robinson et al. 2015). Several types of variation have been observed in the HLA complex, including single-nucleotide polymorphisms (SNPs), insertion-deletions (INDELs), large segmental duplications (>1000 bp), and copy number variations (Gaudieri et al. 2000). The accumulation of these variations in the HLA genes ultimately led to an increase in genetic diversity at the population level. Such increased diversity provides valuable markers for population genetics and disease association studies. Furthermore, comparative analysis of HLA genes in the same/different populations offers an ideal tool for tracing past demographic events, understanding variations in disease susceptibility, and studying variability in the effects of drugs between different groups/populations.
2
1.1 Genomic organization of MHC loci
In 1999, the MHC Sequencing Consortium published the first complete sequence and map of all genes within the MHC loci (MHC Sequencing Consortium 1999), in which 224 genes were identified. Historically, MHC loci have been categorized into three classes based on gene localization and functional similarities between genes in the same cluster. The first cluster of genes is the MHC class I genes, which is located toward the telomere and includes the classical HLA-A, HLA-B, and HLA-C genes and non-classical genes such as HLA-G and HLA-E (Figure 1.1). The second cluster is class II genes, which includes classical genes such as HLA-DPA, HLA-DPB, HLA-DRA, HLA-DRB, HLA-DQA, and HLA-DQB, in addition to other non-classical genes. Both class I and class II have numerous pseudogenes; although there is no evidence for their expression, they may play a role in MHC evolution and the emergence of new HLA genes/alleles (MHC Sequencing Consortium 1999). In contrast to class I and II genes, the third cluster, class III genes, does not contain many pseudogenes, but it is very dense with genes related to the immune system. The genes located in this cluster (class III) include several complement genes and the tumor necrosis factor alpha (TNF-α) gene (Horton et al. 2004).
Figure 1.1: Genomic organization of the HLA loci Class II
6p21.1-21.3
Chr. 6
A C B DR DQ DP
G
F E DM
Class III Class I
TNF
3
1.2 Structure of MHC molecules
The protein products of MHC class I & II genes (here called “molecules”) are transmembrane glycoproteins present on the surface of all nucleated cells and antigen-presenting cells (APCs), respectively. Although MHC class I and II molecules perform similar functions in antigen presentation, there are some differences in their structures. Class I MHC molecules are heterodimer proteins composed of α and β chains. The α chain is a polypeptide encoded by one of the classical class I genes (i.e., HLA-A, HLA-B, or HLA-C). The β chain is encoded by the β2 microglobulin gene, which is not part of the MHC loci and located on chromosome 15. The α chain itself is organized into three domains: an extracellular domain composed of α1 and α2 and part of the α3 domain, a transmembrane domain, and a cytosolic domain contained in α3. The extracellular position of the MHC proteins facilitates interaction with T cells as part of their function. Such interaction is possible due to the formation of what is called a peptide-binding pocket (also known as a peptide-binding cleft), which in class I is found at the top of the molecule between the α1 and α2 domains. Furthermore, intracellular interaction is also possible through the transmembrane part of the α3 domain. At the genomic level, the α1 and α2 domains are encoded by exons 2 and 3 in all class I genes and the α3 domain is encoded by exon 4 of these genes. On the other hand, class II molecules consist of two polypeptides, the α and β chains, each of which has two extracellular domains (α1 and α2 for the α chain and β1 and β2 for the β chain). The overall organization is mainly similar to that of class I molecules; however, in class II molecules, the two polypeptides are encoded by genes located in the MHC loci. The peptide-binding cleft in class II molecules is found between the α1 and β1 domains, and also at the top of the molecule. The α2 and β2 parts non- covalently interact and also bind to the membrane (Owen et al. 2013).
4
1.2 Function of MHC molecules
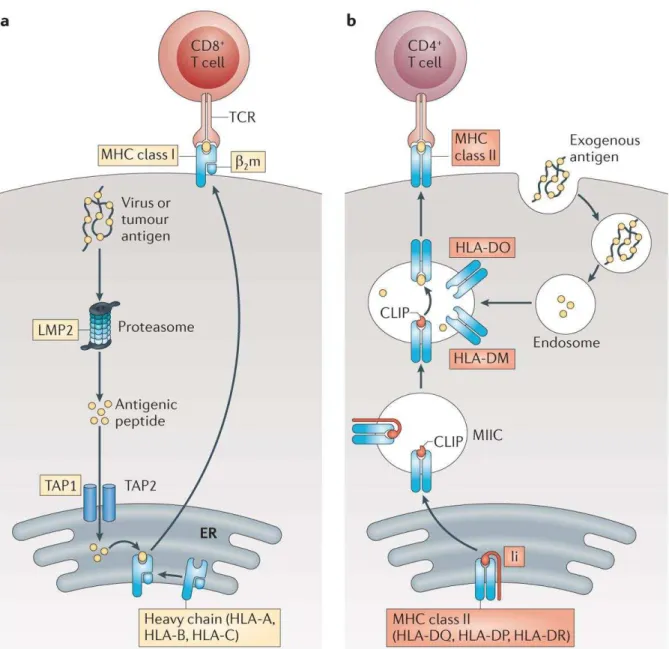
As noted previously, more than 200 genes are located in the MHC region, many of which encode proteins that function as part of the immune system. Class I and II MHC molecules principally exert the same function by presenting antigens, but these two types of molecules differ in the way they acquire these antigens in the first place and the type of cells they interact with. Class I molecules obtain the processed antigens intracellularly in the endoplasmic reticulum (Peaper et al. 2008). The loaded antigens are then transported to the cell membrane and presented on the molecules’ surfaces to CD8+ T cells. Class II molecules, however, specialize in extracellular antigens that are captured by immune cells and processed by their lysosomal machinery. Loading of the processed antigens occurs after the fusion of endosomes with other ones carrying class II molecules. The loaded antigens are finally exported to the cell membrane where they are presented to CD4+ T cells (Figure 1.2) (Owen et al. 2009).
5
Figure 1.2: Antigen presentation pathway of MHC class I & II molecules
Antigen presentation pathways in (a) class I and (b) class II molecules. Reprinted with permission from Macmillan Publishers Ltd. [Nature Reviews Immunology] (Neefjes et al. 2011),
copyright (2011).
6
1.3 HLA and disease associations
The significance of the HLA region is clearly evident from the number of disease associations that are linked to genetic variants located in the loci. This relatively small region occupies 3.6 Mb of the human genome (i.e., 0.12% of the genome), but contains 6.4% of the NHGRI-reported GWAS associations (Ripke et al. 2013).
Genetic variability in the HLA loci is associated with common/complex diseases. Common diseases that have been associated with HLA genes include TID, RA, and multiple sclerosis (MS). The one element shared between these diseases is the presence of what is called
“autoantibodies,” whose presence triggers an immune reaction against self-proteins; for this reason, the mentioned diseases are known as autoimmune diseases. One of the candidates that have been associated with RA is the HLA-DRB1 locus, although some of the reported associations were specific to populations with European ancestry (Kochi et al. 2010). Another class II locus (HLA-DQ) has also been linked to TID. Early studies of genetic susceptibility to TID suggested that having two haplotypes of HL-DQ loci (DQA1*03:01- DQB1*03:02 and DQA1*03:01-DQB1*03:01) confers increased risk and protection against the disease, respectively (Sanjeevi et al. 1995). Furthermore, recently, more DRB loci have been linked to TID, which included DRB3 (DRB3*01:01:02 and DRB3*13:01:01) and DRB4 (DRB4*01:03:01) (Zhao et al. 2016). The factor linking all of these diseases is the central role played by HLA genes in immunity.
HLA loci also contain several genes associated with infectious diseases. Again, the involvement of MHC molecules in antigen presentation to T helper cells places them in the center of the defense against pathogens and infectious agents. The list of such infectious diseases includes tuberculosis (TB), malaria, human immunodeficiency virus (HIV) infection, and hepatitis. Previous studies showed that individuals with heterozygote genotypes in class
7
II and I HLA genes have greater ability to clear infection or slow disease progression in hepatitis B virus infection and HIV/AIDS, respectively (Thursz et al. 1997; Carrington et al. 1999).
Contrary to the TID and RA diseases, in which HLA class I and II were the main candidate loci, a gene in class III (tumor necrosis factor alpha: TNF-α) seems to be associated with the severity of malaria in the Gambian population (McGuire et al. 1999), although a later GWAS failed to replicate this association (Jallow et al. 2009). Furthermore, the associations of HLA class I and II alleles with malaria have also been reported, although their strength is questionable (Blackwell et al. 2009).
1.3 Evolution of MHC loci
The question of how MHC genes evolved has yet to be fully addressed; some evidence has been presented showing that MHC genes (class I and class II) are as old as most of the other adaptive immune system genes, including T-cell receptor (TCR) genes (Flajnik and Kasahara, 2001). In the evolutionary tree, the MHC genes first appeared after the divergence between jawed and jawless vertebrates, so these genes have been identified in all major jawed vertebrates (Flajnik et al. 1999) (Figure 1.3).
8
Figure 1.3: Evolution of adaptive immune system.
First appearance of MHC genes in this evolutionary tree is indicated by the red asterisk at the divergence between jawless and jawed vertebrates.
Adapted from Immunity 15 (3), Flajnik et al., Comparative genomics of the MHC glimpses into the evolution of the adaptive immune system, 351-362, copyright (2001), with
permission from Elsevier. Genome
duplication (?)
*
222 (Mya) 450
528
564 310
630 360
Mammals (human) Birds (chicken) Reptiles (snake)
Amphibians (Xenopus, axolotl)
Bony fish (zerafish, medaka fish, Fugu, trout) Cartilaginous fish (shark skate
Cyclostomes (hagfish, lamprey) Cephalochordates (Amphioxus)
Jawed vertebrates Jawlessvertebrates
9
1.3.1 HLA genes evolve through segmental duplications and insertion/deletions
The high variability of HLA loci is featured in the over representation of segmental duplications, which are very common along the loci (Bailey et al. 2001) (Figure 1.4). Nei et al. (1997) studied the patterns of phylogenetic variations in the MHC class I genes of many vertebrates and found that these patterns fit the birth and death model of evolution more than the concerted model one. In the birth and death model, gene families as in class I genes evolve mainly through duplications, which lead to the emergence of new genes or sometimes the disappearance of others due to the accumulation of deleterious mutations. As they showed, many MHC class I genes in humans and mice have experienced duplication events or became non-functional (pseudogenes). Furthermore, Anzai et al. (2003) compared 1.7 Mb of human and chimpanzee MHC loci and found a large 95-kb deletion in the chimpanzee sequence, which led to the chimpanzee having a single MIC gene. Because the detected deletion seemed to be in a functionally significant position, the authors postulated that INDELs have probably played a role in the MHC evolution of primate species.
10
Figure1.4: A screen shot from UCSC genome browser showing segmental duplication in HLA class I region
The grey rectangles showing duplications extending in regions include HLA-A, HLA-H, and HLA-G. Segmental duplications data are based on Bailey et al. (2001)
11 1.3.2 Natural selection in the HLA loci
Selection acts on a genetic locus in several ways. For example, an increase or decrease in the specific allele frequency at a locus could be interpreted as directional selection of that allele; whether it is considered to be positive or negative selection depends on the direction of the shift in allele frequency. In some other cases, the change in allele frequency takes the form of an increase in allele number, with many alleles maintained at intermediate frequencies. The result of this general increase in allele frequencies is also an increase in heterozygosity at the population level. This last pattern of selection is known as overdominant selection (also called balancing selection).
The driving force in the evolution of MHC genes is probably highly relevant to the functions exerted by their encoded proteins. It is generally believed that MHC genes evolved as a result of interaction between the host (organism) and infectious pathogens.
1.3.1.1 Balancing selection as a driving force for HLA gene evolution
In almost all populations, it has consistently been observed that HLA genes have a high level of heterozygosity (Solberg et al. 2008). Based on this observation, it was proposed that balancing selection maintains this increased level of heterozygosity, although other types of selection, such as frequency-dependent selection, cannot be ruled out. Regarding the mechanism underlying this maintenance, it was suggested that individuals with heterozygote genotypes might have better fitness than those with homozygote ones. This is because heterozygote genotype carriers have greater capacity to recognize and present antigenic peptides to the immune system, and thus have a wider pathogen-combating capacity than individuals with homozygote genotypes. The increased fitness of heterozygote genotypes is called the “heterozygote advantage,” which represents the basic concept of the heterozygote advantage model. Although this heterozygote advantage hypothesis is widely accepted, validating it experimentally is not easy. Penn et al. (2002) tested this hypothesis on mouse
12
strains after challenging them with different bacterial strains. Their findings indicated a difference in survival and infection clearance between heterozygote and homozygote mice, with the former having a higher survival rate and greater likelihood of clearing the infection.
Apart from the observation of increased heterozygosity, studies of DNA sequence variations also provided clues regarding balancing selection acting on HLA loci. Hughes and Nei (1988) studied the pattern of nucleotide substitutions in the antigen recognition site (ARS) of HLA class I genes. They first speculated whether overdominant selection is acting on these genes; then, the ratio of nonsynonymous substitutions (dN) to synonymous substitutions (dS) in the ARS would be high. Interestingly, their findings came to support this hypothesis, so they concluded that overdominant selection plays a major role in the evolution of HLA genes.
Recently, a different viewpoint was proposed by Lau et al. (2015), who studied balancing selection using the HLA-DRB1 locus as a model. Based on their previously established phylogenetic analysis of the PBR, they found that DRB1 alleles cluster into two groups, only one of which supports the heterozygote advantage model. They suggested that the divergent allele advantage model is unlikely to explain all of the diversity in the HLA-DRB1 locus and other mechanisms might also be working in combination.
Evidence for other types of selection has also been documented. Directional selection of a specific allele is expected to increase or decrease the frequency of that allele in the population. As a consequence of such selection, a favorable outcome might occur if the selected allele confers protection from certain diseases or vice versa if the allele increases the risk of diseases. An interesting example of such selection is the strong selection of HLA- DPB1*04:01, which was shown to have reached an allele frequency of 6.1% in the Japanese population, although evidence of its association with a specific phenotype/disease is still lacking (Kawashima et al. 2012).
13
1.4
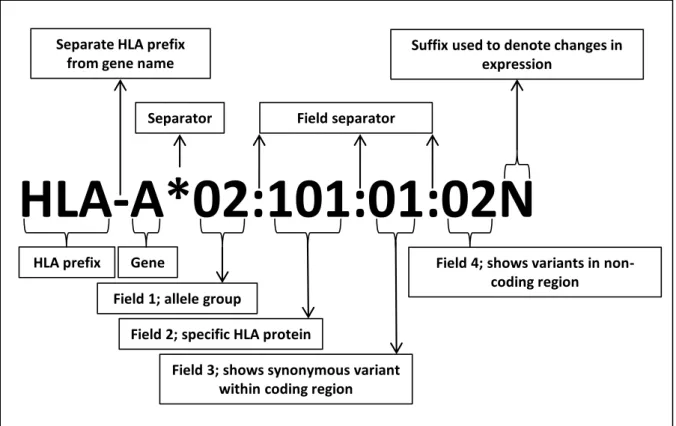
Nomenclature of HLA alleles/genesDealing with the complexity of HLA loci necessitated an organized effort to cope with it. The World Health Organization therefore established a designated committee for managing and maintaining the HLA system nomenclature. This committee is currently known as the WHO Nomenclature Committee for Factors of the HLA System. Criteria for naming HLA alleles depend on several factors regarding the PBR’s serological activity, sequence length considered, and the type of variations in this sequence. The name of an HLA allele starts with
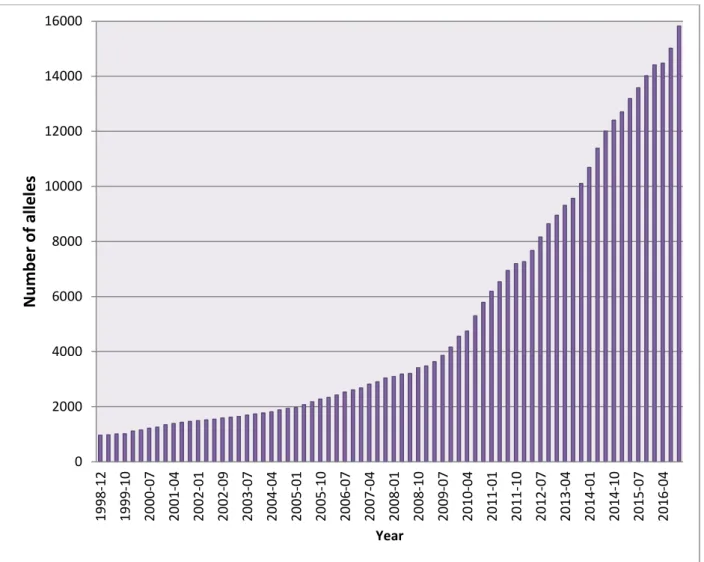
“HLA” followed by a hyphen and capital letters to indicate the gene name (Figure 1.5). The gene name is followed by a separator “*” and then four sets of digits separated by a colon “:” The first set of digits represents the allelic group, which is determined by the antigenic reactivity. The second set of digits corresponds to the specific HLA protein and any two alleles differing in this set must have at least one missense variant. On the other hand, synonymous variants are represented by the third set of digits. The fourth and last set of digits distinguishes alleles with variants in the untranslated regions of the gene (i.e., introns, 5′ and 3′ untranslated regions). An additional suffix is sometimes added at the end of the allele name to give additional information; for example, a suffix with the letter N indicates that this allele is not expressed (also called “Null”) (Marsh et al. 2010). As of October 2016, there are 15,635 HLA alleles registered in the IPD-IMGT/HLA database (Figure 1.6).
14
Figure 1.5: Criteria for nomenclature of HLA alleles/genes (March et al. 2010)
HLA-A*02:101:01:02N
HLA prefix Gene
Field 1; allele group
Field 2; specific HLA protein
Field 3; shows synonymous variant within coding region
Field 4; shows variants in non- coding region
Suffix used to denote changes in expression
Field separator Separator
Separate HLA prefix from gene name
15
Figure 1.6: Number of HLA class I & II alleles in the IPD-IMGT/HLA database (October 2016)
0 2000 4000 6000 8000 10000 12000 14000 16000
1998-12 1999-10 2000-07 2001-04 2002-01 2002-09 2003-07 2004-04 2005-01 2005-10 2006-07 2007-04 2008-01 2008-10 2009-07 2010-04 2011-01 2011-10 2012-07 2013-04 2014-01 2014-10 2015-07 2016-04
Number of alleles
Year
16
1.4
HLA typingThe increased interest in HLA typing in the last decade is due to the high demand for tissue matching between donors and recipients in transplantation therapy. This is supported by the large number of new HLA alleles that were found based on bone marrow donor registries around the world. Interestingly, a single study conducted on potential stem cell donors found 2127 new HLA alleles in class I genes (Hernandez-Frederick et al. 2014), which clearly indicates how much effort will be required to obtain all of the variability in the HLA genes.
1.4.1 HLA typing methods
HLA typing methods can be classified into two main categories based on the type of molecules used in the test. The first category is based on serological identification of the HLA allelic group, which is based on antigen-antibody reaction. This is the first approach used for HLA typing and, because the test is based on cellular interaction, only the functional part of the protein is targeted. For this last reason, this approach only captures variability in the peptide-binding region, which is why the resolution of typing is considered to be low (defined at two digits). More recently, with the advancement of molecular biology techniques, especially after the establishment of PCR, sequence-based typing started to be used extensively, which is the second category here. Sequence-based typing (SBT) includes several methods that all share the use of a DNA sample as the test material; therefore, the objective of this approach is to identify variations in a DNA sequence. Because all SBT methods use DNA as the starting material, they also share a PCR amplification step at the beginning. If the primers used in this amplification are specific to some alleles, then typing could be achieved in this step (this is known as PCR-sequence-specific primer, PCR-SSP). In another method called PCR-sequence-specific oligonucleotide probe (PCR-SSO or PCR- SSOP), the PCR amplification product is immobilized onto a nylon membrane, followed by hybridization to a specific labeled probe. Detection of the signal from the bound probe will
17
determine the sample’s genotype. The target regions in both PCR-SSP and PCR-SSO are exons 2 and 3 in class I genes and exon 2 in class II genes; hence, the typing of these methods is at four-digit resolution. A third SBT method is based on PCR followed by Sanger sequencing, which has the capacity to determine the full sequence of the HLA gene of interest, permitting a maximum typing resolution of eight digits.
1.4.2 Ambiguity in HLA typing
The complexity of HLA loci (e.g., homology between loci) and the highly polymorphic nature of some genes may make the identification of unique genotypes a challenging task. Without exception, all of the HLA typing methods sometimes provide ambiguous genotyping results and such ambiguity is related to the principle of the method itself. In serology-based typing, because only PBR is considered, several alleles share the same antigenic epitope; therefore, they are placed in the same allelic group. The problem, however, is that distinguishing between these alleles is essential for tissue matching in transplantation because they are functionally different and might trigger an immunological response and increase the risk of graft rejection. Sequence-based typing methods targeting specific exons such as PCR- SSP and PCR-SSO also have ambiguous typing when more than one allele shares the same sequence in the targeted exons. In such cases, it is necessary to include additional exons to obtain a unique typing result, which obviously requires further laboratory work. Finally, although Sanger sequencing can achieve the best typing resolution up to eight digits, it is also not free from ambiguity in some cases. Here, reading the chromatogram in positions that have excessive heterozygosity is very difficult because traces of fluorescence signal overlap with each other, preventing a unique nucleotide call. As a consequence of such ambiguity, identification of the two HLA alleles will not be possible because the sequence of each allele cannot be uniquely identified: a problem known as haplotype phasing problem. Dealing with such ambiguity requires experienced personnel, if not additional experiments.
18 1.4.3 HLA typing using next-generation sequencing
Next-generation sequencing (NGS) has had a tremendous impact on many fields in biology and medicine and is increasingly being used for HLA typing. Furthermore, several NGS- based protocols have recently been developed, which fall into two main categories: methods based on PCR amplification followed by MiSeq and methods based on capture and analysis of HLA sequence data.
1.5
HLA and genetic diversity in human populationsThere are several approaches to studying genetic diversity in a population. One of these is to use genetic markers that are highly polymorphic in the population under study. The fact that HLA genes are exceptionally diverse among populations worldwide makes them good candidates for genetic diversity studies. Although other markers such as mitochondrial DNA, the Y chromosome, and genome-wide SNP data are also used, the relevance of HLA goes beyond the issue of diversity to include disease associations, drug effects, and transplantation therapy.
1.5.1 Genetic diversity of East African populations
Until recently, the genetic diversity of African populations had not received much attention in genetic studies addressing global human diversity. Thanks to the efforts of Dr. Tishkoff and her group, the great level of diversity in this part of the world has been revealed. The African origin model of modern human evolution suggests that all non-African groups are descendants of a small group that left Africa probably more than 40,000 years ago (Relethford 2001). Haplotype analysis of autosomal genes (CD4, DM1, and PLAT) in different populations showed that non-African groups, in addition to their shared patterns of variation, also share a subset of variations with East African groups from Ethiopia (Tishkoff et al. 2002). This suggests that migration of early modern humans took a route from East Africa and a group of early East Africans, who migrated out of Africa, could be the ancestors
19
of all current non-African populations. Evidence from the non-recombining region of the Y chromosome also showed that current haplogroups from East Africa (including Sudan and Ethiopia) and the Khoisan of South Africa are the most ancestral in the world (Underhill et al. 2000). Moreover, East African groups have the greatest level of regional genetic substructure among African populations (Tishkoff et al. 2009).
1.5.2 History, linguistic, and genetic diversity of Sudanese population
Sudan is a country in northeast Africa located in 15°00 N and 30°00 E coordinates. The history of Sudan is largely undocumented and sources on its early history are limited and mostly from elsewhere, such as Egypt. The name “Sudan” comes from the Arabic word “Sud,” which means black people; it was used to describe the area south of Aswan City where the Nubian people currently live. Prehistorically, the land north of the first cataract of the Nile was known as the “Cush” (currently north Sudan). From 800 BC and several centuries thereafter, Cush was a powerful kingdom that ruled north Sudan and sometimes extended its political influence over Egypt (Metz 1991).
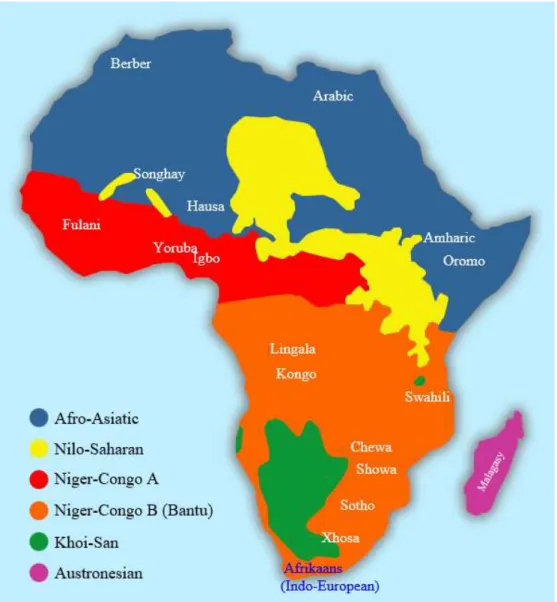
Linguistically, Sudan is one of the most diverse countries in Africa. According to Ethnologue (Ethnologue: Languages of the world, http://www.ethnologue.com), there are currently 76 living languages in Sudan, although many of them are classified as threatened or endangered (Lewis et al. 2016). Despite the huge linguistic diversity seen in Sudan, Sudanese languages fall into three main linguistic families (Figure 1.8): Afro-Asiatic, Nilo-Saharan, and Niger- Congo/Kordofanian (Greenberg 1963). The most commonly spoken language is Arabic, which is currently the official language and belongs to the Afro-Asiatic family. This family is widely spread across the northern and eastern parts of the country and it includes Arabic and Bedawiyet (spoken by Beja). Furthermore, the Afro-Asiatic family also extends to neighboring countries such as Eritrea and Ethiopia, as well as North Africa. The second family is Nilo-Saharan, which has a vast representation in Sudan; in fact, most Sudanese
20
languages are categorized into this linguistic family (Greenberg 1963). Languages of the Nilo-Saharan family include those spoken by Nubians in the north, Darfurians in the west, and Nilotes in the south (which is now a separate country). The last major linguistic family in Sudan is the Niger-Congo family (also called Niger-Kordofanian), which is, in contrast to the Nilo-Saharan family, restricted to a few groups from the Nuba mountains in the south.
21
Figure 1.7: Major linguistic families in Africa
Classification is based on Greenberg (1963). Downloaded from
(https://commons.wikimedia.org/wiki/File:African_language_families_en.svg). Permission to reprint is obtained under GNU Free Documentation License.
22
The genetic diversity of Sudanese groups was basically unknown until recently. However, lately, studies based on Y-chromosome variations and SNP data were conducted and provided valuable information for understanding the genetic diversity in Sudan. A study of Y-chromosome variations in different Sudanese groups found haplogroups A, B, and E, which are found mainly in Africa, are very common among Nilo-Saharan-speaking groups such as Nilotes and Fur (Darfurians) (Hassan et al. 2008). In this study, the same groups exhibited limited evidence for gene flow from outside Africa. Paradoxically, the genetic diversity of groups inhabiting north and east Sudan seems to have been shaped by waves of migration and invasion that passed through their areas. This is evident from the high frequency of haplogroup J-12f2 observed in almost all Afro-Asiatic groups and surprisingly the Nilo-Saharan Nubian group. It is largely accepted that this haplogroup originated in West Asia, which explains its high frequency among Middle Eastern and European populations (Hassan et al. 2008). Moreover, recently, genome-wide SNP data in several Sudanese groups identified a Nilo-Saharan component that was not seen in Tishkoff’s study of 2009, adding one additional component to the 14 ones identified in African populations by her group (Dobon et al. 2015, Tishkoff et al. 2009). Furthermore, the deep history of Sudanese and East Africans was revealed by studying the mitochondrial cytochrome C oxidase subunit II (MT- CD2) gene, which indicated a large effective population size (Ne) for populations in East Africa (Elhassan et al. 2014). A phylogenetic analysis based on the same data showed that East Africans are the closest groups to the root of the human evolutionary tree, clearly pointing to East Africa as a potential site for the origin of modern humans.
23
Rationale
The HLA genes have been extensively studied in many populations around the world; however, the HLA genes of African populations have not received the same amount of study (Appendix Figure A.1). Several factors are responsible for this, including a lack of established transplantation programs. Sudan is one of the African countries affected by this situation. Despite the diversity of the Sudanese population, little is known about the distribution of HLA genes in this country. Few studies have been conducted, reflected in there being only five HLA data sets from Sudan in the AFND database (Table 1.1). Furthermore, Dafalla et al. (2011) recently studied the HLA diversity of samples from renal transplant donors from north Sudan. All of these previous studies either had a low typing resolution or did not include a wide representation of the Sudanese population in addition to some of them were never published. Therefore, a comprehensive map of the diversity of HLA genes would serve several purposes.
Furthermore, the diversity of the Sudanese population has recently been studied by Dobon et al. (2015) using genome-wide SNP data, which revealed two main substructures and a shared genetic component with North African and Middle Eastern populations from the Arabian Peninsula (Dobon et al. 2015). This shared component was found in the Sudanese Afro- Asiatic groups and Ethiopians.
In light of the previous points, the objectives of this study are:
- To study HLA class I diversity in seven Sudanese ethnic groups and samples from the neighboring country of Ethiopia.
- To establish a wide map of HLA allele distribution in Sudan.
- To identify HLA class I haplotypes that are common among the study groups.
24
- To examine the genetic structure of Sudanese groups based on HLA data and identify further substructures if found.
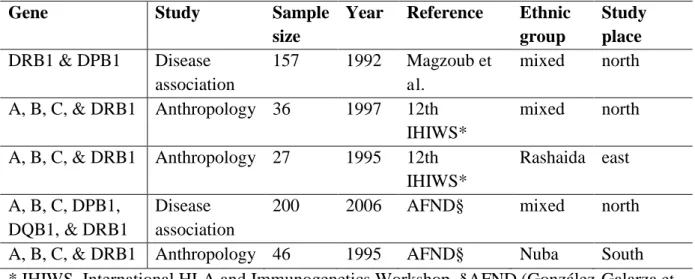
Table 1.1: Previous HLA studies conducted in Sudan
Gene Study Sample
size
Year Reference Ethnic group
Study place DRB1 & DPB1 Disease
association
157 1992 Magzoub et al.
mixed north A, B, C, & DRB1 Anthropology 36 1997 12th
IHIWS*
mixed north A, B, C, & DRB1 Anthropology 27 1995 12th
IHIWS*
Rashaida east A, B, C, DPB1,
DQB1, & DRB1
Disease association
200 2006 AFND§ mixed north
A, B, C, & DRB1 Anthropology 46 1995 AFND§ Nuba South
* IHIWS, International HLA and Immunogenetics Workshop. §AFND (González-Galarza et al. 2015), the two data sets are unpublished and were directly submitted to the AFND.
25
Chapter Two
MATERIALS & METHODS
2.1 Sample information
Saliva samples from 329 individuals were collected between July-September 2010 from different geographical areas, representing groups from Sudan, South Sudan, and Ethiopia. All of sample collection was done by Dr. Hisham Y. Hassan from the University of Medical Science and Technology (UMST). I personally participated in the collection of samples from three groups (Beja, Gaalien and Shokrya). The South Sudanese samples were collected before the separation of Sudan into two countries and the Ethiopians samples were collected from people who currently live in Sudan. In this study, groups were defined based on the linguistic classification of African populations. Three of the major linguistic groups known in Africa are included in these samples: Afro-Asiatic (Beja, Gaalien, Shokrya, and Ethiopians), Nilo- Saharan (Nubians, Nilotes, and Darfurians), and Nilo-Saharan/Niger-Kordofanian (Nuba). The ethnic group affiliations for all individuals were self-reported, which along with their linguistic classification and sample collection locations are shown in Table 2.1. Furthermore, the geographic locations of sampling sites are also shown in Figure 2.1. Both sample collection and DNA isolation were performed using the Oragene™ collection kit (OG-500) (DNA Genotek, Ontario, Canada), following the recommended protocol. In brief, participants were first asked to wash their mouth with water for any food remnants then 10ml of saliva were collected in collection tube. DNA was isolated by taking 500µl from the collected sample in 1.5ml tube, gently mixing the tube and then incubation in a water bath at 50°C for 60 minutes. The sample was transferred to 1.5ml tube and 20µl of PT-L2P buffer were added
26
and the tube was mixed by vortex for several seconds, incubated on ice for 10 minutes and then centrifuged for 5 minutes at 15,000g. All of the supernatant was then transferred to fresh 1.5ml tube and 600µl of 95% ethanol were added and then mixed by inversion 10 times. After allowing the DNA to precipitate for 10 minutes, the tube was centrifuged for 2 minutes at 15,000g and the supernatant was discarded. The sample was washed using 70% ethanol before drying the tube and adding 100µl of TE to dissolve the DNA pellet. The isolated DNA was stored at -20°C till used for the experiments.
Ethical considerations were made when collecting the samples, as all of the participants gave informed consent and their anonymity was protected all the time. In addition, the study protocol was approved by the ethical committee of Sudan Medical and Scientific Research Institute, University of Medical Science and Technology, Khartoum, Sudan (SUM 2010/7), and the Ethics Committee of the National Institute of Genetics, Mishima, Japan (nig1508, 2015.11.30).
For the sake of comparing HLA genetic diversity between populations in this study and other African and Middle Eastern populations, I downloaded data from the Allele Frequency Net Database (AFND) (González-Galarza et al. 2015). The downloaded data included populations from Sub-Saharan Africa (West and Central Africa), the Middle East, and two European populations (in total, I downloaded 30 data sets and the total sample size for all populations was 9119 samples). Details of these downloaded data are shown in appendix Table A.1. As a measure quality, I excluded any data set when the total allele frequency did not add up to one. Although the only data set I found from Saudi Arabia did not meet the last condition, I retained this data set as it is the only one available for comparing the study populations to Arabs from the Middle East.
27
Figure 2.1: Approximate locations of populations in this study The inset at the top left shows the locations of Sudan, South Sudan and Ethiopia
28
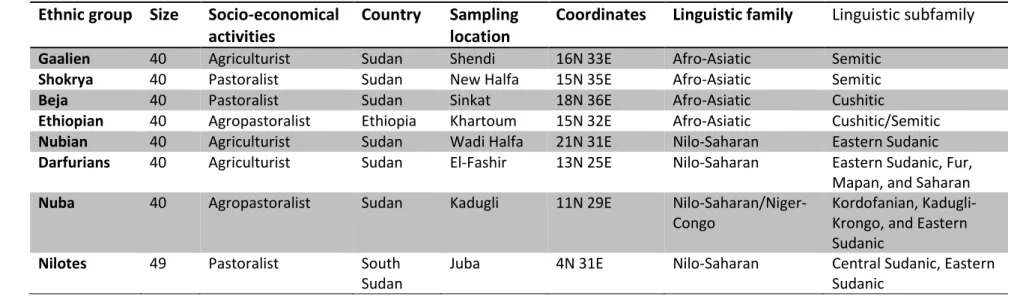
Table 2.1: Geographic distribution and linguistic affiliation of 8 East African populations Ethnic group Size Socio-economical
activities
Country Sampling location
Coordinates Linguistic family Linguistic subfamily
Gaalien 40 Agriculturist Sudan Shendi 16N 33E Afro-Asiatic Semitic
Shokrya 40 Pastoralist Sudan New Halfa 15N 35E Afro-Asiatic Semitic
Beja 40 Pastoralist Sudan Sinkat 18N 36E Afro-Asiatic Cushitic
Ethiopian 40 Agropastoralist Ethiopia Khartoum 15N 32E Afro-Asiatic Cushitic/Semitic
Nubian 40 Agriculturist Sudan Wadi Halfa 21N 31E Nilo-Saharan Eastern Sudanic
Darfurians 40 Agriculturist Sudan El-Fashir 13N 25E Nilo-Saharan Eastern Sudanic, Fur, Mapan, and Saharan
Nuba 40 Agropastoralist Sudan Kadugli 11N 29E Nilo-Saharan/Niger-
Congo
Kordofanian, Kadugli- Krongo, and Eastern Sudanic
Nilotes 49 Pastoralist South
Sudan
Juba 4N 31E Nilo-Saharan Central Sudanic, Eastern
Sudanic N, number of collected samples
29
2.2 Targeted sequencing of HLA genes
2.2.1 NGS library preparation and target enrichment protocol
The NGS library preparation was based on two main principles; the first is pooling of multiple samples using unique combination of indices for each one of them and the second is capturing the target region of interest using hybridization probes labelled with magnetic beads. The first part of library preparation was done using SureSelectQXT Library Prep Kit (Agilent Technologies) and last part of target enrichment was done using SeqCap EZ choice system (Roche Diagnostics). The full NGS library protocol is as described by Ahmadloo et al. (in press), but I will also give the details here:
2.2.1.1 Fragmentation and purification
I first measured the concentration of the isolated DNA using Qubit dsDNA BR Assay Kit (Thermo Fisher Scientific Inc.) on FilterMax F5 Multi-Mode Microplate Readers (Molecular Devices). Then I adjusted the concentration of each DNA sample to a final concentration of 20ng/µl. For each of the 328 samples, 20ng of the adjusted DNA were placed into a well of 96-well plate and 1 µl of 0.5x diluted SureSelect QXT Buffer in addition to 8 µl of SureSelect QXT Enzyme Mix were added. The plates were then sealed and vortexed thoroughly for 20 seconds before spun down. The sealed plated were incubated in a thermal cycler using the following protocol; 10 minutes at 45ºC, 1 minute at 4ºC and final hold at 4ºC. Following that a 16 µl of SureSelect Stop Solution were added to stop the reaction.
The products from previous steps are fragmented DNA, which were then purified by incubation with magnetically labeled AMPure XP beads (Beckman Coulter). The purification process included incubation with AMPure XP beads for 5 minutes and several washing steps with 80% ethanol. In the final step plates were placed on a magnetic stand and the
30
supernatant was discarded to dry up the wells before adding 10 µl of nuclease-free water and sealing the plates.
2.2.1.2 Amplification and adapter ligation
The fragmented and purified DNA was subject to PCR amplification and indices ligation. The PCR reaction contained 5 µl Herculase II Reaction Buffer, 0.5 µl Herculase II Fusion DNA Polymerase, 0.25 µl 100 mM dNTP Mix, 1.25 µl DMSO (100%) and 6 µl PCR-grade water. For each well in the 96-well plate, I added 13 µl of the prepared mix plus 1 µl of dual index primers that are specific to each sample. Therefore, each sample can be identified after pooling and sequencing reaction using the unique set of two indices. The prepared plates were placed in a thermal cycler and the following program was used;
First incubation: 2 minutes at 68ºC
Denaturation: 2 minutes at 98ºC
7 cycles of:
30 seconds denaturation at 98ºC
30 seconds primer annealing at 57ºC
1 minute primer extension at 72ºC
Final incubation for 5 minute at 72ºC
Hold at 4ºC
Following the amplification, the PCR products were purified using the previously mentioned purification steps and in the last step the products were dissolved in 10 µl of nuclease-free water and transferred to a new plate.
31
Up to this step, the prepared DNA library contained the entire genomic DNA of the sample and to capture the target regions of interest (i.e. HLA loci) I used a hybridization based protocol. Furthermore, to reduce the cost and labor I pooled all of 96 samples together in a single tube, an approach previously established in our lab and proved to be efficient and cost- effective (Hosomichi et al. 2013). For the purpose of pooling, I measured DNA concentration of the library and took equal amount of DNA from each well to get a final concentration of 1 µg from the pre-capture library.
2.2.1.3 Hybridization step SeqCap EZ protocol
The entire pooled library was used for the hybridization reaction, which was done following these steps:
Hybridization enhancing (HE) oligo was prepared and 2 µl (2 pmol) were put into new tube and then added 5 µl of COT Human DNA (1 mg/ml) (Sigma-Aldrich).
The tube content was evaporated using Centrifugal Concentrator CC-105 (TOMY Digital Biology).
A master mix of 7.5 µl of 2x Hybridization Buffer and 3 µl of Hybridization Component A was prepared, mixed and 10.5 µl of it were transferred to a new tube.
To the master mix, I added 4.5 µl of SeqCap EZ probe and vortexed then spun down. The final mixture was placed on the thermal cycler and ran the following PCR program: Denaturing at 95ºC for 5 minutes
Incubation at 47ºC for 20 hours
The post-capture library was washed using the following steps:
32
A 100 µl of room temperature adjusted Dynabeads M-270 Streptavidin (Thermo Fisher Scientific) were put into new tube and placed on a magnetic stand for 5 minutes till the solution became clear; then the supernatant was discarded.
The beads were washed 3 times by placing out of the magnetic stand, adding 200 µl of 1x Beads Wash Buffer, mixing thoroughly by vortex, placing on the magnetic stand again till a clear solution was obtained and finally discarding all the supernatant.
To the beads containing tube, 15 µl of post-capture library were added and thoroughly mixed by pipetting.
The tubes were incubated in a thermal cycler for 45 minutes at 47ºC with intermittent vortexing every 15 minutes.
After removing the tubes from the thermal cycler, 100 µl of 1x Wash Buffer I were added and the tubes were mixed then placed on a magnetic stand till a clear solution was obtained, which was then discarded.
The captured library was washed twice by adding 200 µl 1x Stringent Wash Buffer, mixing and incubation in a thermal cycler at 47ºC for 5 minutes. The tubes were then placed on a magnetic stand to capture all the beads and the clear supernatant was discarded.
Finally, the library was washed 3 times using Wash Buffers I, II and III respectively. These washing steps involved adding 200 µl of the buffer, mixing thoroughly and placing the plate on a magnetic stand till the solution became clear, which was later discarded. The final obtained library was dissolved in 20 µl of PCR-grade water.
2.2.1.4 Amplification of post-capture library
The post-capture library was amplified using KAPA HiFi HotStart ReadyMix (Kapa Biosystems). To do that, I prepared a master mix, which contained 50 µl of 2x KAPA ready mix, 2 µl of 100 µM TS-PCR oligo 1 & 2 and 26 µl of PCR-grade water. The master mix was
33
added to 20 µl from the post-capture library and amplified on the thermal cycler using the following program:
Initial denaturing at 98ºC for 30 seconds 18 cycles of:
Denaturation at 98ºC for 10 seconds Primer annealing at 60ºC for 30 seconds Primer extension at 72ºC for 30 seconds Final extension at 72ºC for 5 minutes Final hold at 4ºC
The amplified post-capture was purified using AMPure XP beads as previously described in section 2.2.1.1 of the QXT library preparation. After washing, the library was dissolved in 52 µl of nuclease-free water. The quality of the final library was checked using DNA 1000 kit on Bioanalyzer 2100 and Qubit (BR).
2.2.2 Sequencing of the prepared library
The prepared DNA libraries for all samples (328 samples pooled in four 96-well plates) were sequenced using Illumina MiSeq® platform. Before doing the sequencing, I adjusted the libraries’ concentrations to 4 nM; then using 5 µl of that, I denatured it by adding 5 µl of 0.2 N NaOH, mixed and centrifuged at 280×g for 1 minute and incubated for 5 minutes at room temperature. In the final steps, the libraries were diluted twice using pre-chilled HT1; the first time to 20 pM by adding 990 µl of HT1 and the second time to 12 pM by combining 360 µl of the 20 pM library to 240 µl of the pre-chilled HT1. Finally the diluted DNA libraries were loaded into flow cells of MiSeq® reagent cartridge along with custom sequencing primers provided in SureSelect QXT Library Prep Kit and Illumina TruSeq primers. I designed the
34
sequencing protocol to be paired-end type with forward read length of 350bp and reverse one of 250bp, so the expected insert size between the read pairs was around 600bp.
2.3 Bioinformatics analysis
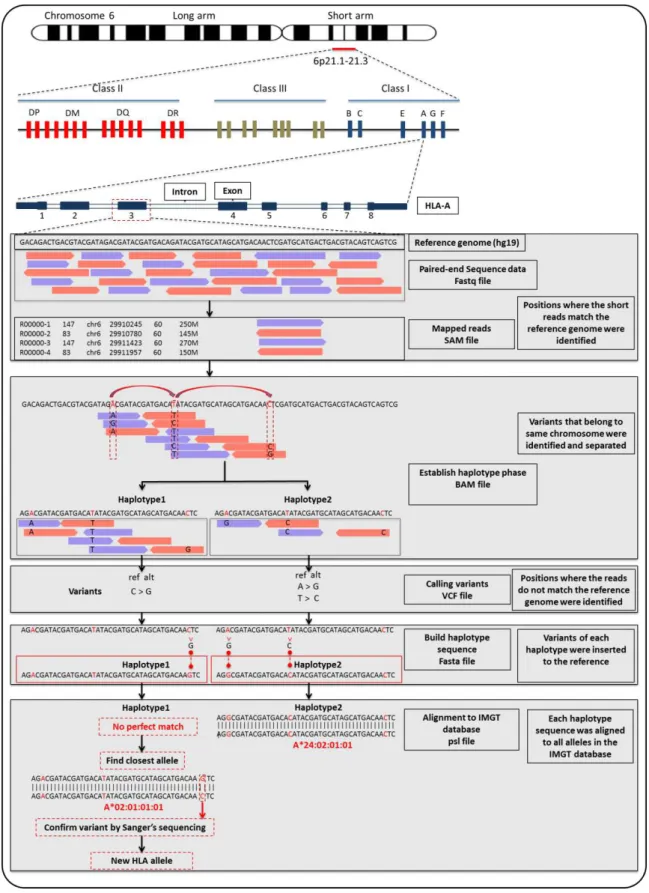
The data were generated from the MiSeq® platform in “fastq” format, which is the standard format currently used in NGS technology. A fastq file contains the sequence generated from the run in the form of short sequences, called reads, and some quality information such as base qualities. An overview of the NGS data analysis is presented in Figure 2.2.
35
Figure 2.2: Overview of the analytical pipeline used in this study
36
2.3.1 Quality control of NGS data
NGS platforms are known to introduce several errors during sequencing runs. One of these systematic errors is the decrease in base quality as cycling of sequencing progresses, which is known to be the case for the Mi-Seq platform. Such biases can be clearly revealed by simply plotting base quality per sequencing cycle. One of the very common solutions to this problem is the trimming of reads at the point where base quality drops to less than 20. Although this threshold is an arbitrary one, it is widely accepted; therefore, I trimmed reads in the fastq files using Trimmomatic (Bolger et al. 2014), allowing only reads with ends of base quality 20 or more.
2.3.2 Mapping sequencing reads to the reference genome (hg19,
GRCh37)
The data in fastq files are short sequences (reads) without any information about their position in the genome: therefore, reads need to be aligned to specific genomic positions. Several sequence alignment programs are available, of which Burrows-Wheeler Aligner (BWA) is most commonly used (Li and Durbin 2009). I used BWA version 0.7.12 to align the trimmed fastq files to the reference genome hg19 (GRCh37, Genome Reference Consortium Human Reference 37). One of the considerations I made during the mapping step is the high degree of homology between HLA genes, which may cause mapping errors when reads from other highly similar positions are mistakenly mapped to the wrong locus (e.g., reads from pseudogenes such as HLA-J align to HLA-A). In my experience, mismapped reads have a higher number of mismatches than reads with a true mapping position. To reduce the effect of this type of mismapping, I utilized these mismatch differences by applying the parameter “–B” in the BWA-MEM algorithm. This parameter increases the mismatch penalty during mapping, so it leads to low mapping quality for reads with increased