i
The Development of Detector and Calibration
Field as an Approach of Low Energy Photon
Dosimetry
Suffian Bin Mohamad Tajudin
DOCTOR OF PHILOSOPHY
Department of Accelerator Science
School of High Energy Accelerator Science
The Graduate University for Advanced Studies (2015)
ii
T ABLE OF C ONTENTS
LIST OF TABLES ... iv
LIST OF FIGURES ... v
Introduction ... 1
1.1 Photon dosimetry ... 1
1.2 Energy dependence ... 1
1.3 Photon energy and dosimeter of study interest ... 2
1.4 Approaches of study concerning low energy photon dosimetry... 3
Literature Reviews ... 5
2.1 Development of detector ... 5
2.1.1 Plastic scintillator as a dosimeter ... 5
2.1.2 Ionization quenching effect ... 5
2.1.3 Birks formula of ionization quenching effect ... 6
2.1.4 Compton coincidence technique (CCT)... 7
2.1.5 Compensation for plastic scintillator response ... 7
2.2 Development of calibration field ... 8
Experimental setup and Calculations ... 12
3.1 Development of Detector ... 12
3.1.1 Preparation of plastic scintillators ... 12
3.1.2 Calibration of plastic scintillators ... 12
3.1.3 Electron response of plastic scintillators ... 13
3.1.4 Energy resolution of plastic scintillator ... 14
3.1.5 Pulse height distribution spectra ... 14
3.1.5.1 Experimental procedure ... 14
3.1.5.2 Calculation procedure ... 14
3.1.5.2.1 Calculation of pulse height distribution ... 14
3.1.5.2.2 Calculation of a normalization factor for electron Quenching effects ... 15
3.2 Development of Calibration Field ... 16
3.2.1 ~200 keV photon field by backscatter layout ... 16
3.2.1.1 Backscatter Layout Optimization by Calculations ... 16
3.2.1.2 Uniformity of the Backscattered Photon Field ... 17
3.2.2 ~200 keV photon field by an X-ray generator ... 17
3.2.2.1 Calculation of photon spectra for filtered X-rays ... 17
3.2.2.2 Measurements of suggested filter materials ... 18
iii
3.2.3 Spectrum measurement using CdZnTe detector ... 18
3.2.3.1 Measurement - calculation geometry ... 18
Result and Discussions ... 33
4.1 Development of detector ... 33
4.1.1 Calibration of plastic scintillator ... 33
4.1.2 Electron response of plastic scintillators ... 34
4.1.2.1 Calculation of the CCT geometry ... 35
4.1.3 Comparison of measured and calculated pulse height distribution ... 36
4.1.4 Absorbed dose from pulse height distribution spectra ... 37
4.1.5 Compensation of underestimation for soft-tissue dose ... 39
4.1.6 Summary development of detector ... 40
4.1.6.1 Effect from surrounding material ... 40
4.2 Development of calibration field ... 41
4.2.1 ~200 keV photon field by backscatter layout ... 41
4.2.1.1 Backscatter Layout Optimization by Calculations ... 41
4.2.1.2 Uniformity of the Backscattered Photon Field ... 43
4.2.1.2.1 Position Dependence of Spectra ... 43
4.2.1.2.2 Position Dependence of Dose Rate ... 43
4.2.2 ~200 keV photon field by X-ray generator ... 43
4.2.3 Comparison of peak efficiency and pulse height spectra using CdZnTe detector . 44 4.2.4 Summary development of calibration field ... 45
Conclusion ... 89
References ... 91
Publication list ... 94
Acknowledgements ... 96
iv
LIST OF TABLES
Table 1 Elemental compositions of soft-tissue weight by fraction (ICRU-4 component) [11]. ... 4
Table 2 Physical characteristics of the plastic scintillators studied ... 20
Table 3 Example of layout parameters of Figure 14. ... 28
Table 4 The list of check sources used for measurements. ... 31
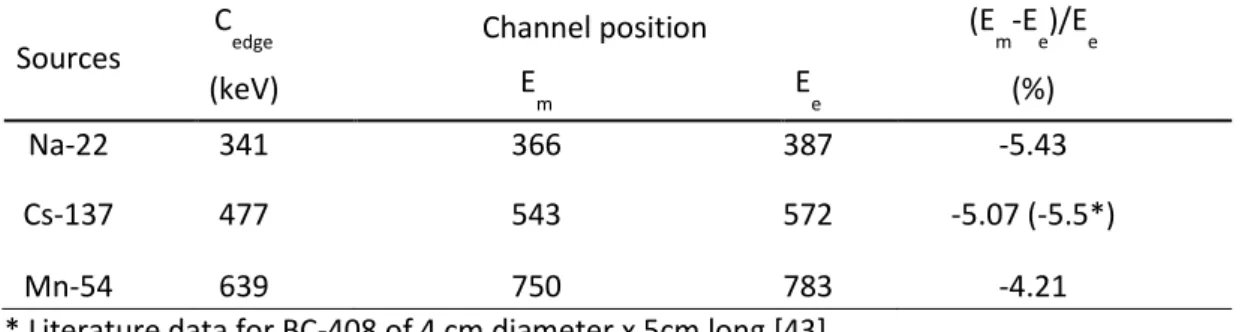
Table 5 The deviation of the Compton edge position of Compton maximum (Em) ... 51
Table 6 The deviation of the Compton edge position of half-height of Compton maximum (Eh) . 51 Table 7 The values of time window (ns) applied as a function of scattering angle. The short coincidence time gives an advantage to significantly reduce chance coincidence events. .. 57
Table 8 Measured and calculated absorbed dose rate of EJ-200 ... 71
Table 9 Measured and calculated absorbed dose rate of EJ-256 ... 71
Table 10 Ratio of calculated (C1 and C2) to measured (M) absorbed dose in scintillator for the data shown in Table 8 and Table 9. ... 71
Table 11 Peak-to-total ratio and dose of the calculated photon spectra as a function of source to floor distance (SFD). ... 76
Table 12 The properties of measured spectra as shown in Figure 60. ... 82
Table 13 Optimized layout parameters of Figure 15. ... 83
Table 14 The volume of the uniform backscattered radiation field in the horizontal and vertical directions. ... 83
Table 15 The contribution (%) of low energy component (LEC) towards dose value ... 83
v
LIST OF FIGURES
Figure 1 Mass attenuation coefficient, /, of several materials as a function of incident photon
energy [8], where is the mass density of the material. ... 4
Figure 2 Total stopping powers of electrons calculated with the ESTAR database for vinyltoluene based materials [20]. ... 10
Figure 3 The available candidates of photons radiation for calibration. ... 11
Figure 4 Compton-scattered photon energy as a function of the scattering angle ... 11
Figure 5 Scintillator emission spectrum of EJ-200 (a) and EJ-256 (b) [30]. ... 21
Figure 6 Final appearance of the self-wrapped scintillator of both thicknesses with white Teflon tape; 5 and 1 cm are ready for use ... 22
Figure 7 Block diagram showing the electronics used in the experiment of coincidence. ... 23
Figure 8 Schematic diagram of the setup for Compton coincidence technique in the actual scale size. ... 24
Figure 9 Block diagram showing the electronics used in the experiment. ... 25
Figure 10 Picture showing the direct measurement of gamma sources in open geometry. ... 26
Figure 11 Simulation geometry modelled in EGS-CGview for calculation of the scintillator energy deposition. ... 26
Figure 12 Total stopping power of electrons (dE/dx) passing through the plastic scintillator. ... 27
Figure 13 The ratio of calculated light output to the electron energy deposition for a kB value of 0.016 g cm-2 MeV-1. ... 27
Figure 14 Basic setup of backscatter layout. ... 28
Figure 15 Partly optimized the setup of backscatter layout. ... 29
Figure 16 The backscatter layout modelled in EGS5-CGview as Figure 15. ... 29
Figure 17 Overview of the calculated photon spectra for X-ray of 250 kVp. ... 30
Figure 18 The experimental setup used for measuring the absolute peak efficiency values. ... 31
Figure 19 The model of CdZnTe 1cm3 crystal (KROMEK, Model GR1) in EGS5-CGview for particle trajectory. ... 32
vi
Figure 20 The calculated crystal areas of CZT from the front view. ... 32
Figure 21 The typical measured spectra with plastic scintillators showing a broad Compton edge. ... 46
Figure 22 Example of the shape of the Compton region defined by the Gaussian error function for Cs-137 (a) and Mn-54 (b). ... 47
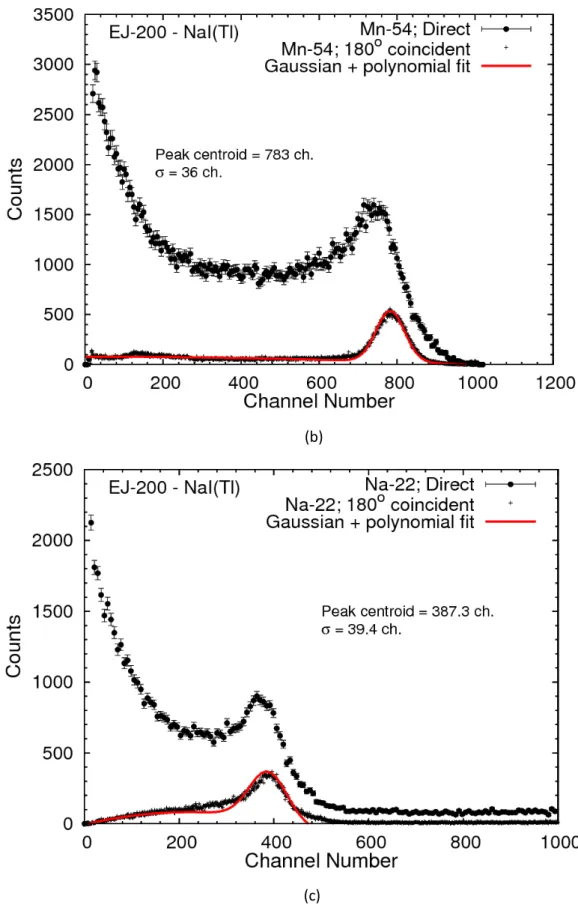
Figure 23 The direct Compton electron spectrum (o) superimposed on the coincidence spectrum (+) for Cs-137 (a), Mn-54 (b) and Na-22 (c) of EJ-200 ... 48
Figure 24 Linear fit of the Compton edge energy and its pulse height from Cs-137, Mn-54 and Na- 22 gamma ray sources. ... 50
Figure 25 Linear fit of the Compton edge positions and pulse height values from Cs-137, Mn-54 and Na-22 gamma ray sources. ... 51
Figure 26 The energy cali atio u es of oth NaI Tl efe e e dete to s. ... 52
Figu e The D oi ide e plots of the EJ- a d NaI Tl easu ed Co pto coincidence technique. ... 53
Figure 28 The coincide e e e g spe t u of the EJ- a d NaI Tl ... 55
Figure 29 The measured (E) and calculated (E PHIT“ ode fo Compton scattered photon energy as a function of scattering angle. ... 58
Figure 30 The inherent width of scattered photon spectra by NaI of 3 in x 3 in. ... 61
Figure 31 The calculated scattered photon spectra for angle uncertainty of 1 degree at a distance of 40 cm from target scintillator. ... 61
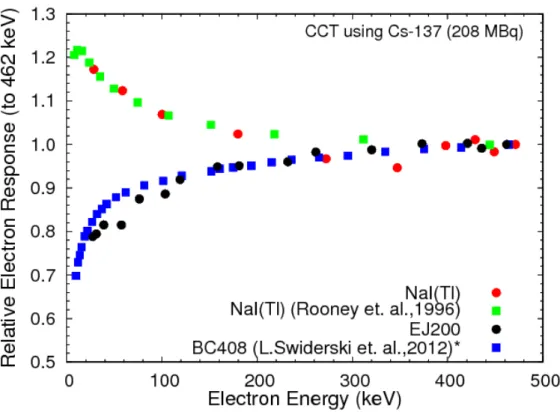
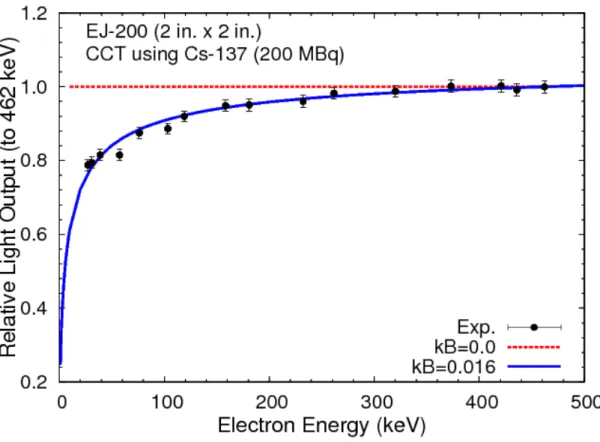
Figure 32 Relative electron response of EJ-200 (black dotted) and NaI(Tl) (red dotted) measured with CCT. ... 62
Figure 33 Result of least square analysis comparing the Birks calculated light output from Equation 2 to the experimental data light output for EJ-200. ... 62
Figure 34 Relative electron response of the EJ-200 plastic scintillator (black dotted) measured with CCT. ... 63
Figure 35 The 2-step analysis on the photopeak of Am-241 to determine FWHM. ... 64
Figure 36 Measured and calculated light output distribution of Am-241 ... 65
Figure 37 Measured and calculated light output distribution of Co-57 ... 66
Figure 38 Measured and calculated light output distribution of Cs-137 ... 67
vii
Figure 39 Measured and calculated light output distribution of Cs-137 ... 68
Figure 40 Measured and calculated light output distribution of Mn-54 ... 69
Figure 41 Overlap plot of measured and calculated light output distribution of EJ-200 and EJ-256 for Am-241 (a) and Mn-54 (b), respectively. ... 70
Figure 42 Simulation geometry modelled in EGS-CGview for calculation of the scintillator and soft- tissue absorbed dose. ... 72
Figure 43 The ratios of calculated absorbed dose for EJ-200, EJ-256 (0.5% Pb) and EJ-256 (1.0% Pb) to soft-tissue ... 73
Figure 44 Simulation geometry modelled in EGS-CGview for estimation the effect of PMT window ... 74
Figure 45 The absorbed dose rate for thin scintillator with (black line) and without considering the PMT quartz window (blue line). ... 74
Figure 46 The typical calculated photon spectra for Cs-137 (662 keV) under the proposed backscatter layout ... 75
Figure 47 Measured pulse height distributions by a 1 cm³ CZT detector (KROMEK, GR1) under the proposed layout ... 75
Figure 48 Dose rate as a function of lead thickness for 208 MBq Cs-137. ... 77
Figure 49 Calculation results for five different scattering materials (Carbon, Aluminum, Iron, Copper and Tin) of 1-m thickness. ... 77
Figure 50 Calculated dose and peak-to-total ratio of the backscattered photons from the concrete floor with an added square iron block ... 78
Figure 51 Calculated photon spectra at ~200 keV using a backscatter layout with a bare concrete floor and with the addition of a 1.4 m x 1.4 m x 0.05 m iron square on the floor. ... 79
Figure 52 The measured pulse height distributions by a 1 cm³ CZT detector (KROMEK, GR1) ... 79
Figure 53 The calculated photon spectra ... 80
Figure 54 The full energy peak at the horizontal 0-cm position as a function of DPD. ... 80
Figure 55 Summary of peak-to-total ratios of the calculated photon spectra ... 81
Figure 56 The dose rate at the 0-cm horizontal position for several DPD values ... 81
Figure 57 The dose rate distribution in the horizontal direction ... 82
viii
Figure 58 Example of the filtered X-ray spectra measured by using a CdTe detector (ICS-4000) . 84
Figure 59 The measured dose rate of filtered X-ray as function of time irradiation. ... 84
Figure 60 Measured pulse height spectra of filtered X-ray (X-ray of 250 kVp, 0.1 mA) ... 85
Figure 61 Comparison of measured and calculated absolute peak efficiency. ... 86
Figure 62 Measured photopeak of Cs-137 source by CZT ... 87
Figure 63 Measured and calculated absorbed energy spectra of Cs-137 source by CZT. ... 87
Figure 64 The paths of reflected photons under the optimized backscatter layout. ... 88
Figure 65 Comparison width of ~200 keV mono-energetic field of backscattered photon field (=10 keV) with filtered X-ray (=34 keV) using an X-ray tube. The backscatter field can provide narrower energy photons... 88
1
I NTRODUCTION
1.1 P
HOTON DOSIMETRY
In workplaces with radiation-generating devices and radio-isotopes, such as an accelerator, X-ray tube, and radioactive nuclei, radiation dose must be controlled properly to prevent hazards caused by exposure to radiation. Photon dosimetry is indispensable for this situation since photons are always produced as secondary radiation of energetic charged particles and neutrons, and emitted from activated materials due to irradiation of primary particles. Many dosimeters, methods, and standard fields have been developed that involve the energy region of interest to the present research.
To date, there are many different dosimeters available, and it is important to select one suitable for specific application. Commercially available dosimeters or survey meters are air ionization chamber, Geiger counter, NaI(Tl), CsI(Tl) and silicon. To be useful dosimeters, several studies have been conducted to understand their basic properties. Examples include the development of standard calibration fields, calibration of dosimeters and studies of the energy dependence of dosimeters. Such investigations are very useful in making dosimeters more reliable as a photon dosimeter.
Currently, air ionization chamber is widely used as a standard to evaluate the photon dose. The air ionization chamber is a common reference for dose measurements in various fields since it has a flat response, independent of incident photon energy. As examples, ionization chamber was used as a survey meter for monitoring the environment photon dose and perform quality control (QC) for diagnostic radiology. While in radiotherapy, two standard protocols (IAEA TRS-398 [1] and AAPM TG-51 [2]) have been developed for ionization chamber dosimetry of high-energy photon and electron beams.
For medical applications such as interventional radiology (IVR) or depth dose measurements in phantom, the dose measurements for a small photon fields and area drives the needs of smaller size dosimeter with high accuracy. The use of small size air ionization chamber is possible with main limitation- low efficiency due to the low density of air. Mainardi and Bonzi [3] had mentioned the smaller volume of plastic scintillator was adequate to obtain doses with same accuracy as with a large air ionization chamber with a volume of being in the ratio of 1:863. The use of detector system with a small size plastic scintillator had also been studied by workers in radiotherapy [[4],[5],[6]]. The use of other dosimeter such as NaI(Tl) is available with high efficiency but is known to exhibit a strong energy dependence [7].
1.2 E
NERGY DEPENDENCEIt is important not to determine only the absorbed energy in the materials. Energy dependence is one of the important properties of photon dosimetry. The primary issue of energy dependence comes from the difference of atomic composition used in actual measurement and the one that should be measured. Soft-tissue is often the medium of interest in dosimetry. As an example, the photon response in scintillators differ for different incident energies compared to that of air or soft tissue due to their difference in atomic composition. Most of the scintillators have effective atomic numbers relatively higher than
2
that of soft-tissue. This problem is eliminated when both materials are identical; for example, air kerma should be measured with an air ionization chamber.
Figure 1 shows the mass attenuation coefficient of several materials as a function of photon energy.[8]. In the case of NaI below 200 keV, the photoelectric absorption is dominant because dependence of the photoelectric cross-section is proportional to Z4 (or 5). As a result, for low energy photons NaI(Tl) detector exhibits strong energy dependence or higher response. It is mainly attributed by the enhanced photoelectric absorption at low energy photons. Accordingly, it will give higher reading than the actual dose. Therefore care must be taken in using such materials for dose-related measurements. In plastic scintillators Compton scattering is dominant for photons with the energy over 20 keV. The probability of a full-energy deposition event in the detector is often negligibly small. Thus, the energy dependence is less distorted and would be ideal as a photon dosimeter. This is an advantage over NaI(Tl) scintillator dosimeter. Water photon cross section was plotted together shows almost equivalent to that of plastics in a wide energy range in comparison to NaI or silicon.
In 1963, Murai et al [9] used a plastic scintillator for dose measurement. The choice of plastic scintillator material in their study was because it is near the tissue equivalent, which is useful for measuring tissue dose. In early 1990s, many studies focused on its application in high-energy photon beams [[4], [5], [6]]. In their studies, several advantages of plastic scintillators were identified including higher detection efficiencies, lower cost, flexibility in shape, and independence of atmospheric factors (e.g. pressure, humidity, and temperature).
1.3 P
HOTON ENERGY AND DOSIMETER OF STUDY INTERESTFollowing the nuclear reactor accident in Fukushima, Japan (2011) concern for Cs-137 contamination has increased along with an interest in radiation safety. From distribution of Cs-137 during the Fukushima accident, many detected photons have an energy of ~200 keV as a result of multiple Compton scattering [10]. This is an energy region of interest for medical dosimetry researches including the sources used in nuclear medicine, surface radiotheraphy and diagnostic radiology.
For photon (gamma/X) detectors and dosimeters, the energy of the incident radiation is a major factor that can distort their responses. The dosimeters are commonly calibrated at a high energy photon with Cs-137 (662 keV), but then used at a lower energy region. The variation of the response of a dosimeter as a function of photon energy must be checked. As an example, the 200 keV energy region is critical for the response of a dosimeter owing to the transition point of photon interaction from the photoelectric effect to Compton scattering. Some dosimeters might have a higher response and indicate higher dose rate for
~200 keV photons.
For medical dosimetry, the dose to tissue is often the quantity of interest. Tissue- equivalent material is preferable to create dosimeters that directly represent the absorbed dose on human soft tissue. Table 1 shows the atomic compositions of soft-tissue [11]. Standard plastic scintillators (e.g., EJ-200, NE102A and BC-408) are normally fabricated from polyvinyl toluene, which only contain hydrogen and carbon with none of the higher atomic numbers. Thus, plastic scintillators are suitable candidates because the density and effective atomic numbers are close to those of human soft tissue.
3
However applications of plastic scintillators in the low energy photon region is not straight-forward. Plastic scintillators are well-known for their non-linearity below 200 keV [[7],[9]]. Several studies have reported that decreased light output distorts the response of incident photon energy below a few hundred keV due to the ionization quenching effect [[12],[13]]. The influence on energy response from the effect should be obtained to evaluate the accuracy of the measured absorbed dose by using plastic scintillators.
1.4 A
PPROACHES OF STUDY CONCERNING LOW ENERGY PHOTON DOSIMETRY As a dosimeter in this energy range, ionization chamber is widely used as a standard. Recently, several applications are reported using plastic scintillator with combining optical fiber in medical field as a relative monitoring device of dose since it has advantages of high sensitivity, flexibility on shape and tissue equivalence. Thus, studying for response of plastic scintillator is meaningful to develop dosimeter applicable for wide photon energy range.As a reference field, several radioisotopes have been used frequently, such as Cs-137 and Co-60. These nuclides provide relatively high-energy photons for dosimeters covering few tens of keV to MeV. According to above-mentioned applications, main energy is around 200 keV for both environmental and medical fields, since the former should consider scattering photons and the later should measure photons from X-ray generator. The reference field around 200 keV is strongly desired to confirm dosimeter readings.
The dosimeter being applicable to wide energy range and counting rate, and reference field to calibrate detector response should be prepared to obtain accurate readings for few tens of keV to MeV photons. Therefore, an approach of low energy photon dosimetry was performed to improve above situation through development of detector and calibration field for few tens of keV to MeV energy region. For the former point, photon dosimetry using a plastic scintillator was examined by considering quenching, a lower effective Z value, and the influence of surrounding materials. To compensate for the quenching effect and the lower effective Z, a lead-doped plastic scintillator (0.5%) was used to achieve a soft-tissue dose response in regions of less than 200 keV. For the latter point, a backscatter layout with a radioactive source was developed to provide a monoenergetic field with energy around 200 keV that were compared with those of an existing field with an X-ray generator. The acquisition and analysis of the photons spectrum were performed with a cadmium zinc telluride (GR1) detector and KSpect software (see section 3).
4
Table 1 Elemental compositions of soft-tissue weight by fraction (ICRU-4 component) [11].
Element Fraction by weight
H 0.1012
C 0.1110
N 0.0260
O 0.7618
Figure 1 Mass attenuation coefficient, /, of several materials as a function of incident photon energy [8], where is the mass density of the material.
Compton scattering
Photoelectric absorption
5
L ITERATURE R EVIEWS
2.1 D
EVELOPMENT OF DETECTOR2.1.1 Plastic scintillator as a dosimeter
The absorbed dose by using plastic scintillator (PLS) could be obtained directly based on pulse height distribution spectra. When we researched the studies comparison of the calculation and measurement of pulse height distribution of PLS with low energy photons, it is obvious that there is not enough comparisons had been carried out. Understanding the pulse height distribution is a key to the use of PLS as a dosimeter, and this was a problematic situation.
The application of PLS as a photon dosimeter (below 100 keV) in medical field had been studied in the current-mode widely. However the pulse height distribution is rarely measured. One of the reasons why there is little written about comparison of pulse height distribution in PLS photons seems to be that its response function is not clearly defined.
Kohan et al. [14] had calculated the pulse height distribution spectra of NE102 scintillators with joint codes: FLUKA for gamma transport and PHOTRACK for light transport. The calculated result was broadened by applying a Gaussian energy resolution to the output. However, the sigma () value was not measured but was randomly added to the pulse heights. While in recent study by Ghadiri and Khorsandi [15] had adopted an optical photons model in the calculation. Both studies had obtained a good agreement at the around Compton edge peak of the Cs-137 source. However the comparison graphics of calculation and measurement of pulse height distribution do not show the lower level energy, and that makes it stand out less. The disagreement appeared at the low energy region after the Compton edge peak is important to evaluate in order to extend the use of plastic scintillator.
To date, few studies have addressed the use of plastic scintillators for gamma ray measurement of low-energy sources such as Am-241 (16.1 keV, 26.3 keV, and 59.5 keV) photons [14], [15],[16] ,[17]. A comparison of measured and calculated spectra in absolute values at such energy levels is useful for checking plastic scintillator response while considering the ionization quenching effect that is required for low-energy photon dosimetry.
2.1.2 Ionization quenching effect
Ionization quenching results in reduction of the scintillation response at low electron energies. Compton scatterings in the scintillator would produce several low scattered electron energies that are deposited in the scintillator. The generated ionizing particles will excite the scintillator molecules before de-excitation to emit the scintillation light. However, it may de-excite with less scintillation light as a result of quenching. It is therefore of interest to determine the response of scintillators particularly in low-energy regions to explain the possibilities of using plastic scintillators for photon dosimetry.
The electron response of plastic scintillator has been studied with various method for many years. Typically below 125 keV electron energies the scintillation light is significantly reduced in organic scintillators. Several semi-empirical models have been proposed to quantitatively describe the reduction in light output by ionization quenching of organic scintillators. The first model is introduced by Birks in 1951 to explain the degradation of light output through unimolecular quenching effect. In his formula, the author introduced a
6
constant parameter, kB, to represent the quenching effect. In 1953, Wright [18] introduced his model that considers unimolecular and bimolecular quenching. Heavy ionizing particles were suggested to introduce additional quenching due to bimolecular process. A more detailed approach was introduced by Voltz et al. [19] in 1966. It makes improvements to the previous models.
2.1.3 Birks formula of ionization quenching effect
The results of electron response were analyzed with the commonly used description of the non-proportionality by Birks. According to the Birks approach, light output of ionizing particles in scintillator material depends not only on its energy (E) but also on its stopping power (dE/dx). In this theory, Birks assumed that the high ionization density along the particle track is responsible for the reduction of scintillator response, i.e., quenching effect. The response of organic scintillators decreases due to the ionization quenching effect at less than a few hundred keV. There is one free parameter in the approach, the kB value (Equation 1);
in which dL/dx is light output per unit path length, A is the scintillation efficiency, and dE/dx is the electron stopping power.
For the typical organic scintillator compositions, the electrons will significantly lose their energies (dE/dx) with decreasing energy. Figure 2 shows the total stopping powers of electrons calculated with the ESTAR database [20] for vinyltoluene-based materials. The stopping values is higher at low electron energies below 200 keV. Thus, the amount of the light output per unit path length (dL/dx) decreases at the high dE/dx region.
Equation 1 is Bi k s fo ula that gives the differential light output per unit path length. For the total light output, L(Eo), from an electron of initial energy (Eo) should account for all light produced as the electron slows. Electron eventually loses all energy in the scintillator. The total light outout is obtained via the integration of Equation 2 over the energy interval from 0 to Eo:
in which Eo is the initial electron energy and dE/dx is the total stopping power.
It has been reported that the response of well-type plastic scintillators is proportional to the energy deposition in the medium down to energies of 20 keV [21]. This result counters that of Bi ks s stud fo non-proportionality in plastic scintillators due to ionization quenching. Another study of liquid scintillator response to electron energies less than 20 keV confirmed Bi ks s fo ula ith diffe e t values for kB (0.013–0.019 cm/MeV) depending on chemical concentration [22]. Craun and Smith had pu lished a su a of Bi ks s o sta t kB for NE e t a ted f o fits of Bi ks s fo ula to eight sets of e pe i e tal data, seven of which consisted of experimental data previously published by other authors. The values of kB ranged from 0.0096–0.0159 g cm-2 MeV-1, primarily for proton particles ranging from 0.25–
� = + � �
�
,
= ∫ + � �
��
7
11 MeV. Experimental data were described well, yet with different kB values for different measurements.
In many papers, the constant value of quenching parameter (kB) were reported for a wide energy range of particles. From current understanding, even if the non-proportionality of light outputs for electrons could be described based on the Birks law, the kB value might not necessary be the same for other particles such as protons. As an example, Chou [23] introduced one additional constant parameter to the Birks formula that give superior fits to the proton experimental data as published by Craun and Smith. Nevertheless, additional investigations are needed for possible relation to the kB parameter between low energy electrons and protons. While several values for kB were reported, it is important to know the effect of non-proportional light outputs of plastic scintillators, especially at low-energy photon dosimetry.
2.1.4 Compton coincidence technique (CCT)
The electron response of plastic scintillators is measured using a Compton coincidence technique [24]. The technique based on detecting Compton electrons produced by incident photons in the scintillator. At the same time, the scattered photon created as a result of Compton scattering interactions would escape from the scintillator. The escaped scattered photon and its energy are measured by a calibrated reference detector. By knowing the initial energy of incident photon and the final energy of scattered photon, one can evaluate the remaining energy transferred to the Compton electrons inside the scintillator.
For the measurements reported here, the target scintillator (EJ-200) was exposed to a collimated beam of 662 keV gamma rays from Cs-137. In Compton coincidence measurements, the incident -rays of 662 keV deposit part of their energy to an electron after undergoing Compton scattering interaction inside the target scintillator (EJ-200). Meanwhile, the Compton-scattered - a s e e g is deposited i the efe e e dete to NaI Tl i coincidence. The energy deposition due to Compton electron energy within the target scintillator (EEJ-200) can thus be calculated by using the conservation of energy:
in which Eis the energy of the incident photon and ENaI(Tl) is the energy of the Compton- scattered -rays deposited in NaI(Tl).
2.1.5 Compensation for plastic scintillator response
Several researchers have made an attempt to compensate the difference of plastic scintillator between soft tissue in response at low-energy photon region (< 200 keV). To optimize the air or soft tissue equivalent of low-energy photons, Mainardi et. al [[25],[26]] had proposed doping the plastic with silicon (14Si) and chlorine (17Cl) through Monte Carlo simulations, respectively. In tissue-equivalent material the absorbed energy should be proportional to that in the soft tissue. The author had mentioned that it was impossible to apply the same atomic composition of plastic scintillator to the whole energy region for medical application. Instead doping with chlorine at two different concentrations were proposed; low concentration for the diagnostic photon energies while higher one for radiotherapy. However the details of the concentration was not mentioned.
E
EJ-= E
−E
NaI Tl8
For the former point, BICRON Co., a commercial company making plastic scintillators verified that the silicon-doped scintillator is chemically unstable with poor optical clarity because high concentrations of silicon are necessary to increase the absorbed energy efficiency [26]. For the latter point, Williamson et al. in 1999 [27] tested the proposed chlorine-doped plastic scintillator (4% of Cl) for its response to low energy X-ray beams. The author considered the quenching effect by measuring the current value to determine the light output. Nevertheless, the compensation is less than expected for the flat response. The higher atomic number materials such as Pb or Bi would be good candidates for doping into plastic scintillators. In contrast, Lessard et al. [28] recently demonstrated that the standard plastic scintillator could be applied for photon dosimetry in the low energy X-ray field. The expected underestimation of response in low energy X-rays field was compensated by applying the correction factors based on the medium differences, to overcome the energy dependence or quenching effects.
2.2 D
EVELOPMENT OF CALIBRATION FIELDIn application of photon (gamma/X) detector and dosimeter, energy of radiation is one of the major sources to distort their response. When radiation detector is calibrated, it is desirable to calibrate for wide energies. Most of the detector and dosimeter are calibrated with Cs-137, 662 keV mono-energetic gamma-ray source. As an example, the 200 keV energy region is critical for the response of a dosimeter owing to the transition point of photon interaction from the photoelectric effect to Compton scattering. Thus, calibration for the low energy region is necessar to edu e a u e tai t o t i utio s f o the dete to s energy response to the measured data. Stable sources mostly concern higher monoenergetic regions and one must accept the presence of errors in low energy measurements because do not have an adequate calibration field. Therefore, a low energy monoenergetic field would be desirable to determine the energy dependence of dosimeters in this energies.
For ensuring the accuracy of photon dosimetry, calibration of dosimeters is actively carried out at several laboratories such as at the Facility of Radiation Standard, JAEA (Japan) and at National Institute of Standard and Technology, NIST (US). Monoenergetic photon fields are preferable for this purpose since the energy response of dosimeters becomes more obvious. Several radioactive sources with known activities have been widely used for this purpose—primarily photon energies exceeding 600 keV except for Am-241 (60 keV). Between 60–600 keV, filtered X-rays are also candidates though they are broader in energy width and are less affordable to prepare. Around 200 keV is missing energy for calibration (Figure 3). Several short, half-life radioactive sources that suit this energy range are inadequate as references. As such, a stable monoenergetic field with approximately 200 keV of energy was most desirable for study purposes.
Figure 4 shows a Compton-scattered photon and its energy dependence as a function of scattering angle. Backscatter radiation is the radiation scattered with a large angle after undergoing Compton scattering interaction inside the material. According to kinematics of Compton scattering, the Compton-scattered photon energy can be calculated by:
ℎ�
′= ℎ�
+ ℎ� − ��
9
where hv is the energy of the incident photon, hv' is the energy of the Compton-scattered photon, θ is the scattering angle between the directions of the incident and Compton- scattered photons, and mc2 is equal to 511 keV, denoting the energy of an electron at rest.
As far as I searched the literature, no paper has been published on the use of Compton scatted photon for calibration field. In this thesis, backscattered is proposed to produce quasi-monoenergetic radiation around 200 keV. From Figure 4, all the gamma rays from Co- 60, Mn-54, and Cs-137 have Compton-scattered photon energies from 180 to 210 keV for s atte i g a gle, θ, et ee -180°. Theoretically, the Compton-scattered photon energy widths at this scattering angle range for Co-60, Mn-54, and Cs-137 are 12.7 keV, 10.5 keV, and 9.4 keV, respectively. If the Compton-scattered photon which has a scattering angle of 150-180° is selected, its energy range is about 200 keV.
10
Figure 2 Total stopping powers of electrons calculated with the ESTAR database for vinyltoluene based materials [20].
11
Figure 3 The available candidates of photons radiation for calibration. The rectangle red box is concerning candidates of photons energy around 200 keV such as short half-life (T1/2) sources and broad X-ray beam. Development of a calibration field is highly desired within this energy range.
Figure 4 Compton-scattered photon energy as a function of the scattering angle θ, al ulated according to the Compton scattering equation for Cs-137 (662 keV), Mn-54 (835 keV), and Co-60 (1173 and 1333 keV).
12
E XPERIMENTAL SETUP AND C ALCULATIONS
3.1 D
EVELOPMENT OF D
ETECTOR
3.1.1 Preparation of plastic scintillators
The scintillation detector consists of plastic scintillator and photomultiplier tube (PMT). The properties of the plastic scintillators (Eljen Technology, Sweetwater, TX, USA) [29] used in this study shown in Table 2. Matching their emission spectra to the eadout de i e s photocathode-sensitivity spectra is important for efficient light collection. The emission spectra of EJ-200 (and EJ-256 for lead-doped scintillator) as functions of wavelength vary mostly from 400–500 nm (Figure 5(a) & (b)). The emission spectrum peaked at 425 nm. The readout device used was a photomultiplier tube Model R375 from Hamamatsu [30] with a diameter of 5.1 cm. The quantum efficiency of the photocathode also varies as a function of wavelength (Figure 5 . The peak a ele gth of the PMT s spe t al espo se o u ed at 420 nm, which is close to the photon emission spectra of both scintillators. The effective diameter of PMT is 4.6 cm.
The hole setup has to e light‐tight apped to a oid a a kg ou d light that a cause damage to the PMT. The scintillators were prepared with the following steps: (1) Three layers of white Teflon tape were applied to fully cover all of the non-exiting surfaces of the scintillator (Figure 6). (2) Optical silicone grease (Model: EJ-550) was applied between the PMT and scintillator for coupling. To remove any air bubbles, light pressure was applied between them during the coupling process. (3) The scintillator-PMT was then wrapped with a black tape to improve the light reflection and for the safety of PMT. (4) All of these were wrapped with aluminum foil.
3.1.2 Calibration of plastic scintillators
In this study, the coincidence technique was adopted. Pulse-mode ADC was used as the readout electronics for pulse processing and triggering. The lower-level discriminators (LLD) of the ADC were fixed to 15 channels for spectra with 1024 channels. The same discriminators were applied to other ADC channels used (including reference detectors). The zero baseline of all the amplifier outputs were checked (and adjusted if necessary) prior to the measurement by monitoring with an oscilloscope. The pulse height was then calibrated with a high precision pulse generator (Model 419, ORTEC). The zero offset of the pulse height was deduced for each ADC channel.
Two sets of detectors—target (EJ-200/EJ-256; 5.1 cm diameter x 1 cm long) and reference (NaI(Tl); 5.1 cm diameter x 5 cm long)—were arranged to face each other at a distance of 10 cm, as shown in Figure 7. The same design and dimension of the detector holders (acrylic) of both detectors ensures they are in aligned to each other. The gamma ray source was placed between the target detector and the reference detector. The photons from the gamma ray source that enters the target scintillator will be reflected to the reference detector in 180° scattering angle owing to the face-to-face geometry.
13
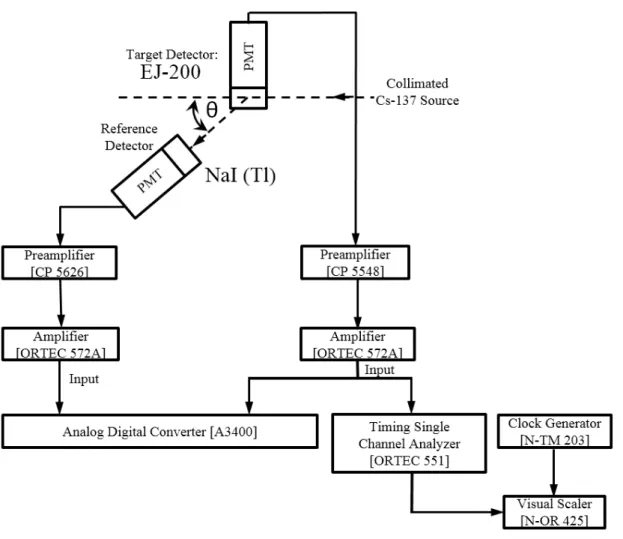
High voltages of +550 V and +500 V were applied to the PMTs of the target scintillator and reference detectors, respectively. Signals from the PMTs were fed into preamplifiers (Model 5548, Clear Pulse for target and Model 5626, Clear Pulse for reference detector), the outputs of which were processed by the primary amplifiers (ORTEC 572A). All amplifier outputs were fed into an analog-to-digital convertor (ADC) (A3400, Niki Glass Co Ltd.). Pulse height data were accumulated using VMEbus and recorded event by event with timestamps (5 ns step) in the hard disk drive of a personal computer connected to Gigabit Ethernet. The data acquisition system can be applied to up to 16 channels with 105 events per second for each ADC board.
3.1.3 Electron response of plastic scintillators
Figure 8 shows the experimental setup. Cs-137 (200 MBq) was placed inside the full lead housing consisting of blocks 5 cm thick, one with a collimator hole 1 cm in diameter. The distance between the source to the collimator was 20 cm. The target scintillator (EJ-200; 5.1 cm diameter x 5 cm long) was placed 30 cm from the outer surface of the lead housing. The side wall of the target scintillator was arranged to face the collimator hole. The beam diameter irradiating the target scintillator was 2.2 cm. The central axes of the source, collimator hole and the target scintillator were aligned. The distance between the target scintillator and reference detector was 40 cm, and both were aligned.
Figure 9 shows the block diagram of the readout electronics. High voltages of +800 and +500 V were applied to the PMTs of the target scintillator and reference detectors, respectively. Signals from the PMTs were fed into preamplifiers (Model 5548, Clear Pulse target and Model 5626, Clear Pulse for reference detector), the outputs of which were processed by the primary amplifiers (ORTEC 572A). The minimum dead time occurred with a shapi g ti e of . μs. All su se ue t easu e e ts e e pe fo ed ith the sa e settings. All amplifier outputs were fed into an analog-to-digital convertor (ADC) (A3400, Niki glass Co Ltd.). Pulse height data were accumulated using VMEbus and recorded event by event with timestamps (5 ns step) in the hard disk drive of a personal computer connected to Gigabit Ethernet. The data acquisition system can be applied to up to 16 channels with 105 events per second for each ADC board. The low-level discriminator of the ADC was set at 15 channels over 1024 channels. The target scintillator count rate per second was 7135 ± 18 cps. The electronic parts and their parameters were kept constant throughout the experiment.
Experimental data are taken for the fourteen scattering angles from 15 to 140 degrees by changing the position of the reference detectors. The angle range corresponds 34 to 462 keV for a Cs-137 source. Each run typically takes two hours to obtain enough statistics for coincidence counts. Data are also taken for NaI(Tl) (OKEN, standard type 8A8) of 5 cm in diameter and 5 cm in length by coupling to the same photomultiplier (Hamamatsu, R375) as a target scintillator. This confirms the validity of the experimental data through comparison with data taken previously. For NaI(Tl), nine hours was required for each run due to a lower probability that a gamma ray paths through the scintillator with one Compton scattering and without more interactions. Since longer acquisition times were necessary, an additional three units of reference detectors, NaI(Tl) (Model: OKEN; 5 cm in diameter and 5 cm in length) were prepared for simultaneous use.
14 3.1.4 Energy resolution of plastic scintillator
The pulse height distribution for photons at a hundred keV or more usually lack a total energy absorption peak, and is only a Compton continuum. Due to this, it is difficult to argue in detail about the energy resolution. As example, the energy resolution had been systematically studied by Hohara et .al [31] through finding the agreement between the measured and simulated spectra.
The low energy photons from Am-241 shows a clear photoelectric peak. The energy resolution of the scintillator was obtained from the measured photopeak of Am-241 by Gaussian fit (FWHMo). For smearing of calculated spectra, energy dependency of the resolution (FWHM) was assumed to be a proportional ratio to square-root of the energy (E) as in Equation 5;
in which FWHMo value is determined for the photo-peak of Am-241 (Eo).
3.1.5 Pulse height distribution spectra 3.1.5.1 Experimental procedure
The pulse height spectra were measured from the 60 keV to 800 keV energy range. Am- 214, Co-57, Cs-137 and Mn-54 were employed as standard sources. Experiments were performed in an open geometry with a source located at a distance of 10 ± 0.15 cm on the axis of the scintillator (Figure 10). The measurements were performed for both standard (EJ- 200) and lead doped (EJ-256 0.5 % Pb) plastic scintillator of the same size (5 cm diameter x 1 cm long). Both were coupled to the same single photomultiplier tube (Hamamatsu, R375), which is the same one used in Compton coincidence measurements. The environment background measurements were performed at the same place to obtain the net counts.
The same bias voltage, shaping time and data acquisition system were used as in section 3.1.3 for energy calibration. The quality of the detector wrapping was checked with and without the light shield-box by monitoring the average background count rate in both conditions. For the measurements reported here, the difference between count rates was negligible. Poor wrapping condition may introduce unnecessary counts or noise which affects the pulse height spectra.
3.1.5.2 Calculation procedure
3.1.5.2.1 Calculation of pulse height distribution
Monte Carlo code for electron and photon transport (EGS5 code [32]) was used to calculate the scintillator pulse height spectra. The photons interaction such as photoelectric absorption, Compton scattering and pair productions were considered. The branching ratio of the gamma sources were sampled as the JRIA data book [33]. The calculation geometry is shown in Figure 11. The photo s e e e itted i the π di e tio to i lude the effe t of plastic source casing. The scintillators material data and its density for the calculations correspond to the manufacturers data (Table 2). For accurate calculation of scintillator pulse
�� = ��
√ /
15
height spectra, two parameters were determined experimentally to include in the calculations; the non-proportionality of light output and energy resolution in the plastic scintillator. The energy resolution will be discussed in the section 4.1.3
For the first case, calculation of the spectrum corresponds to the energy deposition of the gamma sources (C1). In the second case, the scintillator non-proportionality (ionization quenching) was considered (C2). A subroutine consisting of the data of total light output as Equation 2 (kB=0.016 g cm-2 MeV-1) was included inside the user code to calculate the absorbed energy with light output dependent. The Birks parameter of the kB value comes from an experimental measurement as reported in section 4.1.2. The measured relative electron response is normalized at 0.462 MeV as per experiment data. A normalization factor at the same energy was calculated to apply on the all calculated light output results inside the user code.
3.1.5.2.2 Calculation of a normalization factor for electron Quenching effects
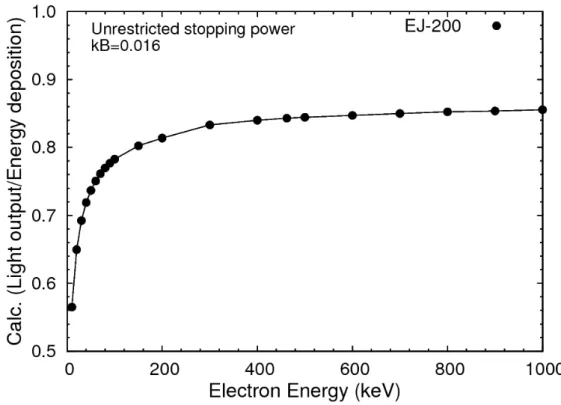
The light output as a function of electron energies were calculated with the Birks formula. The effect of electron binding energy and Moller scattering were included in the calculation. According to the Birks formula, there are two parameters needed for input in the calculation; the kB value and the total stopping power (dE/dx). The kB value of 0.016 is used as determined from the measurement. The total stopping power of EJ-200 scintillator was deduced from the EGS5 code and extrapolated down to 1 keV (Figure 12). The user code was opted for unrestricted collision and radiative stopping power for the material data of EJ-200. The ratio of light output to the incident electron energy is shown in Figure 13. For the calculation reported here, the normalization factor was calculated at 0.462 MeV. The value of normalization factor derived from the figure is 1.186. Nevertheless, Figure 13 indicated that above 0.462 MeV, the results with quenching effect are similar to the energy deposition. They are not dependent on the kB value. Finally, the same normalization factor was applied on the light output results inside the user code to yield the pulse height distribution with normalized quenching effect. The pulse height spectrum of several gamma-ray sources were calculated for both scintillators of EJ-200 and EJ-256 (0.5 % Pb) to be compared with the experiment.
16
3.2 D
EVELOPMENT OFC
ALIBRATIONF
IELD3.2.1 ~200 keV photon field by backscatter layout
The basic backscatter layout is shown in Figure 14. A lead block was used to absorb the direct component. The floor served as the scattering material. When the primary photon was removed on a sufficiently thick lead block, the backscatter photons that were scattered by the floor with large angles could be measured, as indicated by the solid arrow line in the figure.
3.2.1.1 Backscatter Layout Optimization by Calculations
In order to improve the backscattered field photon spectra, the arbitrary parameters of the backscatter layout were studied with Monte Carlo simulations. The first three parameters shown in Table 3 were optimized to enhance the backscatter peak and to reduce the lower energy components.
The EGS5 code was used to calculate the backscattered photon spectra and ambient dose equivalent (Sv/photon). Surface crossing was used to calculate the back-scattered photon dose and spectra on the surface of 2 cm x 2 cm (X-Y axis system) scoring region. In order to obtain ambient dose equivalent, air absorbed dose (Gy) was calculated as a first step by using kerma approximation. A function was adopted in the calculation to evaluate the ratio of ambient dose equivalent (Sv) to air absorbed dose. Then the ambient dose equivalent was calculated by multiplying the ratio of ambient dose to air absorbed dose.
The geometry used in the calculations is the same as that shown in Figure 14. The scoring region was positioned at a detector-to-lead distance (DPD) of 15 cm from the top of the 10 cm x 10 cm x 10 cm lead block. The source was placed at a source-to-floor distance (SFD) of 20 cm from the surface of the concrete floor. A single-energy, 662keV point isotropic source was used in the calculation, and the solid angle of the sou e photo s as π, as i experiment. The concrete floor was a cylinder with a radius of 150 cm and a height of 1 m.
Two indicators were used to study the obtained photon spectra: the mean energy and the peak-to-total ratio. The average energy (<E>) of a photon spectrum was calculated by the Equation 6:
(6)
where f(E) is the number of photons with energy E. Each photon was multiplied by its corresponding energy and all the product was integrated over the whole spectrum. The integral of all the products were divided by the total number of photons to yield the mean energy. The peak-to-total ratio is defined as the ratio of the integral number of photons of the backscatter peak to the total number of photons over the entire spectrum. The peak boundary of backscattered photons was determined as ± 10 keV from the peak centroid. The ambient dose equivalent (Sv/photon) was also calculated for each examined layout parameter.
17
3.2.1.2 Uniformity of the Backscattered Photon Field
The optimal backscatter layout to provide a uniform backscattered field was obtained from experiments and calculations. The goal was to obtain a uniform backscattered radiation field with less than 10 % variation over a wide area. Thus, the position dependence of the field was examined for the spectral shape and dose rate by changing the detector position and scoring region (temporarily set as DPD=15 cm) under the predetermined backscatter layout. It is important to establish a uniform radiation field at the detector location to reduce the position dependence of the calibration field for application to various sizes of dosimeters and detectors.
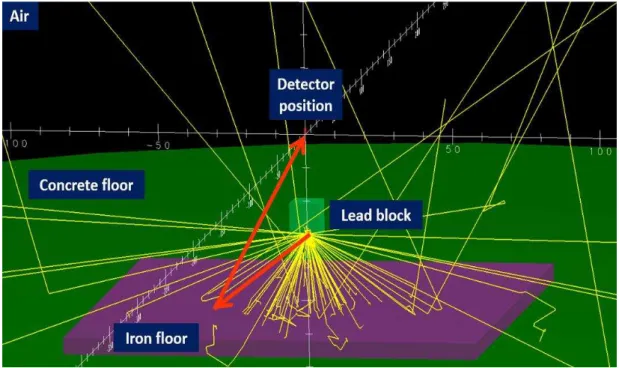
The experimental backscatter layout used in this study is shown in Figure 15. The layout features optimized parameters, such as lead block thickness of 10 cm, SFD at 20 cm, and the added 1.4 m x 1.4 m x 0.05 m square of iron on the concrete floor. The uniformity of the backscattered radiation field in the tested area was examined vertically and horizontally. The same optimized layout was also modelled in EGS5-CGview [34]for uniformity studied as shown in Figure 16.
The Cs-137 source used (AEA Technology QSA Inc., Code no: CDC 805) was sealed within a stainless steel capsule with dimensions of 6 mm (diameter) × 8 mm (length). The source was then placed under an aluminum case 45 mm (diameter) × 15 mm (thickness) with an acrylic window with a thickness of 1 mm. The source activity at the time of the experiment was 208 MBq (5.62 mCi).
The spectra of the backscattered photons were measured by a Cd1-xZnxTe detector (KROMEK, Model GR1) whose size was 1 cm x 1 cm x 1 cm. The dose rate was measured by a NaI (Tl) scintillation survey meter with a crystal size of 25.4 mm (diameter) × 25.4 mm (length) (ALOKA, TCS-171), and with an ionization chamber survey meter of 400 cm3 effective volume (ALOKA, ICS-321). The uniformity of the backscattered radiation field was examined at different DPD values in the vertical direction and with respect to the horizontal position of the detector.
3.2.2 ~200 keV photon field by an X-ray generator
Monoenergetic photon fields are indispensable for calibration of radiation detectors and dosimeters. An X-ray generator could produce photon energies about 200 keV by using appropriate filtration and voltage. Primary X-ray beams are polychromatic in nature with most of the photon average energy being one-third of the maximum energy of the X-ray. Therefore, filtration of the primary X-ray beam would reduce the total number of X-ray photons in the beam and removes a greater portion of the low-energy photons. Filters added to the X-ray beam are most often constructed of high atomic number materials such as lead, tin, and tungsten. In this present study, several sets of filters and applied peak voltages are demonstrated to provide a few hundred of keV mono-energetic photon field. Selection of filter materials and their thicknesses are based on data from ANSI, ISO, JAERI and NIST organizations [[35], [36], [37], [38]].
3.2.2.1 Calculation of photon spectra for filtered X-rays
SpekCalc software [39] was used to obtain the unfiltered X-ray spectra as a source input for EGS5 code. The code is used to select candidates for filter materials, thicknesses and combination. A strong single filter, Tungsten (W, with 5 mm thick) is chosen due to its narrow
18
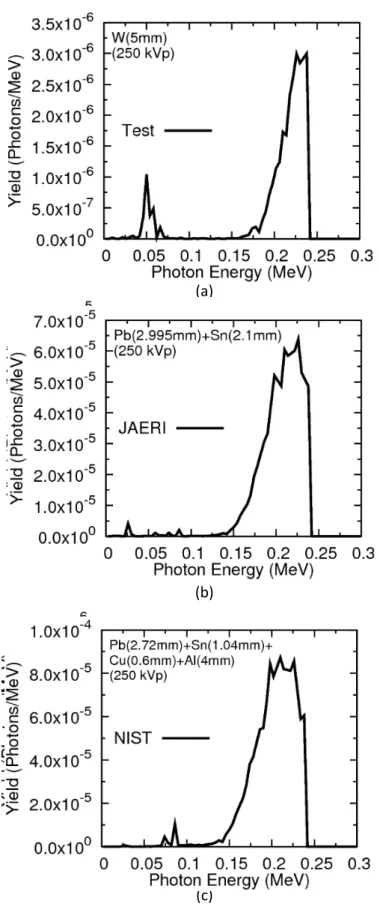
calculated photon spectra in comparison to literature filter sets with one drawback— the clear observed K X-rays of the tungsten filter. Figure 17 shows the calculated photon spectra for filtered X-rays of 250 kVp. The mean energy for (a) to (c) are 203, 209 and 206 keV, respectively. It was expected that the broad peak of the filtered X-rays will be measured concerning the broad width of the calculated photon spectra.
3.2.2.2 Measurements of suggested filter materials
The experiment is performed with the X-ray tube (Comet; MXR-320/26) at the radiation calibration facility, KEK, Japan. A distance of 5.3 m ± 1 cm between CdZnTe and filter surface was adequate to avoid significant dead time losses. The detector has a higher detection efficiency at X-rays energies. The lower energy threshold of the CZT was set to 24 keV (lower than default energy=32 keV) without any significant dead time effect observed for measurements. Three data were taken for each filters; (1) direct measurements with the filters, (2) measurements with filters with a lead bar was placed in front of the CZT to account the room-scattered radiation, and (3) background of radiation measurement. The measured spectra properties are evaluated as a result of mean energy, full energy peak, energy width and dose rate.
3.2.3 Spectrum measurement using CdZnTe detector
CZT detector have several advantages such as its compact size as well as stability and good energy resolution are very useful in the study and understand the photons field. To evaluate energy width for both backscatter and X-ray generator fields, a 1-cm3 CdZnTe detector (KROMEK Model GR1) was used. In previous studies, the problems of inactive layer and incomplete charge collection efficiency had been reported for the CZT detector (1-cm3). In this study, the measured peak efficiency (%) was compared to the literature data [40] and calculated in absolute values.
3.2.3.1 Measurement - calculation geometry
The check sources (as listed in Table 4) were placed 10 cm away from the surface of CZT as shown in Figure 18. All the sources used were encased in a plastic discs and were aligned to the center of CZT surface. The data acquisition and analysis of the photon spectrum were performed with its software (KSpect) running on a personal computer. The background radiation was taken at the same place as where the measurements were conducted. Figure 19 shows the model of CdZnTe detector in EGS5-CGview for particle trajectory. The main parameters of the geometry are:
(a) The active crystal area is 1.0 x 1.0 cm2, (b) The active crystal thickness is 1.0 cm, (c) The outer case is 1.2 mm thick aluminum, (d) The window is 0.5 mm thick aluminum,
(e) The distance from the window to the surface of the crystal is 5 mm.
The proportion numbers of CZT material components are 0.9, 0.1, and 1 for Cd, Zn, and Te respectively. Density is set as 5.86 g/cm3. The source was positioned at a 10 cm distance from the window corresponding to the measurement and literature geometry. The π isotropic source photons go toward the CZT and cover only the front face of CZT crystal area as shown in Figure 19.
19
From preliminary calculation, calculated peak efficiency exceed measurement. Thus calculation for CZT of several sizes were performed.
The peak efficiency depends on the geometry of the detector and crystal size. To assume the effect of insensitive region, the active crystal area was re-modelled. While remaining the original size of the crystal area . . , the effe ti e a ea that egiste ed the events was reduced. The outer part of the effe ti e a ea ould e o e the reflector. The geometries of the remodelled crystal depicted in Figure 20.
20
Table 2 Physical characteristics of the plastic scintillators studied
Scintillator model EJ-200 EJ-256 (0.5% Pb)
Size
Diameter (cm) 5 5
Length (cm) 1, 5* 1
Light output (% of anthracene) 64 56
Density (g/cm3) 1.023 1.028
Decay time (ns) 2.1 2.1
Max. emission spectrum (nm) 425 425
Typical light attenuation (cm) 380 -
Composition H: 0.084 H: 0.084
(proportions by relative C: 0.916 C: 0.911
atomic weight) Pb: 0.005
*A length of 5 cm was used for electron response measurement and 1 cm for photon dosimetry study.
21 (a)
(b)
(c)
Figure 5 Scintillator emission spectrum of EJ-200 (a) and EJ-256 (b) [29]. The wavelength peak of both scintillators is 425 nm. Figure 5 (c) shows PMT photocathode sensitivity as a function of incident wavelength of light [30]. The wavelength peak is 420 nm. The matching of the scintillator photon emission spectrum and PMT response is important fo effi ie t light olle tio . The figu es e e adopted f o the a ufa tu e s webpage.
22 (a)
(b)
Figure 6 Final appearance of the self-wrapped scintillator of both thicknesses with white Teflon tape; 5 and 1 cm are ready for use (a). Three layers of Teflon tape were used for better light reflection. The exit face of the scintillator (non-wrapped part) is optically coupled to the PMT of the same diameter with optical silicon grease (b).
23
Figure 7 Block diagram showing the electronics used in the experiment of coincidence. Two sets of detectors, target (EJ-200) and reference (NaI(Tl)), are arranged face to face. The separation between the target and reference detector is 10 cm. The gamma ray source is placed in the middle of the target detector and reference detector. The photons from the gamma ray source that enter the target scintillator will be reflected to the reference detector at a 1800 scattering angle because of the face-to-face geometry.
24
Figure 8 Schematic diagram of the setup for Compton coincidence technique in the actual scale size. The measurement was performed at the radiation calibration facility, KEK with a Cs-137 source intensity of 200 MBq. The Cs-137 source inside the lead housing was collimated to irradiate only the target scintillator. The collimator hole diameter is 1 cm. The beam diameter irradiated the target scintillator is 2.2 cm. The distance between the target and reference scintillator was fixed at 40 cm as for scattering angles (15o to 140o). The collimator opening, source, and target scintillator were in alignment. The same acrylic detector holder design and dimensions aligned both the target and reference detectors.
25
Figure 9 Block diagram showing the electronics used in the experiment.
26
Figure 10 Picture showing the direct measurement of gamma sources in open geometry. The distance is 10 cm between the sources and surface of the scintillator. All sources were encased in the same plastic housing.
Figure 11 Simulation geometry modelled in EGS-CGview for calculation of the scintillator energy deposition. The photo s e e e itted i π that as isot opi all i ide t to the plastic scintillator (PLS=5 cm long) which was coupled to the PMT window (Quartz=5 mm long). The wrapping materials such as Teflon tape and aluminium foils were ignored.
27
Figure 12 Total stopping power of electrons (dE/dx) passing through the plastic scintillator. The closed square is the data of the vinyltoluene-based scintillator from the ESTAR database [20]. The data for the scintillator (EJ-200) were calculated down to 1 keV by EGS5 code as open red circle.
Figure 13 The ratio of calculated light output to the electron energy deposition for a kB value of 0.016 g cm-2 MeV-1. At 0.462 MeV, the normalization factor is 1.186 and is applied to the light output results of EJ-200.
28
Figure 14 Basic setup of backscatter layout. The primary photons of the sources were absorbed by the lead block. The backscattered photons with energy of ~200 keV detected at the tested area as a result of Compton scattering with the floor by a large scattering angles.
Table 3 Example of layout parameters of Figure 14.There are four parameters would be optimized; lead block sizes, source to floor distance (SFD), scattering material, and detector
to lead distance (DPD).
Layout parameters Value of parameters
Lead block 10 cm x 10 cm x 10 cm
Source to floor distance (SFD) 20 cm
Scattering material Concrete floor of 1 m thickness Detector to Pb block distance (DPD) 15 cm
29
Figure 15 Partly optimized the setup of backscatter layout. The schematic consists of arbitrary (DPD) and the other optimized parameters. The tested area was investigated by optimizing the DPD parameter both vertically and horizontally.
Figure 16 The backscatter layout modelled in EGS5-CGview as Figure 15. Calculation performed on square of Iron blocks 1.4m x 1.4m area x 0.05m thickness on cylinder concrete floor of 3m radius with 1m thickness. Most of the scattered photon scored were mainly from the Iron floor.
30 (a)
(b)
(c)
Figure 17 Overview of the calculated photon spectra for X-ray of 250 kVp. In (a) is the proposed filter of tungsten (W). In (b) and (c) are the calculateded filters of JAERI and NIST, respectively. The mean energy for filters (a) to (c) are 203, 209 and 206 keV, respectively. A K X-ray peak of the filter tungsten yield is obvious in (a).
31
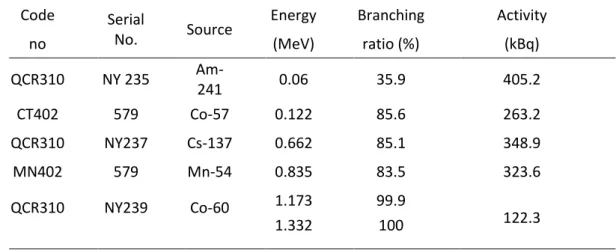
Table 4 The list of check sources used for measurements. The sources activity ranging from 120 to 400 kBq (as on 01.01.2015).
Code Serial
No. Source
Energy Branching Activity
no (MeV) ratio (%) (kBq)
QCR310 NY 235 Am-
241 0.06 35.9 405.2
CT402 579 Co-57 0.122 85.6 263.2
QCR310 NY237 Cs-137 0.662 85.1 348.9
MN402 579 Mn-54 0.835 83.5 323.6
QCR310 NY239 Co-60 1.173 99.9
122.3
1.332 100
Figure 18 The experimental setup used for measuring the absolute peak efficiency values. The gamma sources was aligned to the CZT front surface at a distance of 10 cm. The measured values obtained were compared to the literature and calculated data.
32
Figure 19 The model of CdZnTe 1cm3 crystal (KROMEK, Model GR1) in EGS5-CGview for particle trajectory. The outer case is aluminum of 1.2 mm in thickness. The window is aluminum of 0.5 mm in thickness. The distance from the window to the surface of the crystal is 5 mm. The density is 5.86 g/cm3. The proportion numbers of CZT material components are 0.9, 0.1, and 1 for Cd, Zn, and Te respectively.
(a) (b)
Figure 20 The calculated crystal areas of CZT from the front view. Several areas of the crystals were calculated. Figure (a) is the original area of 1.0 x 1.0 cm2 and (b) is 0.9 x 0.9 cm2 area of the region used to score in calculation while remaining its original size.
Air
CZT Air
Al housing
CZT of 0.9 x 0.9 cm2 CZT of 1.0 x 1.0 cm2
![Figure 2 Total stopping powers of electrons calculated with the ESTAR database for vinyltoluene based materials [20]](https://thumb-ap.123doks.com/thumbv2/123deta/6153013.102991/18.892.176.746.123.544/figure-total-stopping-electrons-calculated-database-vinyltoluene-materials.webp)