Food Chain Transparency for Food Loss and Waste Surveillance
Kudang Boro Seminar*
Department of Mechanical and Biosystem Engineering,
Bogor Agricultural University (IPB), P.O. Box 220, Bogor 16022, Indonesia
Food loss and waste is becoming one of the ultimate food system challenges and, therefore, is a topic of growing interest worldwide. Many approaches and methods have been suggested to prevent or reduce food loss and waste. This paper describes an approach to monitor and prevent or reduce food loss and waste by using a food chain trans-parency framework. Food chain transtrans-parency requires a comprehensive and integrated farm-to-table approach; it implies that all stakeholders (the producer, processor, transporter, vendor, and consumer) play a vital role in ensuring the reduction of loss and waste. Essential information in a food supply chain needs to be adequately recorded and provided for all stakeholders in the chain to promote transparency and to enable the surveillance of food loss and waste. With this systemized transparency, each of stakeholders in food production and consumption understands the relevant aspects of products, processes, and process environments supporting well-informed decision-making. The need for food chain transparency is very critical, particularly because food is a very vulnerable to depreciation of quality and quantity if not well taken care of. This paper addresses the motivation, problems and complexities; current state of the art; application practices; research needs; and the future research framework and initiatives in food chain transparency. Our research on a cattle identification and registration system and traceability systems for the pro-duction chains of frozen loin tuna and frozen shrimp in the digital business system is discussed to provide more insights on the state of the art and examples of implementation of food chain transparency systems.
Key words: CBIS, food chain transparency, food loss, food waste, surveillance
───────────────────────
Introduction
In agroindustry, products are processed in a chain that starts from farmers and extends to consumers (from farm to table). In such a food chain, loss and waste can occur either within the nodes or during transition between the nodes and is likely to propagate along the food chain, thus further increasing food loss and waste (Kantoret al., 1997).
A traceability system in a food supply chain is de-fined as documented identification of the operations that lead to the production and sale of the final product. Its objective is to identify the actors involved, trace relevant flows, characterize the material, its
process-ing, and management operations (Bertoliniet al., 2006). Food chain transparency requires a comprehensive and integrated farm-to-table approach, in which the pro-ducer, processor, transporter, vendor, and consumer all play a vital role in ensuring food safety and quality and preventing food loss. This can be achieved if every-body with stakes and interest in the food supply chain understands the relevant aspects of products, pro-cesses, and process environments that allow informed decisions (Schiefer and Deiters, 2013).
The reduction of food loss and waste across the entire food chain is a key element in increasing the efficiency of our food systems. This aim can be achieved by developing a systematic and integrated traceability
Received: September 23, 2015, Accepted: March 4, 2016
* Corresponding author: Department of Mechanical and Biosystem Engineering, Bogor Agricultural University (IPB), P.O. Box 220, Bogor 16022, Indonesia.
system embedded in the food chain. This paper de-scribes the use of a food chain transparency framework to monitor and reduce or prevent food loss and waste.
Critical factors affecting food loss and waste
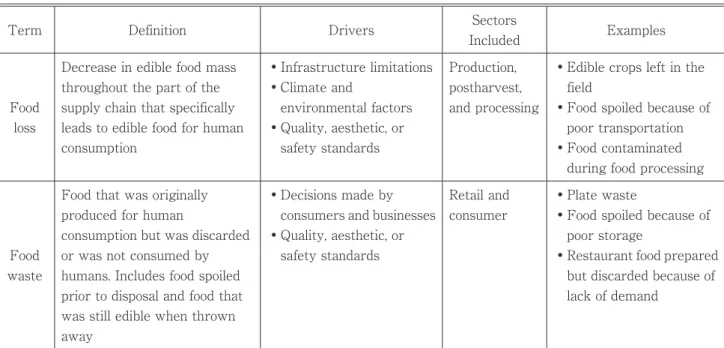
Because the terms “food loss” and “food waste” are often used interchangeably, it is important to dis-tinguish them on the basis of the definitions listed in Table 1.
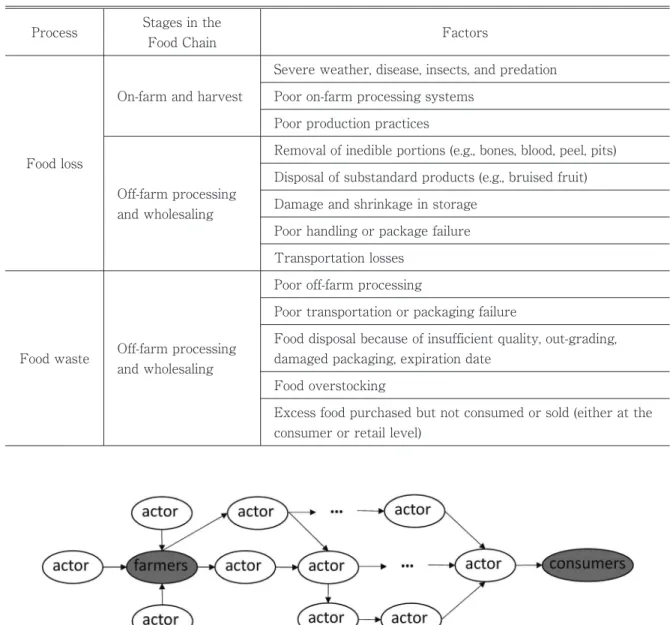
According to Kantoret al. (1997), Gustavssonet al. (2011), and Thyberg (2015), food loss and food waste can occur due to several factors described in Table 2.
Motivations for surveillance of food and waste
Food loss and waste surveillance is increasingly critical to ensure sustainable food production under the increasing of world population and food consumption and the decreasing of the carrying capacity of nature. A study conducted by Food and Agriculture Organi-zation (FAO) estimated that one-third (about 1.3 bil-lion tons per year) of all food produced for human con-sumption is lost or wasted (Gustavsson et al., 2011). The drive to address food loss and waste stems from increasing concerns about hunger, resource conserva-tion, the environmental and economic costs of food loss and waste, and a general trend in the waste
man-agement industry toward more sustainable practices. Therefore, reducing food loss and waste can help achieve socially, environmentally, and economically sustainable food systems (Thyberg, 2015). A surveil-lance system helps to improve precision and accuracy of food production systems with minimal undesirable social, environmental, and economic impacts. A sur-veillance system should enable quick and precise quantification of food loss and waste in a very trans-parent and systematic way.
Approaches to food loss and food waste surveillance
One of the approaches to food loss and waste surveillance is the use of a transparency framework (Schiefer and Deiters, 2013). In a food supply chain, essential information needs to be adequately recorded and for all stakeholders in the chain to allow trac-eability and to promote transparency along the chain. In food production, different food chains may form a network that stretches from farmers to consumers (Fig. 1). In addition, the complexity of the network is fur-ther characterized by its global orientation, which varies depending on cultural, political, and geographi-cal backgrounds, social and religious values, prefer-ences, diets, and prestige.
A framework of food chain has been developed by Barnard (2006), Schiefer and Deiters (2013), Min
J. Dev. Sus. Agr. 11 (1)
18 Drivers Production, postharvest, and processing Food loss Term
Table 1. Definitions of food loss and food waste (Thyberg, 2015).
●Plate waste
●Food spoiled because of
poor storage
●Restaurant food prepared
but discarded because of lack of demand
Sectors
Included
●Decisions made by
consumers and businesses
●Quality, aesthetic, or
safety standards
●Edible crops left in the
field
●Food spoiled because of
poor transportation
●Food contaminated
during food processing ●Infrastructure limitations
●Climate and
environmental factors
●Quality, aesthetic, or
safety standards
Examples Definition
Retail and consumer Food that was originally
produced for human
consumption but was discarded or was not consumed by humans. Includes food spoiled prior to disposal and food that was still edible when thrown away
Food waste
Decrease in edible food mass
(2004), and Yu (2012). The methods and tools for monitoring and quantifying food loss and waste have been developed by Bertoliniet al. (2006), Dananet al. (2011), Kantoret al. (1997), Kresna (2014), Berettaet al. (2013), and Thyberg (2015). Information technol-ogy (IT) mediated transparency methods have been developed by Bernard (2010), Seminar et al. (2010), Schiefer and Deiters (2013), and Ginantaka (2015).
A computer-based information system for food chain transparency
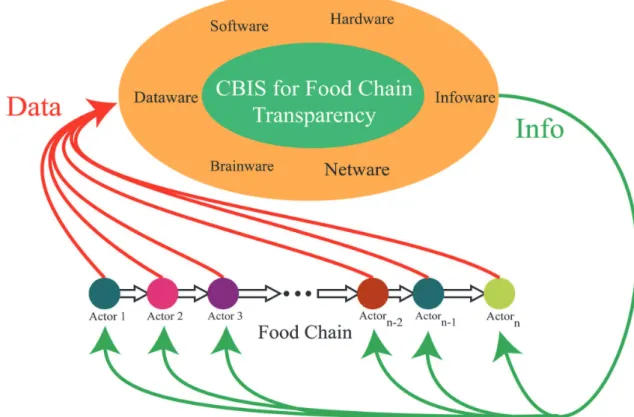
To serve the needs of food chain transparency, a computer-based information system (CBIS)
compris-ing hardware, software, dataware, netware, infoware, and brainware resources must be established to trans-form data into intrans-formation along the food chain. The CBIS can enable the achievement of transparency and surveillance goals in food production, delivery, and consumption (Fig. 2).
The hardware resources include sensing devices, data loggers, data scanners, communication devices, data storage, information displays, actuators, process-ing units (microprocessors), computers, smartphones, and communication devices. The software resources include: operating systems and related applications; database management system software; geographic
Severe weather, disease, insects, and predation
Food loss
Poor off-farm processing
Off-farm processing and wholesaling Food waste
Poor transportation or packaging failure Process
Table 2. Factors that affect food loss and waste.
Food overstocking
Disposal of substandard products (e.g., bruised fruit) Factors
Excess food purchased but not consumed or sold (either at the
consumer or retail level) Poor handling or package failure
Transportation losses
Damage and shrinkage in storage Stages in the
Food Chain
Removal of inedible portions (e.g., bones, blood, peel, pits)
Off-farm processing and wholesaling
Food disposal because of insufficient quality, out-grading,
damaged packaging, expiration date Poor on-farm processing systems
Poor production practices On-farm and harvest
information system (GIS) software; data acquisition, analysis, and reporting software; specialized applica-tions (such as knowledge management, enterprise re-source planning, decision support, and customer rela-tions management systems); and search engines for information retrieval.
The dataware resources include all data (historical, real-time, statistical, spatial, and geographical) related to any nodes (actors), processes (activities), events, food products, and quality standards. The netware re-sources include network access and control, commu-nication media, site directories, commucommu-nication pro-cessors, web services, and technology network clusters (intranet, extranet, and internet). The information re-sources include (in a digital or printed form) opera-tional and managerial reports, forecast and trend analy-sis reports, early warning signals, and decision sce-narios and options. The brainware resources include all actors involved in the food chain and CBIS, such as database administrators, chief information officers, management information system managers, subject-matter experts and specialists, and end users.
Importantly, the CBIS supports (1) various algo-rithmic, programmable computational scenarios; (2)
real-time, objective, and precise data acquisition from any nodes (actors) of the food flow at any stage; (3) storage of massive amounts of graphical, spatial, temporal, statistical, and serial data (in the form of text, video, and audio) related to processes, objects, and actors; and (4) linking, tracing, and unifying all actors at different stages, geographical areas, and time zones. The increased diversity of products, processes, in-formation, or actors increases the need for diverse ser-vices of transparency (Schiefer and Deiters, 2013). Therefore, there is also a need for diverse resources of CBIS to support the surveillance of food loss and waste.
State of the art in food chain transparency and traceability
A CBIS model for cow identification and registra-tion has been developed (Seminaret al., 2010). This system can be used as part of a transparency system in the beef supply chain from breeding units to retailers and consumers. Every cow that has been delivered or imported from abroad is identified and registered in the system; all critical information about the cow can then be acquired at various stages of the supply chain for
J. Dev. Sus. Agr. 11 (1)
20
traceability purposes. In the proposed system, the data can be captured with various input devices (such as RFID sensors, cow muzzle print sensors, ear tag sen-sors, GPS microchips and electronic collars, brand and tattoo sensors). Some sensors can store particular sets of data about individual cows including the date of birth and birth weight, pedigree, health history, size, ownership, movement history, and skin or fur color. Remote data acquisition and delivery can also be done using mobile devices such as hand phones via short message service (SMS) or multimedia message service (MMS), or via web access facilities. The proposed system has been extended and integrated into the e-livestock framework in Indonesia (Ramadhan, 2013). Although a prototype system for CBIS-based cow identification and registration was proposed to the Ministry of Agriculture of Indonesia, a full version was not implemented.
A laboratory-based surveillance system for isolation ofSalmonellain the food chain was integrated into the French Food Safety Agency’s working plan (Dananet al., 2011). This early warning system used statistical methods to detect unusual events of Salmonella con-tamination as early as possible. During an experimen-tal period (>1 year), several such events were detected and confirmed promptly at the national or regional level. This evaluation also reinforced the position of the Salmonella network as an integral part of the national public health surveillance system. The cur-rent shortcoming is that not all actors in the food chain allow data acquisition, processing, and reporting in an objective, standardized, periodical, accurate, coherent, and timely manner.
Beretta et al. (2013) developed a model for the analysis of the energy flow in the food supply chain to quantify food losses (including imported products) in Switzerland. Data collected from the firms (actors) involved in the food value chain are converted into food loss values on the basis of the caloric content of the output expressed as a percentage of that of the input into the corresponding stage. However, the amount of food losses is not suitable as the sole indicator of the potential to reduce food losses. The actors incorpo-rated in the model includes an agricultural production firm, a harvest handling and trade firm, a processing firm, food service industry, retailer, and a private household. The authors applied this model to various food categories including fresh vegetables, bread and pastries, and eggs, and reported that 48% of the total
caloric content of the food produced in Switzerland is lost. Half of these losses was inevitable without ap-propriate mitigation measures. However, the use of CBIS, especially for real-time and periodic data ac-quisition, in this flow analysis model was not explicitly stated.
On the basis of ISO 28000, Kresna (2014) devel-oped a model to assess implementation of traceability of the frozen loin tuna distribution chain in Indonesia. The model examines three aspects: (1) the security system in the distribution chain; (2) critical risk man-agement in the process of product distribution; and (3) compliance of the distribution process with ISO 28000. The distribution chain stretches from fishing vessels to exporters.
The developed model focuses on food safety, par-ticularly on the histamine level and the content of metal flakes in tuna loin products. The histamine level is measured by using two indicators, total plate count and total volatile base, which can affect the quality and safety of tuna products. The United States Food and Drug Administration (FDA) allows histamine levels of
<50 ppm. The authors did not specify the use of an integrated CBIS, especially for real-time and periodic data acquisition.
Conclusion and future directions
This paper has discussed the groundwork to develop a computer-based information system (CBIS) for food chain transparency needed to implement food loss and waste surveillance. The critical importance of and motivation for food chain transparency and traceability has been emphasized. A road map of research work on food loss and waste surveillance has been highlighted to guide future research directions. Several imple-mented food chain transparency systems have been discussed to reveal some implementation issues and the use of CBIS to support the systems.
Although many systems have been proposed and developed for implementation of food chain trans-parency, only a few have emphasized the use of CBIS for real-time data acquisition. Therefore, the use of wireless sensors for real-time data acquisition needs to be explored. Because of the nature and complexity of a food chain that involves diverse and dispersed actors and resources, the use of emerging technologies (such as cloud, ubiquitous, mobile, intelligent, and distri-buted computing technologies) is worth pursuing. Whereas this paper has focused on the technological perspectives, supplementing institutional, policy, so-cial, and cultural behavior should receive more atten-tion to ensure the implementaatten-tion and best practices in food chain transparency for food sovereignty and security, and reduction of food loss and waste.
References
Barnard, J.H., 2006. A multi-view framework for defining the services supply chain using object oriented methodology. University of Central Florida, UMIDissertations Pub-lishing.
Beretta, C., Stoessel, F., Baier, U., Hellweg, S., 2013. Quantify-ing food losses and the potential for reduction in Swit-zerland. Waste Management 33, 764-773.
Bernard, J.-G., 2010. Understanding the functions of IT-enabled transparency in organizations: A theoretical explanation
from a case study of high-growth ventures. PhD Thesis, Queen’s University (Kingston, Ontario, Canada), UMI Dissertations Publishing.
Bertolini, M., Bevilacquab, M., Massinia, R., 2006. FMECA approach to product traceability in the food industry. Food Control 17, 137-145.
Danan, C., Baroukh, T., Moury, F., Jourdan-Da Silva, N., Brisabois, A., Le Strat, Y., 2011. Automated early warning system for the surveillance of Salmonella isolated in the agro-food chain in France. Epidemiol. Infect 139, 736 -741.
Ginantaka, A., 2015. An analysis and design of frozen shrimp traceability system based on digital business system. Mas-ter Thesis. Bogor Agricultural University (Indonesia). Gustavsson, J., Cederberg, C., Sonesson, U., 2011. Global food
losses and food waste. FAO. ISBN 978-92-5-107205-9 Kantor, L.S., Lipton, K., Manchester, A., Oliveira, V., 1997.
Es-timating and Addressing America’s Food Losses. Food Review, http://www.gleaningamerica.net/PDFs/USDA-Jan 97a.pdf, accessed on August 17, 2015.
Kresna, B. A., 2014. Assessment of traceability implementation in supply chain of frozen loin tuna with ISO 2800. Master Thesis. Bogor Agricultural University (Indonesia). Min, J. U., 2004. Supply chain visualization through Web
services integration. Stanford University, ProQuest, UMI Dissertations Publishing.
Ramadhan, A., 2013. E-Livestock in Indonesia: Definition, success factors, and models. PhD Dissertation. Faculty of Computer Science, University of Indonesia.
Schiefer, G. and Deiters, J., 2013. Transparency in the food chain. International Center for Food Chain and Network Research, University of Bonn, Germany, ISBN 978-3-941766-17-4.
Seminar, K. B., Sumantri, C., Zakaria., 2010. Basic study on identification and registration system for local beef cattle breeding. Project Report, PT Prima Kelola, Bogor Agri-cultural University (IPB).
Thyberg, K. L., 2015. Food waste and sustainability: Quantify-ing food waste disposal and evaluatQuantify-ing the environmental impacts of technologies and policies. Stony Brook Uni-versity, UMIDissertations Publishing.
Yu, M., 2012. Analysis, design, and management of supply chain networks with applications to time-sensitive pro-ducts. University of Massachusetts Amherst, ProQuest, UMIDissertations Publishing.
J. Dev. Sus. Agr. 11 (1)