The Effect of Damage on
the Fracture Toughness of
C/C Composites
Lars Denk
DOCTOR OF PHILOSOPHY
Department of Space and Astronautical Science
School of Physical Science
The Graduate University for Advanced Studies
01.01.2010
2
Content
1. Introduction ... 7
1.1 What are C/C composites? ... 7
1.2 Material constituents of C/C ... 7
1.3 Chemical structure and production route of the carbon fibres ... 9
1.4 Applications of chopped, continuous and woven fibres ... 10
1.5 Production routes for C/C composites ... 12
1.6 Specific advantages and resulting applications of C/C composites ... 14
1.7 Specific drawbacks of C/C composites ... 15
1.8 Route of discussion ... 15
2. State of research on the fracture of C/C ... 19
2.1 Fracture ... 19
2.2 The shear band effect ... 20
2.3 Tensile fracture criteria to predict failure of C/C ... 25
2.3.1 Fracture toughness criterion ... 25
2.3.2 Point stress criterion ... 28
2.3.3 Net stress criterion ... 29
2.4 Summary ... 29
3. Observation of crack extension ... 33
3.1 Introduction ... 33
3.2 Experimental procedure ... 34
3.2.1 Material ... 34
3.2.2 Experiments ... 35
3.2.2.1 Tensile properties ... 35
3.2.2.2 DEN test... 36
3.2.2.3 3-point bending tests of pre-loaded DEN tensile test specimens ... 37
3.2.2.4 Compact Tension (CT) Tests ... 38
3.2.3 Finite element calculations ... 39
3.3 Results ... 39
3.3.1 Basic tensile test results of smooth CP 0/90 specimens ... 39
3.3.2 Results of smooth specimens with changing stacking sequence ... 42
3.3.3 Tensile test results of DEN type-specimens ... 43
3.3.4 3-point bending test results of preloaded DEN-type specimens ... 46
3.3.5 Tensile test results of CT–type specimens ... 47
4
3.4 Discussion ... 51
3.4.1 Transition from mode I to mode II fracture ... 51
3.4.2 Shear bands ... 52
3.5 Conclusion ... 54
4. Shear Properties of C/C composites ... 57
4.1 Introduction ... 57
4.1 Experimental Procedure ... 57
4.1.1 Material ... 57
4.1.2 Shear Tests ... 59
4.1.2.1 Iosipescu Test ... 59
4.1.2.2 45 Off-Axis and 10 Off-Axis Shear Test ... 61
4.1.3 Experiments to Determine the Failure Mechanisms ... 62
4.1.3.1 Detection of Fibre Failure ... 62
4.1.3.2 Detection of Inter-laminar Shear Failure ... 62
4.1.3.3 Determination of the Onset of Matrix Cracking ... 63
4.2 Experimental Results ... 64
4.2.1 Comparison of the Shear Tests ... 64
4.2.2 Basic Shear Stress-Strain Data Acquisition for FEM ... 66
4.2.3 Shear Strength as a Function of the Stacking Sequence ... 66
4.2.4 Shear Failure Mechanism ... 68
4.3 Discussion and Summary ... 71
4.3.1 Shear fracture process ... 71
4.3.2 Conclusion ... 74
5. Tensile strength enhancement (TSE) ... 77
5.1 Introduction ... 77
5.2 Material ... 77
5.3 Mechanical tests ... 78
5.3.1 Static tensile, shear, and flexural tests ... 78
5.3.2 Tensile tests of double-edge notched (DEN) specimens ... 79
5.3.3 Tensile tests after fatigue damage ... 80
5.3.4 Tensile tests after shear damage ... 80
5.3.5 Bending strength after oxidation damage ... 81
5.4 Experimental results ... 82
5.4.1 Static tensile and shear behaviour of C/C composites ... 82
5.4.2 Tensile strength of DEN specimens ... 84
5.4.3 Residual strength of fatigue-loaded C/Cs ... 84
5.4.4 Tensile strength of shear damaged specimens ... 86
5.4.5 Bending strength of oxidation-damaged specimens ... 88
5.5 Discussion ... 90
5.6 Summary ... 90
6. Tensile fracture behaviour ... 93
6.1 Introduction ... 93
6.2 Experimental procedure ... 93
6.2.1 Material ... 93
6.2.2 Tensile fracture tests ... 94
6.2.3 Fibre bundle push-out tests ... 94
6.3 Results ... 95
6.4 Discussion ... 99
6.5 Summary ... 100
7. Analysis of holed specimen ... 101
7.1 Introduction ... 101
7.2 Experimental procedure ... 102
7.2.1 Material ... 102
7.2.2 Tensile fracture tests of multi-holed specimens... 102
7.3 Finite Element (FEM) analysis ... 104
7.3.1 Linear FEM ... 104
7.3.2 Non-linear FEM ... 105
7.4 Results ... 106
7.4.1 Tensile test results of the multi-holed specimen ... 106
7.4.2 Simplification of multi-holed geometry ... 107
7.4.3 Effect of non-linear stress-strain behaviour ... 110
7.4.4 Prediction of fracture behaviour ... 112
7.4.5 Summary ... 113
8. Toughening of C/C... 115
8.1 Toughening mechanism ... 115
8.2 Outlook ... 121
9. Summary ... 123
9.1 Summary of this work ... 123
9.2 Summary with respect to the chapters ... 123
Acknowledgement ... 127
6
Abbreviations and Symbols
remote loading stress
max ultimate tensile strength
f,net tensile net fracture stress
net,ave tensile net average stress
gr,ave tensile gross average stress
x local stress in x-direction
y local stress in y-direction
a crack length
a notch length
d0 characteristic distance ahead of a crack
where the local stress x just reachesmax
r 0°-ply fraction
t thickness
w width
wnet net sectional width
WL total ligament width of a DEN specimen
x distance from the crack tip in x-direction
F load
Fmax fracture load
G12 shear modulus
KI stress intensity factor under mode I
KIC critical stress intensity factor, also called
(fracture) toughness of the material
CP cross-ply
UD uni-directional
C/C carbon-carbon (composite)
DEN double-edge notched specimen geometry
CT compact-tension specimen geometry
shear stress
d interfacial debonding stress
u the ultimate tensile fracture strain
bulk density
GIc critical energy release rate under mode I
GIIc critical energy release rate under mode II
GR crack extension resistance
1. Introduction
1.1 What are C/C composites?
Carbon-carbon (C/C) composite is at present the most mature high temperature material retaining its superior specific strength and specific modulus at temperatures above 2000°C , . It consists of carbon or graphite fibre reinforcement in a carbon or graphite matrix and thus, both the matrix and the fibres have the same material constituents, e.g. the chemical element carbon.
The first carbon-carbon composite was obtained by accident in 1958 . In a chemical analysis to evaluate the volume fraction of the reinforcement, a polymer matrix composite, PMC was exposed to air at elevated temperature, and the lid of the test chamber was accidentally kept closed. Thus, instead of oxidising the matrix polymer, the PMC was pyrolised. The resulting resin-charred composite was found to possess structural durability, and consequently, the C/C composite was born.
Development of the C/C was at first slow but became rapid in the late 1960s. At that time the space shuttle program required a thermal protection material which had light weight, high thermal shock resistance, a low coefficient of thermal expansion, high stiffness etc. , , . Graphite has most of these properties but exhibits a low strength and in particular high toughness. Around this time, the production of high strength PAN-based-carbon fibres had started, and the related fibre-reinforced plastic industry had greatly advanced. In addition, new composite fabrication techniques were available . These factors fuelled the development of the C/C technology and carbon-carbon composites finally emerged as a new class of engineering materials.
1.2 Material constituents of C/C
The Carbon-carbon composite consists of carbon matrix and carbon fibres. These carbons have distorted versions of the graphite form, where carbon atoms are joined by strong covalent bonds. Thus, these carbon materials are highly refractory having the melting point above that of most ceramics. The graphite crystals have high thermal conductivity comparable to that of typical metals. This is another advantage of general carbon materials. While the term graphite refers in a strict sense only to carbon arranged
8
in a perfectly hexagonal structure, such perfection is rarely achieved in manufactured graphite. Thus, it has become common to use the word graphite as well for carbon which is approaching this limit. Similarly the term graphitization is used to denote high temperature heat treatment of carbons with the aim to obtain a nearer graphitic structure. In graphite, carbon atoms are arranged in planar basal layers as shown in Fig 1.1. Within each layer the atoms are hexagonally close-packed with an interatomic distance of 0.14 nm and a bonding energy of 522 kJ mol-1. Between, the layers are bonded by van der Waal’s forces with a bonding energy of only 17 kJ mol-1. The layers are separated by a distance of 0.33544 nm; however, because alternate layers are in atomic register, the repeat unit distance is just twice. This structure exhibits a high degree of anisotropy.
Fig. 1.1: Hexagonal crystal structure of graphite
In the basal plane the material is electrically and thermally conducting and strong, having in addition a theoretical Young’s modulus of 1050 GPa. On the other hand, the weak forces between the layers allow slip and lubricating properties with a theoretical Young’s modulus of 35 GPa and electrical and thermal conductivity 2 orders of magnitude lower than in the basal plane. Manufactured carbon contains a substantial amount of crystal imperfections and voids so that the theoretical values cannot be achieved. A typical carbon structure consists of discrete graphite crystallite zones oriented randomly to each other and intermingled with a continuum of disordered, porous material . Carbon fibres on the other hand reveal a high degree of perfection with the Young’s modulus and tensile strength reaching up to 850 GPa and 6 GPa
Basal Plane
Interlayer Spacing
respectively, when formed from liquid crystalline pitch. Fig. 1.2 shows the Young’s modulus of carbon fibres in comparison to a wide variety of other materials. In this figure the carbon fibres’ Young’s modulus even reaches twice the value of its nearest competitors, the SIC, shown as second on the right.
Fig. 1.2: Young’s modulus of various materials with that of carbon fibers shown on the right.
1.3 Chemical structure and production route of the carbon fibres
While the theoretical strength of ideal graphite cannot be achieved in manufactured carbon, the high strength of graphite in the basal plane was exploited to produce high strength carbon fibres.
There exist at present three precursor materials to produce carbon fibres, e.g. rayon, polyacrylonitrile (PAN), and pitch. Carbon fibres of considerable strength were at first produced by the Union Carbide Corporation (UCC) at the middle of the 1960s using rayon as precursor material. The UCC showed that isotropic carbon fibres could be transformed into a high modulus product by stretching during high temperature heat treatment. Later, PAN fibres were found to be used instead of rayon fibres as precursor
10
material which proved to be more economical due to the lower cost of the PAN fibres. Both, carbon fibres with rayon and PAN as precursor material were non-graphitizing and the research continued to develop a truly graphitic fibre. It was then realised that liquid crystal pitch materials could develop a true graphite structure which led Otani in 1965 to begin investigating pitch as a precursor material for carbon fibres. Since then research on forming the pitch precursor and transforming the precursor into carbon fibres has continued leading to a commercial carbon fibre formed from liquid crystalline pitch with an ultra high modulus of 850 GPa . Carbon fibres are sold in discontinuous, e.g. “chopped”, continuous, and woven form.
1.4 Applications of chopped, continuous and woven fibres
While carbon composites with chopped fibres, Fig 1.3, are mainly used in disk brakes, continuous Fig 1.4 and woven fibres Fig 1.5 are used in load bearing applications.
Fig. 1.3: Brake disk made of chopped fiber C/C composite (picture from the homepage of SGL carbon)
Fig. 1.4: Continuous carbon fibers (picture from Wikipedia)
Fig. 1.5: Weaved carbon fiber mat (picture from Wikipedia)
Woven fibres are usually preferred in composite materials because of reduced manufacturing costs and improved damage resistance. However, they are weaker than unidirectional reinforced fibre composites. This is due to curvature of the fibres as a result of the weaving known as crimp acting as stress concentration sources. Unidirectional fibre composites usually have negligible strength in the direction normal to the fibres. This can be overcome by stacking uni-directionally reinforced lamina in orthogonal direction though resulting in an increasing amount of lay-ups which drives up the manufacturing cost. Nevertheless, having the well balanced highest tensile strength they are usually preferred in aerospace applications . Typical fibre lay-ups of two-dimensionally reinforced composite are shown in Fig 1.6. If a load is only applied in one direction, the sheets, or laminae, are laid up with all fibres in one direction, as shown in Fig 1.6 on the left. However, in case of different directions of the applied load, the fibre direction usually alternates. In 2-directional loading, a cross-ply reinforcement (0/90)n is usually applied whereas in more complex loading cases quasi-isotropic fibre orientations, for example the (0/+45/-45/90)n case as depicted in Fig 1.6 on the right, are used. To predict the material properties of a laminated composite from the material properties of single laminae, a special technique, e.g. the lamination theory , is applied.
12
Fig. 1.6: Composites with a) UD0, b) cross-ply (CP) 0/90 and c) a typical quasi-isotropic (QI) stacking sequence.
1.5 Production routes for C/C composites
Carbon and its thermodynamic equilibrium phase graphite melt only under high pressure and temperature in the order of 100 bars and 4000 K. This makes chemical routes to produce carbon-carbon composites as melting or sintering virtually impossible. Thus, only the preparation of elemental carbon by thermal decomposition of carbonaceous compounds is suitable for the preparation of solid structural carbon materials. Hydrocarbons are the basic carbonizable compounds. They might either be used in pure form or may contain additional ligands such as oxygen, sulphur, nitrogen, and halogens. Examples of the most suitable precursors are
1. Pure hydrocarbons: gaseous low molecular weight compounds or molten pitches. 2. Oxygen-containing hydrocarbons: non-melting polymers such as phenolics and
furans, and oxidised pitches and thermoplastics.
3. Nitrogen-containing hydrocarbons: polyacrylonitrile, polyimide, etc. 4. Sulfur- and halogen- containing compounds: modified pitches.
90° 0°
0°
0°90
° 0°
90°
0°+45
° -45°
90°
a) UD 0 b) CP 0/90 0 c) QI
The main methods of placing the carbon matrix in the carbon perform are shown in Fig. 1.7. The first approach is to infiltrate a hydrocarbon gas into the preform under conditions where pyrolysis of the gas occurs directly on the fibre surfaces, gradually building up a layer of matrix. Since the surface layers are preferentially densified in this method, a good filling of the inner layers have to be confirmed. The second involves the impregnation of carbon fibre preform with a liquid carbon precursor, such as resin or pitch, and then pyrolysing the precursor to form the carbon matrix. While in the gaseous process the pyrolysis is not complete, so that a part of ligands remains after the process. Hence, an additional heat treatment is usually required. This causes substantial volumetric shrinkage. Thus, pores and shrinkage cracks are common in the matrix. These defects are filled by subsequent re-infiltration and pyrolysis/heat-treatment operations to densify the composite . To overcome the time consuming cycles of repeated impregnation and carbonisation, the so-called preformed yearn (PY) method, shown in Fig. 1.8, was introduced. In this method, bundles of carbon fibres are filled with precursor particles of carbon matrix and sheathed with polypropylene films. The resulting material is yearn-like having a diameter of 1 to 2 mm and a length of 200 to 1000 m. The preformed yearns are then woven or uni-directionally arranged in sheets,
14
and the C/C is produced by a single hot press process of the laminated sheets followed by heat-treatment without further densification treatment .
Fig. 1.8: The preformed yearn (PY) method.
1.6 Specific advantages and resulting applications of C/C composites
The appreciated properties of the C/C composites lie in its
high (specific) strength and high wear resistance at elevated temperatures,
high thermal shock resistance
low coefficient of friction at elevated temperatures
high thermal conductivity, and
high biocompatibility,
leading to applications as outlined in the following.
The most intensive use of carbon-carbon composites is in brakes of aeroplanes and race cars. The rapid deceleration occurring in brakes generates a substantial amount of frictional heat. Carbon-carbon composites have a high wear resistance and retain strength at high temperatures. In addition, they maintain a more consistent performance over the life of the part, and they are much lighter than their steel counterparts saving,
for example, up to 800 kg on a Boeing 747. Well-known applications of C/Cs are rocket nozzles where the C/C’s high temperature erosion and abrasion resistance is appreciated. Similar to the rocket, C/Cs are used for the nose cone and leading edges of the space shuttle wings and the heat shields of ballistic missiles because of their high temperature resistance. C/Cs are also used in the glass bottle industry as transfer pads in contact with the molten glass. Emerging applications are in fusion reactors because of the C/C’s high temperature strength and thermal shock resistance and bone transplants because of its extremely good bio-compatibility .
1.7 Specific drawbacks of C/C composites
Despite its superior high temperature behaviour, the C/C composite has some important drawbacks which are their
high cost,
susceptibility to oxidation at elevated temperatures, and
not fully clarified fracture behaviour which presently permits only applications in secondary structures.
It goes without saying that the fracture behaviour of carbon-carbon composites must be fully understood in order to make full use of its high strength and to broaden the field of applications substantially. Thus, while the developments of more cost-effective production routes and of oxidation inhibitors are large research fields themselves, this work will concentrate on the fracture behaviour of C/C composites.
1.8 Route of discussion
The route of discussion will be as follows: At first, the shear band effect we will introduce the shear band model in Ch. 2, which, according to their inventors explains the high toughness of C/C composites. In addition, some basic facts about the C/C composite will be introduced in this chapter. In the following Ch. 3, actual shear band observation will be carried out. Since shear fracture is essential for shear band formation, this topic will be examined in Ch.4. As we will find out, shear damage has a substantial effect on the strength of C/C composites so that we will discuss this issue more in detail in Ch. 5. In the following Ch. 6, a basic strength enhancing model will be established. In Chapter 7, the effect of shear damage at stress concentration sources will be examined by use of a multi-holed geometry. Finally, in chapter 8, all results will be gathered to establish a basic model explaining the high toughness of C/C composites.
16 Fig. 1.9: Route of discussion.
Fitzer E, Heym M. High temperature mechanical properties of carbon and graphite (a review). High Temp-High Pressures 1978; 10: 29-66
Fitzer E, Gkogkidis A, Heine M. Carbon fibres and their composites (a review). High Temp-High Pressures 1984; 16: 363-392
J.H. Brahney, Aeros. Eng., 7(6), pp. 15 (1987)
E. Fitzer, L. M. Manocha, Carbon reinforcements and carbon/carbon composites, Springer-Verlag (1998)
R. M. Gill, Carbon fibers in composite materials, ILIFFE books (1972) J. D. Buckley, Ceramic Bulletin, 67(2), pp. 364 (1988)
G. Lubin, Handbook of composite materials, Reinhold Pub (1974) J. D. Buckley, Ceramic Bulletin, 67(2), pp. 364 (1988)
C. R. Collins, in: C. R. Collins (eds) Essentials of carbon-carbon composites, The Royal Society of Chemistry (1993)
S. Otani, Carbon, 3, pp. 31 (1965)
E. Fitzer, L. M. Manocha, Carbon reinforcements and carbon/carbon composites, Springer-Verlag (1998)
G. Savage, Carbon-carbon composites, Chapman & Hall (1993)
D. Hull, An introduction to composite materials, Cambridge University Press (1981)
R. M. Jones, Mechanics of composite materials, McGraw-Hill, (1975)
E. Fitzer, L. M. Manocha, Carbon reinforcements and carbon/carbon composites, Springer-Verlag (1998)
B. Rand, in: C. R. Collins (eds) Essentials of carbon-carbon composites, The Royal Society of Chemistry (1993)
H. Nagao, T. Nakagawa, H. Hirai, Manufacture of unidirectional carbon fiber reinforced carbon composites by preformed-yearn method, Tanso, 186, pp. 7 (1999)
G. Savage, Carbon-carbon composites, Chapman & Hall (1993)
2. State of research on the fracture of C/C
2.1 Fracture
Fracture describes an event, in which a structure is separated into two or more pieces due to overloading, and, of the various structure failure modes (buckling, fracture, excessive plastic deformation), fracture is one of them. In most cases fracture does not occur due to an unforeseen overload but due to crack extension under “normal” service loads. Fracture might occur in very different ways depending on the material types. For example, glasses behave at first perfectly elastic to fail then suddenly due to their tensile load. In contrast, many metallic solids deform extensively by plastic flow prior to rupture under shear. The process of fracture can be differentiated into crack initiation and ultimate fracture. While the process of crack initiation is very difficult to treat, several concepts exist to predict fracture once a crack of finite length has evolved. Producing a “natural” crack of finite length is very difficult in case of CCs. The problem is generally solved by cutting, for example with a diamond cutting blade, a narrow notch into the test specimen. It is then assumed that once a small crack has evolved from the notch tip the same conditions apply as for a naturally grown crack.
Fig. 2.1: Modes of loading
Since a specimen can be loaded under shear or tension it is necessary to differentiate the basic modes of loading under which fracture can occur. There exist 3 basic modes of loading as shown in Fig. 2.1 and all other loading conditions are simply a combination of the three. In Fig. 2.1, mode I refers to cleavage (opening) mode I,
Mode I (Opening Mode)
Mode II (Sliding Mode)
Mode III (Tearing Mode)
20
while the other two are in-plane shear (sliding) mode II, and out-of-plane shear (tearing) mode III.
2.2 The shear band effect
In actual load bearing applications, C/C composites are most likely to be used under tension, and thus, by far the most research has been concentrated on mode I fracture. It was then found that the fracture phenomenon largely changes with the fibre orientation as shown in Fig. 2.2 for double-edge notched (DEN) specimens. In the cases of fibre orientation normal to the loading UD90, quasi-isotropic, or cross-ply (CP) (0/90)n fibre orientation, fracture occurs normal to the loading direction between the notches. On the other hand, in case of uni-directionally reinforced C/C with fibres parallel to the loading direction UD0, splitting crack formation parallel to the loading direction occurs first. Finally, ultimate fracture occurs in the net section between the parallel cracks in a random fashion.
Fig. 2.2: Fracture pattern of C/C composites
In the past, in particular the UD0 with fibres only in loading direction and the cross-ply (0/90)n cases have been studied. The UD90 case having only fibres normal to the loading direction is due to its low tensile strength of no practical interest. The quasi-isotropic case reveals a much higher shear strength than the UD0 and the CP 0/90
UD 90 stacking QI stacking CP (0/90)
stacking
Fracture perpendicular to the loading direction
1 2
UD 0 stacking
1 Fracture parallel to the loading direction
2 Then fracture in the net section
cases. However, its tensile strength is lower which may be the reason why this configuration has drawn less attention in the past than the first two.
According to findings by Evans et al. a major stress relaxation mechanism exists in form of a so-called “shear bands”. This result is primarily based on experiments with cross-ply laminated C/C composites. The shear bands can be imagined as follows: Tensile stress concentrations at cracks, (notch) tips, or holes inevitably cause shear stresses as shown in Fig. 2.3 (a). These shear stresses can lead to shear damage propagating parallel to the loading direction in form of a band if the shear stress exceeds the shear strength of the material. Since the occurring shear stresses at holes or notch tips are usually substantially smaller than the tensile component, shear band formation can only occur if the material’s tensile strength is much higher than its shear strength. Otherwise, the specimen fails under mode I without prior shear damage. A typical shear band formation is shown in Fig. 2.3 (b).
Fig. 2.3: Stress state at cracks and shear band formation
The original shear band concept is based on an analytical model developed by F
F
Shear Band
Tensile stress (mode I)
Shear stress (mode II)
Crack
a) Stress state at crack b) Shear band formation
22
Fleck . Fleck pointed out that brittle materials, as for example C/C composites, can have strong non-linear shear stress-strain behaviour due to tensile micro-cracking caused by remote shear loading. In such cases shear failure occurs due to the nucleation, growth and coalescence of voids or cracks under a localised concentrated stress, with the material outside the damage zone behaving rigidly. This failure process of shear localisation is in qualitative terms similar to the shear localisation phenomenon previously reported in metals.
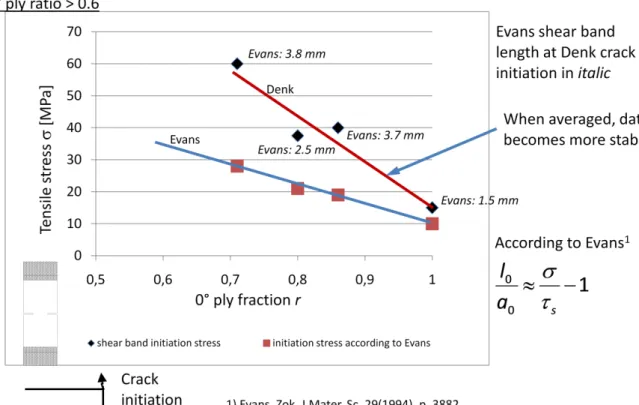
Chan et al. examined analytically the shear band in a centre-cracked infinite plate under remote tensile loading. Assuming a constant yield shear stress, they calculated the shear band extension length as a function of the applied load. Chan et al. found that the tensile stress concentration at the crack tip diminishes when the shear band extents. Evans pointed out that a shear band length over three times longer than that of the pre-crack (notch) length makes the specimen essentially notch insensitive. Recently, Turner and Brønstedt categorised brittle matrix composite (CMC) materials into 3 groups, shown in Fig. 2.4, by comparing the material’s shear modulus G12 and the fibres ultimate tensile strength S. They arranged the 3 categories in a mechanism map as shown in Fig. 2.5 and concluded that materials with G12 / S 80 exhibit tensile stress redistribution due to shear band formation and defined them as class III materials. From their experimental results they concluded that C/C composite falls into the group of class III materials.
Fig. 2.4: Three classes of toughening mechanism of brittle matrix composites (CMC) by Evans et. al.
Fig. 2.5: Proposed mechanism map by Evans et al.
Inserting the examined C/C’s data into the required equation, we must locate our C/C material at a different location on the mechanism map, nevertheless it would still fall into class III so that shear band formation should be the prevailing mechanism.
Kogo et al. examined the fracture toughness of C/C composites by use of a double-edge notched (DEN) geometry. They pointed out that shear band formation could not be observed, although their C/C material would have clearly been categorised as a class III member. In their experiments with cross-ply 0/90 laminated C/C composites, the C/C showed a high degree of toughness. The net fracture stress was found to be slightly lower that that of un-notched specimen. However, if the net sectional width was small, higher net fracture stresses that those of their un-notched counterparts could be observed, as shown in Fig. 2.6. Consequently, the damage occurring around notches has a positive effect on the materials strength. However, this mechanism cannot be explained by a stress relaxation mechanism as shear band formation. Fig. 2.7 shows experimental results of the strength and fracture pattern of their UD 0 counterparts. In this case, shear band formation in form of a shear crack
24
Fig. 2.6: Fracture pattern and strength of cross-ply 0/90 C/C composites.
propagating parallel to the loading direction can be observed. In addition, the net fracture stress of the notched C/C and the tensile strength of the un-notched specimens were the same. Thus, the notched C/C reveals complete notch insensitivity in the UD 0 case. We can summarize, that the C/C reveals different fracture patterns and different
Fig. 2.7: Fracture pattern and strength of UD 0 C/C composites.
degrees of fracture toughness depending on the fibre orientation although its position on the Evans’ mechanism map would not change. This casts doubt on the universal applicability of this model.
2.3 Tensile fracture criteria to predict failure of C/C
While the effect of shear band formation is still in the discussion, there exists less tendency towards one particular fracture criterion , , , , , , , , . Instead, several fracture criteria have been shown to predict the fracture of C/Cs successfully. The most common ones are examined in the following.
2.3.1 Fracture toughness criterion
It has been mentioned above that fracture can occur in very different fashions ranging from perfectly brittle to plastic yielding. Figure 2.8 shows the typical tensile stress-strain behaviour of carbon-carbon composites. In this figure, the stress-strain behaviour in tension is linear almost up to ultimate fracture which implies that plastic deformation prior to tensile failure is small. In such cases fracture can be analysed on the basis of elastic concepts. For such occasions, the most prominent is the Linear Elastic Fracture Mechanics (LEFM) , in which the stress field at the crack tip is evaluated. We will introduce here only the mode I case, the other two cases can be readily obtained from the literature .
Fig. 2.8: Typical tensile stress-strain curve of 0/90 cross-ply laminated C/C
Stress [MPa]
Strain [%] 0
50 100 150 200 250
0 0.05 0.1 0.15 0.2 0.25
26
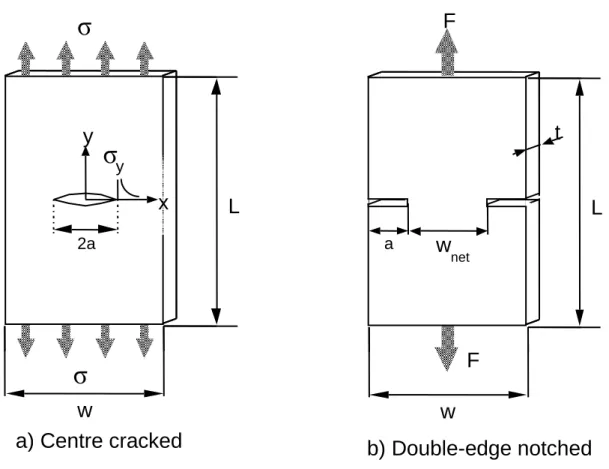
Fig. 2.9: Dimensions of centre-cracked and double-edge notched specimen.
Let us consider a elastic centre cracked body as depicted in Fig. 2.9(a) loaded under mode I by a remote stress
t w
F
(2.1),
where load is denoted by F, the specimen width by w, and the specimen thickness by t. When the material is isotropic and its response is linear-elastic, the stress field just ahead of the crack tip can be determined , and x and y are given by
x KI
x
2 , and (2.2)
x KI
y
2 . (2.3)
Thus, x and y depend only on the distance from the crack tip x and a constant parameter KI, the so-called stress intensity factor under mode I . KI itself is defined as
w F a a
KI , (2.4)
with a and denoting the crack length and the remote loading stress, respectively, and
σ
L
y
2a
w
σ
σ
yx L
w
a
w
net
F
F
t
a) Centre cracked b) Double-edge notched
w
F a being a geometry factor which accounts for the finite width of the specimen. Evaluating Eq. (2.2) and (2.3) we find that the stresses x and y at the crack tip, as x0, are proportional to the stress intensity factor KI. Assuming that fracture occurs once the stress field at the crack tip becomes too high for the specimen to bear we might as well say that fracture occurs once the actual stress field exceeds a critical K-value, KIC, the so-called (fracture) toughness of the material,
KI KIC . (2.5)
Thus, the fracture toughness of a material can be interpreted as the highest stress intensity K that can be supported by a cracked component. This is the core concept of the fracture toughness criterion.
Fig. 2.10: Net fracture stress of double-edge notched (DEN) C/C composite specimen [Hatta et al.].
The fracture toughness criterion has been successfully applied for example by Evans and Hatta as shown in Fig. 2.10 using cross-ply laminated C/Cs. In this figure experimental results of DEN specimens with constant ratio of a over w are arranged in terms of the net fracture stress n,f
t w
F
net f
n
max
, (2.6)
as a function of the notch length a. In equ. (2.6), Fmax, t, and wnet denote the load at
Tensile strength smooth specimen
Notch length a [mm] 0
40 80 120 160 200 240
0 2 4 6 8 10
n,f [MPa]
(K=7.5MPa m-1/2 ) Fracture toughness criterion
DEN(a/W= 0.5) /90° 0°
σ σ
28
fracture, the thickness, and the net sectional width, as depicted in Fig. 2.9 (b). Two aspects are worth noting in this figure: All specimen fail roughly at the same critical stress intensity Kc. Thus, K can be used to determine the fracture of cracked specimen. In addition, at small notch lengths, net fracture stresses higher than that of smooth specimens, shown in Fig. 2.10 as a vertical shaded band, are measured. This indicates that the stress concentration at the notches can, in some cases positively affect the strength of the material.
One of the criterion’s disadvantages is that, from a strict perspective, it is only valid for cracked specimens and thus not for cases with mild stress concentrations like holes. However, Kostopolous and Pappas showed that the fracture toughness criterion can be applied by substituting holes with notches of the same length as the hole’s diameter. This can reasonably be justified if one assumes that cracks emerge from the hole resulting in a similar stress field at the crack tip as a “perfect” crack.
2.3.2 Point stress criterion
The point stress criterion is based on a linear-elastic concept, which was originally used to predict the ultimate fracture in polymer matrix composites with stress concentration sources. In the point stress criterion , a presumed material constant, the characteristic distance d0, is introduced, as shown in Fig. 2.11. Fracture is assumed to occur once the stress y reaches at the characteristic distance d0 from the notch tip the material’s ultimate tensile strength (UTS) max. Though the physical meaning of the characteristic distance d0 is not fully understood, it is considered that d0 is related to a damaged area in which stress relaxation due to sub-critical local fracture occurs.
The applicability of the point stress criterion was examined by Hatta et al. using cross-ply (0/90) and quasi-isotropic stacking sequences. It was shown that the point stress criterion can be applied and that it gives practically the same results as the fracture toughness criterion. The major advantage of the point stress criterion is that it is not restricted to cracked specimens. It can be used as long as the material’s fracture is brittle. However, Kogo et al. later found different characteristic distances for notched and holed specimen which limits the universal usage of this criterion.
Fig. 2.11: Point-stress criterion (PS)
2.3.3 Net stress criterion
If substantial plastic yielding occurs, the stress concentration at the notch or crack tip might almost disappear. Such an idealistic structure with uniform stress field is said to be “notch insensitive”. Failure is in this case suspected to occur when the uniform stress n,f of Eq. (2.6) reaches the material’s ultimate tensile strength max,
n,f = max. (2.7)
Although somehow contradicting to the aforementioned brittle nature of the C/C composite, it was shown by Kiuchi et al. that in some occasions, this criterion can be used to predict failure of the C/C composite.
2.4 Summary
In this chapter, the shear band formation model and the most common fracture criteria relevant to carbon-carbon composites were summarized. We found that the examined C/C can be categorised as so-called class III material in the Evans et al. terminology for which shear band formation is the prevailing mechanism. Observation of the fracture pattern in the CP 0/90 and UD 0 cases reveal that these to configurations reveal different fracture pattern and degrees of toughness. In special cases of the CP 0/90 configuration even higher strength than that of un-notched specimens was observed. All this is hard to fit into the shear band approach. In particular, higher
x
σ
yσ
maxd
0Notched specimen
30
strength than that of smooth (un-notched) specimens cannot be explained by a concept which is based on stress relaxation.
The fracture toughness criterion and the point stress criterion showed roughly the same performance to predict the fracture of notched and holed C/C composites with cross-ply (0/90) fibre orientation. Since fracture toughness data can be obtained in a straight-forward manner, this criterion is preferable. In addition to the two criteria, it was found that the net stress criterion can also be partly applied. However; this is in strong contrast to the above two criteria. While the fracture toughness and the point stress criteria assume negligible plastic deformation around the crack tip the net stress criterion implies that the damage around the notch tip is so large that the stress concentration disappears.
A. G. Evans, F. W. Zok, Review, The physics and mechanics of fibre-reinforced brittle matrix composites, J. Mater. Sci., 29, pp. 3857 (1994)
N. A. Fleck, Brittle fracture due to an array of microcracks, Proc. R. Soc. Lond., A 432, pp.55 (1993)
K. S. Chan, M.Y. He, J. W. Hutchinson, Cracking and stress redistribution in ceramic layered composites, Mater. Sci. Eng., A 167(1-2), pp. 57 (1993)
A. G. Evans, F. W. Zok, Review, The physics and mechanics of fibre-reinforced brittle matrix composites, J. Mater. Sci., 29, pp. 3857 (1994)
K. R. Turner, J. S. Speck, A. G. Evans, Mechanisms of deformation and failure in carbon-matrix composites subject to tensile and shear loading, J. Am. Ceram. Soc., 78(7), pp. 1841 (1995)
P. Bronstedt, F.E. Heredia, A. G. Evans, In-plane shear properties of 2-D ceramic matrix composites, J. Am. Ceram. Soc., 77(10), pp. 2569 (1994)
Y. Kogo, H. Hatta, H. Kawada, et al., Effect of stress concentration on tensile fracture behaviour of carbon-carbon composites, J. Comp. Mater., 32(13), pp. 1273 (1998)
G. E, Griesheimer, P. B. Pollock, S. C. Yen, Notch strength and fracture behaviour of 2-D carbon-carbon composites, J. Am. Ceram. Soc., 76(4), pp. 944 (1993); CT
A. G. Evans, F. W. Zok, Review, The physics and mechanics of fibre-reinforced brittle matrix composites, J. Mater. Sci., 29, pp. 3857 (1994)
F. E. Heredia, M. Spearing, T. J. Mackin, et al., Notch effects in carbon matrix composites, J. Am. Ceram. Soc., 77(11), pp. 2817 (1994); DEN, CN, CH
T. J. Mackin, T.E. Purcell, M. Y. He, et al., Notch sensitivity and stress redistribution in three ceramic-matrix composites, J. Am. Ceram. Soc., 78(7), pp. 1719 (1995); DEN
K. R. Turner, J. S. Speck, A. G. Evans, Mechanisms of deformation and failure in carbon-matrix composites subject to tensile and shear loading, J. Am. Ceram. Soc., 78(7), pp. 1841 (1995); DEN, CN, CH
M. Hojo, S. Ochiai, N. Joyama, et al., Fracture mechanism of cross-ply carbon/carbon composites, ACM, 5(1), (1995); CT, 3-PSEB
Y. Kogo, H. Hatta, H. Kawada, et al., Effect of stress concentration on tensile fracture behaviour of carbon-carbon composites, J. Comp. Mater., 32(13), pp. 1273 (1998); DEN, CH
V. Kostopolous, Y. Z. Pappas, Notched strength prediction of centre-hole carbon/carbon composites, Mater. Sci. Eng., A250, pp.320 (1998); CH
H. Hatta, Y. Kogo, H. Asano, et al, Applicability of fracture toughness concept to fracture
behaviour of carbon/carbon composites, JSME International Journal, A42(2), pp. 265 (1999); DEN, CT, 4PSEB
D. Broek, The practical use of fracture mechanics, Kluwer Academic Publishers (1988) B. Lawn, Fracture of brittle solids – second edition, Cambridge University Press (1993) H. Tada, P. C. Paris, G. R. Irwin, The stress analysis of cracks handbook, Del Research Corporation (1973)
cf. D. Broek, Elementary engineering fracture mechanics, 4th Edition (1985)
M. F. Kanninen, C. H. Poppelar, Advanced fracture mechanics, Oxford University Press (1985) J. F. Knott, Fundamentals of fracture mechanics, Butterworths (1973)
D. Broek, The practical use of fracture mechanics, Kluwer Academic Publishers (1988) A. G. Evans, F. W. Zok, Review, The physics and mechanics of fibre-reinforced brittle matrix composites, J. Mater. Sci., 29, pp. 3857 (1994)
H. Hatta, Y. Kogo, H. Asano, et al, Applicability of fracture toughness concept to fracture behaviour of carbon/carbon composites, JSME International Journal, A42(2), pp. 265 (1999)
V. Kostopolous, Y. Z. Pappas, Notched strength prediction of centre-hole carbon/carbon composites, Mater. Sci. Eng., A250, pp.320 (1998)
J. M. Whitney, R. J. Nuismer, Stress fracture criteria for laminate composites containing stress concentrations, J. Comp. Mater., 8(7), pp. 253 (1974)
H. Hatta, Y. Kogo, H. Asano, et al, Applicability of fracture toughness concept to fracture behaviour of carbon/carbon composites, JSME International Journal, A42(2), pp. 265 (1999)
Y. Kogo, H. Hatta, H. Kawada, et al., Effect of stress concentration on tensile fracture behaviour of carbon-carbon Composites, J. Comp. Mater., 32(13), pp. 1273 (1998)
A. Kiuchi, I. Iwata, N. Nakano, Proc. 4th Symp. High Performance Mater. for Severe Environments, pp. 37-45, (1993) Tokyo
3. Observation of crack extension
3.1 Introduction
As discussed in the introduction several different attempts have been made to explain the notch insensitive behaviour of C/C composites. These will be examined in the following section more in detail. One major concept leading to notch insensitive behaviour is the formation of “shear bands” as proposed by Evans et al. . However, let us recall that there exist with mode I and mode II two types of fracture occurring in notched C/Cs depending on the fibre orientation.
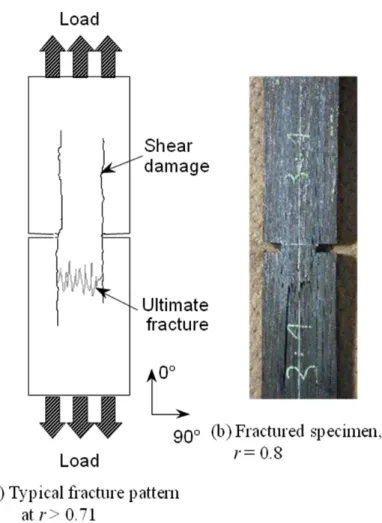
Fig. 3.1: Typical shear and ultimate tensile fracture patterns appeared in the DEN specimens when 0° ply fraction r is higher than 0.71 (a) and a fractured specimen at = 0,8 (b).
34
When sharp notches are introduced into uni-directionally reinforced C/Cs in direction normal to the fibre orientation, shear damage like that shown in Fig. 3.1 occurs. The shear damage easily extends from the notch tips in direction parallel to the fibres due to the extremely low shear strength. However, when sharp notches are introduced parallel to the fibre axis, cleavage type fracture without shear-damage is observed as for example shown in Fig. 2.2 on the left.
Thus, if various intermediate cases between the above two extremes are examined, the shear damage can be precisely observed and the effect of the shear damage on notch sensitivity can be clearly evaluated.
The procedure in this chapter was as follows: First, the basic tensile properties of C/C were examined. Then, based on the above concept, notched specimens with various 0° and 90°-layer ratios were fractured, and the shear damages in these specimens were observed. Thereafter, the relation between the shear damage obtained in this study and the “shear band” found in previous reports was compared. Finally, based on these results, the controlling mechanisms for the notch insensitivity of C/C composites are discussed.
3.2 Experimental procedure
3.2.1 Material
The carbon-carbon composite (C/C) used in the present and all following chapters was of a cross-ply laminate type, made by means of the preformed yarn process , and supplied by Across Co. Ltd. A primary feature of the preformed yarn process is the use of preformed yarns, PYs, as a source material of C/C. The PY consists of matrix source particles (coke and bulk mesophase powders) dispersed within the carbon fibre bundle and sheathed with a thin nylon sheet. In the C/C forming process, preformed sheets, in which the PYs had been uni-directionally aligned and tied by thin polymer threads, were stacked in a predetermined lamination pattern, set in a die, hot-pressed at 827 K for carbonization, and finally heat-treated at 2273 K for graphitization in an inert atmosphere. The C/C material was reinforced with high modulus carbon fibres, Torayca M-40, and the fibre volume fraction of the C/C material was always 50%. The C/Cs were composed of systematically changed ratios of 0° and 90° layers, as shown in Table 3.1. In the following, the specimens will be identified by the ratio of the 0° and 90° layers, as shown in the column of Table 3.1, where 0° was set to the loading direction in the fracture tests.
Table 3.1: Examined stacking sequences.
3.2.2 Experiments
All mechanical tests were performed using a screw driven mechanical testing machine Autograph AG-5000A of Shimadzu Co. Japan under a crosshead speed of 0,1 mm/min unless noted otherwise.
3.2.2.1 Tensile properties
Owing to the importance of tensile strength, the influence of the specimen’s geometry on the tensile fracture stress was first studied. Tensile tests were carried out using coupon and dog bone shaped specimens as shown in Fig 3.2. In order to determine the optimum geometry, the gage length was varied from 20 mm to 150 mm in the coupon (smooth) specimens, and the shoulder radius was changed in the “dog bone“ specimens up to 100 mm. Strain gages were attached to both surfaces of the specimen parallel and normal to the loading direction in order to calculate the Young’s modulus and the Poisson’s ration. A screw driven testing machine, AG-5000 made by Shimadzu Seisakusho, Japan, was used for tensile loading of the C/C specimens. In order to investigate the effect of interfacial debonding stress d on the ultimate tensile fracture strain u fibre bundle push-out tests were carried out. In these tests several
stacking sequence
number of plies 0°plies 90°plies total
0 ply ratio r °
1:4 1:3 1:2 1:1 1:1 2:1 3:1 4:1 UD 90
UD 0
14 15 14 15 15 14 15 14 14
14 2
3 4 7 8 10 12 12 0
14
12 12 10 8 7 4 3 2 14
0
0.14 0.20 0.29 0.47 0.53 0.71 0.80 0.86 0
1
36
different bulk densities were examined. The tests were carried out by use of a fibre bundle push-out test machine as described by Hatta et al.
Fig. 3.2: Specimens for tensile test
3.2.2.2 DEN test
Notch sensitivity of the C/C composite was evaluated based on the test results of double-edge notched (DEN) specimens. The geometry of the DEN specimens is shown in Fig. 3.3. The two notches in the DEN specimens were introduced by a diamond wheel with a 0.2 mm tip radius. In previous studies, the DEN specimens of the present material revealed insensitivity to the notch tip radius when the radius was less than 1 mm , , . Thus, the present results can be regarded the same as values of cases with ideal sharp notches. Shear damage (Mode II cracks) and its extension near the notch tips was monitored on the front and back sides using travelling microscopes with a 25x magnification. The net fracture stresses in the minimum cross section f,net and the critical energy release rate under the assumption of ideal sharp cracks were determined from the fracture load of the DEN tests. The critical energy release rates for mode I (GIc) and mode II (GIIc) crack extensions were calculated in terms of ultimate fracture load for the mode I cracks and the onset loads for mode II cracks with the aid of finite element calculations.
L = 150 mm
10 mm
smooth
3 mm
Shoulder Radius, R = 20-100 mm
dogbone
10 mm 20 mml = 0-150 mm
40 mm
Fig. 3.3: Specimen dimensions of double-edge-notched (DEN) specimens
3.2.2.3 3-point bending tests of pre-loaded DEN tensile test specimens
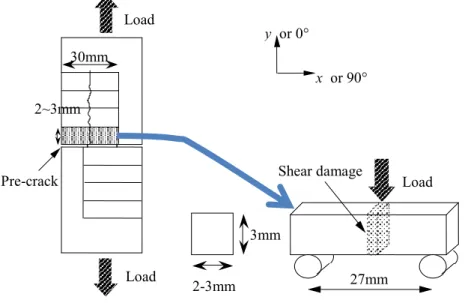
Fig. 3.4: Schematic drawing of 3-point bending tests after crack propagation for the evaluation of fibre fracture in shear-damaged regions.
In order to confirm fibre fracture in the shear-damaged region, special wide DEN
10 mm 5 mm
20 mm
3 mm
150 mm
0° 90°
30mm
2~3mm
Load
Load
3mm
2-3mm 27mm
Shear damage Pre-crack Load
x or 90° y or 0°
38
specimens (width = 40mm, notch length on each side = 15 mm) were prepared for materials with a 0° ply ratio r > 0.7. After the shear cracks propagated, small specimens with a length of 30 mm and a width of 2-3 mm were cut from DEN specimens, as shown in Fig. 3.4 Subsequently, three-point bending tests with a span/depth ratio of about 10 were conducted.
3.2.2.4 Compact Tension (CT) Tests
Compact Tension (CT) tests were carried out to observe clearly the shear crack extension behaviour and to obtain crack-propagation resistance curves (R-curves). The geometry of the CT specimens was based on the ASTM standard and is shown in Fig. 3.5. The pre-crack was first introduced in the CT specimen by a diamond wheel with a thickness of 0,4 mm, and the final notch tip was then completed using a sharp knife edge. The crack extension length was determined using a travelling microscope from each side. For easy observation of the crack tip, the surfaces of the specimens were polished and thinly painted white. The crack opening displacement (COD) at the pre-crack tip was continuously monitored using a clip gage.
Fig. 3.5: Specimen geometry for compact tension (CT) tests
The crack extension resistance, GR, under stable crack growth was determined using equation
da dC B GR p pin
2
2 (3.1)
Clip
Clip gage
60mm
62.5mm
W = 50mm a = 25mm R=13mm AE senser
B = 3mm 0°
90°
where Cpin, P, a, and B are the compliance point, load, crack length, and specimen thickness respectively. Loading and unloading cycles were repeated to determine Cpin as a function of a. The observed crack length, aexp, was found to be different from the calculated one, acalc, which was determined from the compliance-crack length relation obtained by the finite element calculations. Using both, aexp and acalc, GR was determined.
3.2.3 Finite element calculations
Finite element calculations were carried out to determine GIc and GIIcfrom the DEN test results and the crack length in the CT tests using linear orthotropic material constants shown in Table 3.2. A commercial code of ABAQUS®, version 5.7.1, was used in these calculations under the assumption of plane stress fields using 8-node iso-parametric elements. The virtual crack-closure-force method , was used to calculate GIc and GIIc.
Stacking sequence
E1
[GPa]
E2
[GPa]
G12
[GPa] UD90
1:4 1:3 1:2 1:1 3:1 UD0
200 145 141 106 104 38.7 3.65
3.65 30.0 38.7 71.0 80.1 141 200
0.00785 0.00913 0.00976 0.0109 0.0145 0.00976 0.00785
5.4 5.4 5.4 5.4 5.4 5.4 5.4 Table 3.2: Material constants for C/Cs used in FEM calculations
3.3 Results
3.3.1 Basic tensile test results of smooth CP 0/90 specimens
The tensile fracture stress obtained using smooth specimens with a changing gage length, l, and “dog bone” specimens with a changing shoulder Radius, R, are compared in Fig. 3.6 and Fig. 3.7, respectively. It was concluded from these figures that the tensile fracture stresses obtained using the various specimens were almost identical. Thus, the effects of the gripping and of the stress concentration from the curvature of the specimen shoulder are negligibly small. The fracture stress of all specimens ranged between 152 and 206 MPa with an average fracture stress of 186 MPa. In spite of insensitivity to stress concentration sources at the gripping or the shoulder radius, all tensile stress-strain curves were linear up to the ultimate fracture, as shown in Fig. 3.8.
40
This tendency is a well known characteristic of C/C composites , and differs greatly from that of ceramic matrix composites , . The Young’s moduli E in x and y-direction were determined as
Exx = Eyy = 96.5 GPa
and the Poisson ratio was found to be
= 0,026.
Fig. 3.6: Tensile fracture stress of smooth specimens with a changing gage length, l,
Fig. 3.7: Tensile fracture stress of “dog bone” specimens with a changing shoulder Radius, R, 50
100 150 200 250
0 50 100 150
T ens il e fra ct ure s tre ss (M P a)
Gage length (mm)
Fracture stress (MPa)
"Dogbone" shoulder radius R [mm]
0 50 100 150 200 250
0 20 40 60 80 100 120
"smooth"
"dogbone" shape
Fig. 3.8: Nearly linear tensile stress-strain behaviour of C/C composites
Fig. 3.9: Tensile fracture strain, eu, interfacial debonding stress, td, and interfacial sliding stress, ts, of the 2D-C/C composite as a function of bulk density, .
42
Interfacial debonding stresses d and ultimate tensile fracture strains u are shown in Fig 3.9 as a function of the bulk density . In this figure both, the interfacial debonding stress d and the interfacial sliding stress s increase with increasing bulk density . At the same time the tensile fracture strain u decreases with increasing . Thus, we must conclude that high interfacial strength corresponds to low ultimate tensile fracture strains u.
3.3.2 Results of smooth specimens with changing stacking sequence All tensile stress-strain relations of the examined C/Cs remained linear up to ultimate fracture. This is a typical behaviour observed in most C/Cs .As expected, the tensile fracture strength increased linearly with the 0° ply fraction, r, as shown in Fig. 3.10 and the tensile fracture strain did not depend on r. The slightly higher values than expected from the solid line for r =1 might be due to the variations in the volume fraction of the fibre.
Fig. 3.10: Tensile fracture strength obtained using un-notched specimens as a function of the 0°-ply ratio.
3.3.3 Tensile test results of DEN type-specimens
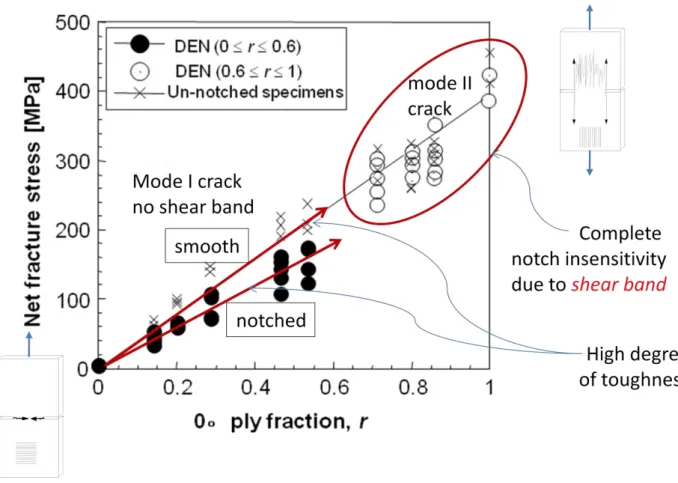
The net fracture stresses of all materials obtained by the DEN tests are shown in Fig. 3.11 as a function of the 0° ply fraction, r. When r 0.71, large scale shear fracture, as typically shown in Fig. 3.1, first appeared. In this case, the ultimate tensile fracture occurred at random in the region between the shear cracks. In contrast, when r 0.53, shear cracks could not be identified before ultimate fracture, and catastrophic tensile fracture occurred between the pre-cracks. Note that the fracture load was proportional to r when r 0.53. Thus, the critical stress intensity factor KIc is also proportional to r. In Fig. 3.11, the tensile strengths obtained from the un-notched specimens, shown by “X” symbols and a solid line coincide with the net fracture stresses of the DEN specimens in the region of r 0.71. These results suggest that once the shear fractures are formed, the effect of the material outside of the shear cracks is negligibly small regarding the stress distribution in the region between the shear cracks. In contrast, the net fracture stresses at r 0.53 were slightly lower than the tensile strength due to the influence of stress concentrations.
Fig. 3.11: Net fracture stresses of DEN and un-notched specimens.