Thermal-Safe Test Access Mechanism and Wrapper Co-optimization for
System-on-Chip
Thomas Edison Yu
†, Tomokazu Yoneda
†, Krishnendu Chakrabarty
‡and Hideo Fujiwara
††
Graduate School of Information Science, Nara Institute of Science and Technology
Kansai Science City, 630–0192, Japan
‡
Electrical and Computer Engineering, Duke University, Box 90291, 130 Hudson Hall, Durham, NC
27708
† E–mail:{tomasu-y, yoneda, fujiwara}@is.naist.jp, Tel.:+81-743-72-5222, Fax:+81-743-72-5229
‡ E–mail:{krish}@ee.duke.edu, Tel:+1 (919) 660-5244, Fax : +1 (919) 660-5293
Abstract
Smaller manufacturing processes have resulted in higher power densities which put greater emphasis on packaging and temperature control during test. For system-on-chips, peak power-based scheduling algorithms are used to optimize tests while satisfying power budgets. However, imposing power constraints does not necessarily mean that overheating is avoided due to the non-uniform power distribution across the chip. This paper presents a TAM/Wrapper co-design methodology for system-on-chips that ensures thermal safety while still optimizing the test schedule. The method combines a simplified thermal-cost model with a traditional bin-packing algorithm to minimize test time while satisfying temperature constraints. Experiments show that even minimal increases in test time can yield considerable decrease in test temperature as well as the possibility of further lowering temperatures beyond those achieved using traditional power-based test scheduling.
Keywords:
SoC test, thermal constraint, wrapper design, TAM design, test scheduling
1 Introduction
As feature sizes and frequencies of newer System-on-Chips scale much faster than operating voltages, not only power densities but also heat densities will experience considerable increase. Furthermore, the problem of overheating becomes much larger during testing when beyond normal switching activities occur due to the need for concurrently testing cores to shorten test time. Overheating can lead to problems such as increased leakage power and even permanent chip damage. For every 15oC rise in temperature, there is approximately a 10-15% delay in timing. These timing uncertainties can result in further yield loss. Traditionally, simply using better packaging and cooling methods would suffice but this has become increasingly difficult and expensive. To reduce packaging cost, packages have increasingly been designed for the worst case typical application [12, 13] and the cost of cooling during test becomes very prohibitive.
For SoCs, test planning usually involves the design of a test data delivery method (TAM: Test Access Mechanism), and the use of wrappers which isolate cores under test. While several
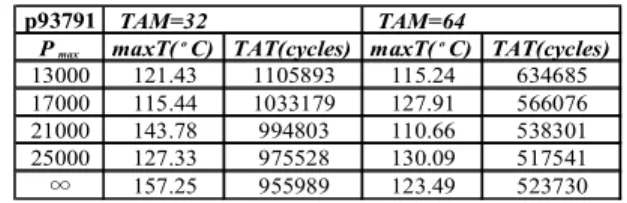
approaches to optimize wrapper designs for single frequency embedded core test [1, 2,] have been proposed, Iyengar et al. [3, 4] integrated the process into one wrapper and TAM co-optimization algorithm. Up to now, limiting power consumption during test has been the main method of temperature control, and test scheduling under power constraints have been considered in [4, 5, 6, 7]. The scheduling problem was reduced to a 2-D bin-packing algorithm in [4, 5] with TAM and test time representing the two axes, while [6] added power as a 3rd dimension. These employ a global peak power model which assumes a static peak power value per test. While this guarantees that the power constraint is not exceeded, it is designed with the worst case in mind and is rather pessimistic [7]. A cycle-accurate power model and test scheduling algorithm was proposed in [7] which considers a varying power value per clock cycle of a test. Because of the non-uniform spatial power distribution across the chip, limiting the maximum chip-level power dissipation is not effective in reducing and avoiding localized heating (called hot spots) which occurs faster than chip-wide heating [9, 12 , 13] as shown in Table 1 where the maximum test temperatures, maxT, do not scale with power Pmax for the SoC p93791 using the method in [4].
In this paper, we propose a design framework which integrates the TAM/wrapper co-optimization process with a thermal-aware test scheduling algorithm. Since thermal simulation is often a time-consuming process, a simplified thermal model is proposed which is used to predict the thermal activity of a core under test while significantly reducing the number of thermal simulations needed. We utilize the HotSpot tool [14] for test schedule validation and instead of a fixed power dissipation value per core, we chose to assign a different power value per wrapper configuration. We also used
Table 1. Max temperatures of p93791 under power constraints
p93791 TAM=32 TAM=64
Pmax maxT(oC) TAT(cycles) maxT(oC) TAT(cycles) 13000 121.43 1105893 115.24 634685 17000 115.44 1033179 127.91 566076 21000 143.78 994803 110.66 538301 25000 127.33 975528 130.09 517541
∞ 157.25 955989 123.49 523730
16th IEEE Asian Test Symposium 16th IEEE Asian Test Symposium 16th IEEE Asian Test Symposium
the cycle-accurate power profiles from [7] to generate thermal profiles. To demonstrate the effectiveness of our approach, experiments were done using several ITC’02 benchmarks [8]. The rest of this paper is organized as follows. A review of related works is given in Section 2. The motivation for this work is discussed in Section 3. Section 4 discusses the proposed TAM/wrapper co-optimization algorithm and the proposed test scheduling algorithm. Section 5 gives the experimental results while Section 6 concludes this paper.
2 Related Works
Rosinger et al. [9] first proposed using a thermal model as a guide to test scheduling instead of a chip-level power constraint. They used the RC-equivalent micro-architecture thermal model from [12, 13] which in turn makes use of the well-known duality between heat transfer and electrical phenomena: heat can be described as a current passing through a thermal resistance and leading to a temperature difference analogous to a voltage [12]. More specifically, [9] only considered the lateral flow of heat away from an active core by reducing a chip into a network of thermal resistances and thermal capacitances as shown in Figure 1. The proposed test scheduling algorithm in [9] uses a test compatibility graph as its basis and cores are grouped into test sessions which are applied sequentially.
In [10], Liu et al. defines a “hot spot” as a core whose temperature is substantially higher than the average temperature over all cores. They proposed two algorithms which try to spread heat more evenly over a chip via layout information and a progressive weighting function, respectively. For this work, we define “hot spot” as any core which exceeds the thermal constraint during test. Thus, a core can be scheduled even if its temperature is much higher than its surrounding cores unlike in [10].
In [11], He et al. proposed using test partitioning and interleaving to allow hot cores to cool off while freeing the test resources to test other cores and avoid overheating.
For all previous methods, only fixed average power values per core and steady state temperatures were considered. Flexible TAM-width and partitioned testing were also outside the scope of [9] and [11]. To the best of our knowledge, this is the first work which attempts to integrate TAM/wrapper co-optimization and test scheduling under a thermal constraint.
3 Motivation
The results in [9] prove that there exists a positive correlation between heat and heat dissipation paths represented by lateral thermal resistances. Thus, we have chosen to use lateral thermal resistance as one of the basis for our model and cost function, with necessary modifications of assumptions from previous works so the model can better approximate heating patterns during testing. First, the assumption that heat transfer between two cores tested concurrently is negligible [9] still holds and thermal resistances between these cores are removed
as shown in Figure 2, where we are left with lateral resistances in parallel for core 1 and core 2.
The assumption made in [9] that inactive cores are thermally grounded and do not heat up is not realistic unless ample time is given for tested cores to cool down before the next test session. Obviously this is not practical because of the required increase in idle time. Furthermore, our experiments show that the temporal dimension, more specifically, the test length as well as the order in which cores are tested can greatly affect the maximum temperature of the next core to be tested as shown in Figure 3 where the peak temperature of core 5 increases by 13oC when core 10 is tested right before it (Fig. 3b) compared to the opposite sequence (Fig. 3a). Thus, when a core is about to be tested, the lateral resistances to cores whose test has just ended are also removed from the total lateral resistance. For example, if core 2 is tested right after core 1 in Figure 1, then R2,1 is removed.
Finally, the choice of using a single fixed power value and assuming steady-state temperatures as upper bounds [9] is not realistic, as shown in Table 2 where the peak temperature of test schedules using static average power Tpavg during thermal simulation are usually less than cycle-accurate values Treal, while maximum temperatures using peak power values Tpeak
are usually much higher and can be considered pessimistic. From our experiments, we found that higher TAM widths
Figure 1. Lateral thermo-resistive model [9]
Figure 2. Thermal resistance network when cores 1 and 2 are tested concurrently
R1,west
R1,North
R1,3
R2,East R2,North
R2,3
R3,1 R3,2
R3,South CORE3
CORE1 CORE2
R1,west R1,2
R1,North
R1,3
R2,1 R2,East
R2,North
R2,3
R3,1 R3,2
R3,South
(therefore, shorter test time) can yield lower maximum temperatures despite having higher peak power values. This can be attributed to the RC characteristic of temperature rise: if a test can finish before the temperature curve reaches steady state, the capacitance can have a “filtering” effect on the maximum temperature values. Thus, test time must also be considered when deriving a thermal model or thermal cost function as discussed in the next section.
4 TAM/Wrapper Co-optimization and Test
Scheduling
In this section, we formally present the TAM/Wrapper co-optimization and test scheduling problem PTWOP.
Problem PTWOP: For an SoC S, given: Wext: TAM width allotted to the SoC NC: number of cores
Tempmax: maximum allowed temperature during test For each core Ci (1≦i≦NC) of SoC S
- Wseti: number of usable wrapper configurations - For each wrapper configuration wij (1≦j≦Wseti)
- TAMij: allotted tam width - Pij: power profile
- TATij: test application time Determine the following output:
For each core Ci (1≦i≦NC) of SoC S
- wfi: assigned final wrapper configuration - TAMfi: final allotted TAM width - tstarti: test start time
- tendi: test end time
And minimize the overall test time of S such that the total number of TAM used at any given time does not exceed Wext
and temperatures do not exceed Tempmax.
Since we cannot ignore per-cycle power values and their effects on temperature, each wrapper configuration is given a different power profile as explained in [7].
4.1 Thermal Cost Function
The proposed scheduling algorithm aims not only to optimize test time and satisfy thermal constraints, but it is also designed to reduce the number of thermal simulations needed to verify the schedule. As discussed in Section 3, we have to consider both the concurrency and precedence of the cores. Furthermore, the time dependence of temperature must also be considered. As a rule, we want to test hot cores (with large power density) as short as possible and minimize its effect on other cores (avoid concurrency and immediate precedence with cores in immediate physical periphery of the hot spot core).
Due to the localized nature of hot spots as well as the effects of layout and varying thermal resistance configurations, the core with the highest thermal cost does not always mean that it is hotter than cores with lower thermal costs. Thus, instead of a global maximum cost, each core Ci is given its own thermal cost that varies with respect to its wrapper configuration wij, test application time TATij, average power pij (computed from power profile Pij) for wrapper wij with respect to time t as shown below:
The lateral resistance RTHi is a function of time because it changes according to when core Ci is scheduled and what cores are tested before as well concurrently with it. In our experiments, the average power dissipation was found to give a closer thermal profile curve to the actual thermal profile derived from cycle-accurate values compared to peak power values. Thus, instead of considering cycle accurate power, we chose to use average power values which vary with respect to
(1) ) )
( ( ) ,
( ij ij THi ij
i w t p R t TAT
Cost = +
Table 2. Max temperatures of p93791 of various schedules
(a) (b)
Figure 3. Effects of test order on peak temperature, (a) core 5 before core 10, (b) core 10 before core 5
d695 TAM=24
Pmax Treal(oC) Tpavg(oC) Tpeak(oC)
1600 99.64 90.14 345.68
1800 103.80 91.15 409.58
2000 106.84 93.52 424.86
2200 111.74 103.75 479.03
2400 104.94 93.60 421.48
wij to greatly simplify cost calculations. The main idea is to pick out hot spot cores, determine an upper limit to their thermal cost, cost_maxi, and gradually decrease this limit until the thermal constraint is satisfied. Furthermore, a thermal cost minimum is computed which represents the worst case configuration of a core to be packed. It inevitably leads to the core being tested alone regardless of time frame, and not preceded by any immediate peripheral cores as given by the equation below:
where Costi(wij,NULL) denotes the cost of unscheduled core Ci
with wrapper configuration wij and no thermal resistance is removed in equation (1), denoted by NULL time.
4.2 Test Scheduling Algorithm
Rectangular 2-D bin packing has been extensively used to solve the test scheduling problem for embedded cores. Each wrapper configuration of a core is represented by a rectangle whose height and width represents test application time and TAM width, respectively. The rectangles are packed into a bin with unbounded height, representing overall test time, and bounded width representing external TAM width. The aim is to find the optimal way of packing the rectangles such that overall test time (e.g. bin height) is minimized. For scheduling under a power constraint, it can be extended into a restricted 3-D bin packing problem where the length, width and height represent pin, peak power and total test time, respectively, for an SoC core. For this paper, previous bin-packing algorithms cannot be directly applied since we cannot simply add the various temperatures of the cores to obtain the overall temperature of the SoC. Furthermore, since it has been shown that the bin packing problem is NP-Hard, this paper proposes a heuristic algorithm to solve the problem. Pseudo-code for our proposed algorithm is shown in Figure 4.
Init: Creating Optimal Wrapper Configuration The initialization steps (lines 1-5 of Figure 4) first makes sure that a configuration for each core can be found which satisfies the thermal constraint Tempmax. Initially, the highest cost cost_max is set to infinity, and the cost_min is computed for each core (line 4). It then uses a selection process introduced in [4] where Pareto-optimal points of the TAM vs. Testing time graph are chosen as optimal wrapper configurations (wiopt) in line 5. When choosing optimal wrapper configurations, the thermal cost must always satisfy both cost constraints.
Priority 1: Packing Rectangles with Optimal Wrapper Configuration
Before packing, the algorithm takes note of the current time in the schedule, denoted by a variable current_t. In line 8, we try to pack as many cores using optimal TAM widths while available_TAM≠0. Each core Ci is examined in order of decreasing thermal cost when using their optimal wrapper configurations, denoted by Costi(wiopt, NULL), since potential
hot spot cores should be scheduled as early and as quickly as possible to minimize their effects on subsequent cores. Here and in all subsequent steps, the thermal costs for all active cores are computed and checked with their upper and lower limits before packing since they change whenever a new core is scheduled. Also, the core list and available TAM is updated accordingly. As the algorithm iterates further, hotspot cores are gradually separated from each other during scheduling due to the imposition of cost limits.
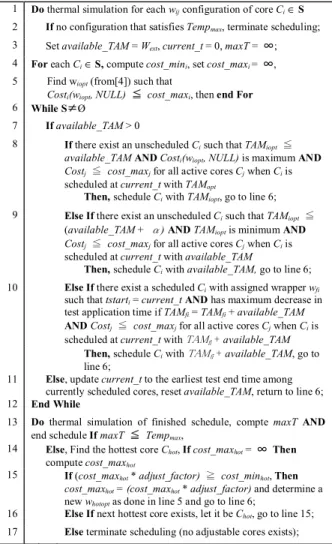
Function Schedule(S, Wext, Tempmax)
1 Do thermal simulation for each wij configuration of core Ci ∈ S 2 If no configuration that satisfies Tempmax, terminate scheduling; 3 Set available_TAM = Wext, current_t = 0, maxT = ∞; 4 For each Ci ∈ S, compute cost_mini, set cost_maxi = ∞, 5 Find wiopt (from[4]) such that
Costi(wiopt, NULL) ≦ cost_maxi, then end For 6 While S≠Ø
7 If available_TAM > 0
8 If there exist an unscheduled Ci such that TAMiopt
available_TAM AND Costi(wiopt, NULL) is maximum AND Costj cost_maxj for all active cores Cj when Ci is scheduled at current_t with TAMopt
Then, schedule Ci with TAMiopt, go to line 6; 9 Else If there exist an unscheduled Ci such that TAMiopt
(available_TAM + α) AND TAMiopt is minimum AND Costj cost_maxj for all active cores Cj when Ci is scheduled at current_t with available_TAM
Then, schedule Ci with available_TAM, go to line 6; 10 Else If there exist a scheduled Ci with assigned wrapper wfi
such that tstarti = current_t AND has maximum decrease in test application time if TAMfi = TAMfi + available_TAM AND Costj cost_maxj for all active cores Cj when Ci is scheduled at current_t with TA Mfi + available_TAM
Then, schedule Ci with TAMfi + available_TAM, go to line 6;
11 Else, update current_t to the earliest test end time among currently scheduled cores, reset available_TAM, return to line 6; 12 End While
13 Do thermal simulation of finished schedule, compte maxT AND end schedule If maxT ≦ Tempmax,
14 Else, Find the hottest core Chot, If cost_maxhot = ∞ Then compute cost_maxhot
15 If (cost_maxhot * adjust_factor) cost_minhot, Then cost_maxhot = (cost_maxhot * adjust_factor) and determine a new whotopt as done in line 5 and go to line 6;
16 Else If next hottest core exists, let it be Chot, go to line 15; 17 Else terminate scheduling (no adjustable cores exists);
Priority 2: Insertion of Rectangles into Idle Space If no rectangle can be packed in their optimal configuration, the algorithm looks for a core Ci whose TAMiopt is less than or equal to available_TAM + αwhere (1≦α≦4) in line 9. Priority 3: Filling Idle Space by Increasing TAM
Figure 4. Proposed scheduling algorithm )
2 ( ))
, ( (
1min Cost w NULL
cost_min i ij
W i j
≤ ext
= ≤
The algorithm checks among the currently scheduled cores whose start times tstart equal current_t and determines which core would have the largest gain in test time if given the unused TAM lines and packs this core in line 10.
Updating and Cost Adjustment
In line 11, current_t is updated when available_TAM becomes zero or when no cores can be scheduled in lines 8-10. When all cores have been scheduled, thermal simulation using HotSpot tool [14] is performed using cycle-accurate power profiles in line 13. The peak chip-wide temperature maxT is then compared to the thermal constraint. If it is satisfied, then the program ends. If not, then cost adjustment is performed on the hottest core Chot in lines 14-15 and cost_maxi is updated. Line 16 looks for the next hottest core to adjust when the current hot spot core’s cost can no longer be adjusted. The program ends when the thermal constraint is satisfied or no more cores can be adjusted. The adjustment factor, adjust_factor, can be any value from 0-1. For this work, a constant factor of 0.90 is used.
Finally, to estimate the complexity of the scheduling algorithm, we note that the main While loop in line 6 is executed NC times. Furthermore, each attempt at scheduling a core (lines 8, 10, 12) also examines all cores (O(NC))). Moreover, active cores, whose number increases each time a rectangle is packed, are examined when the thermal cost function of a core to be packed is checked so that overall complexity is O(NC3). In truth, the thermal simulation takes up the bulk of the processing time for the algorithm to arrive at an answer. Therefore, the use of a cost function frees us from unnecessary and time consuming thermal simulations.
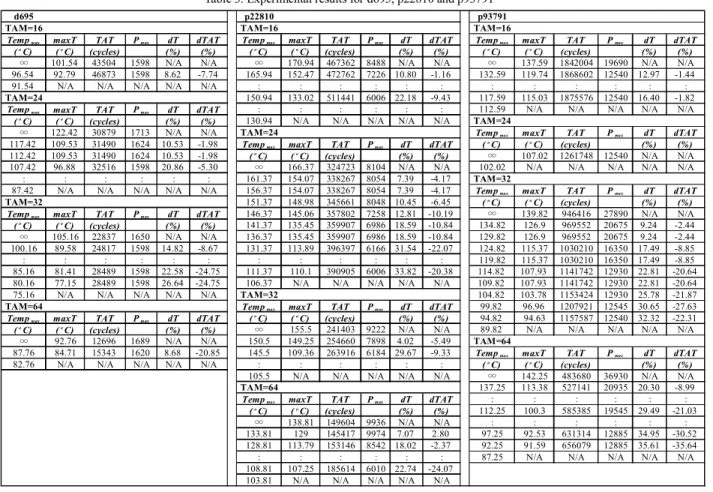
5 Experimental Results
The experiments were done using three SoCs from the ITC’02 SoC Benchmark suite [8], d695, p22810, and p93791. For thermal simulation, cycle-accurate power profiles provided by the authors of [7] were used. Note that the actual power profiles were originally expressed as number of transitions per clock cycle. We converted the values into Watts by simply dividing them by 20, 200, and 500 for d695, p22810, and p93791, respectively, to reflect power dissipation during test. The test data for d695, upon thermal simulation, reveals that the total test time under TAM configurations used for this experiment (16, 24, 32, 64) are too short to show any significant heating of the chip. Therefore, when necessary, we have increased the length of the sampling interval during thermal simulation to allow the effects of heat to show. This is reasonable if we consider that tests for delay faults are normally 2-4 times larger than stuck-at-fault test sets. Since the test application time per core is normally much larger in magnitude compared to lateral resistance, we scaled the test time values such that their magnitudes are within acceptable range of each other when computing for the thermal costs. Experiments were done using an HP ProLiant Workstation with 4 Opteron CPU’s operating at 2.4GHz with 32GB of memory.
Since the original SoC benchmarks did not include layout information, we handcrafted the layout of each SoC. The scheduling and thermal simulation results for d695, p22810 and p93791 are shown in Table 3. Before applying any thermal constraints, we used our scheduling algorithm to create a base schedule without any constraints. From the non-constrained schedule, we determine its maximum temperature, maxT, and use it as the thermal constraint, Tempmax. We gradually decreased the constraint by 5 degree steps, each time recording the actual maximum temperature (maxT), the test application time (TAT), and peak power value (Pmax) given as number of switches. We also computed the gains in temperature (dT) with respect to the base temperature as well as the differences in TAT (dTAT).
In Table 3(d695), a maximum temperature gain of 26.64% was achieved with a modest 24.75% increase in TAT (TAM = 32, Tempmax = 80.16oC). For as little as 5.30% increase in TAT, we can get a relatively large gain of 20.86% in temperature reduction (TAM = 24, Tempmax = 107.42oC). The limitations of global peak-power based approaches becomes apparent when we consider the results for TAM = 32 in Table 3(d695). For most of the temperature variations, the peak power value remained constant at 1598. When such a power constraint is applied, the temperatures of the generated schedule can vary within the range of 89.58oC-77.15oC and our algorithm makes sure that the thermal constraint is indeed satisfied. For p22810 in Table 3(p22810), a maximum temperature reduction of 33.82% can be had for a 20.38% increase in TAT (TAM = 24, Tempmax = 111.37oC). At TAM = 32, the algorithm was able to decrease the temperature from 155.5oC to a manageable 109.36oC with just a 9.33% sacrifice in TAT. Similar results were obtained for p93791 in Table 3(p93791).
6 Conclusion
In this paper, we have presented a TAM/Wrapper co-optimization framework for system-on-chips that ensures thermal safety while still optimizing the test schedule. The proposed method allows us to further explore, beyond the limits of peak-power based test scheduling, possible variations of a schedule which can lead to further reductions in temperature while limiting increases in test application time. Using cycle-accurate power profiles per wrapper configuration and considering both the spatial and temporal dimensions of heat transfer, overall, allows us to more closely approximate real world thermal phenomena. Our method also allows the practical use of thermal simulators for cycle-accurate thermal simulations due to the time reduction brought about by the proposed simplified thermal cost model.
Acknowledgements
The authors would like to thank Dr. Erik Larsson of Linköping University, Sweden, for providing the power profiles for the benchmark SoCs, Dr. Paul Rosinger for providing the preliminary benchmark circuit data, and Prof. Michiko Inoue, Dr. Satoshi Ohtake and members of Computer Design and Test Laboratory in Nara Institute of Science and Technology for their valuable comments.
This work was supported in part by Japan Society for the Promotion of Science (JSPS) under Grants-in-Aid for Scientific Research B(No.15300018) and for Young Scientists(B)(No.18700046). The work of K. Chakrabarty was supported in part by the US National Science Foundation under grant no. OISE-0403217.
References
[1] E. J. Marinissen, S. K. Goel and M. Lousberg, “Wrapper Design for Embedded Core Test,” Proc. of IEEE International Test Conference (ITC), pp. 911-920, 2000.
[2] S. K. Goel and E. J. Marinissen, “Effective and Efficient Test Architecture Design for SoCs,” Proc. of IEEE International Test Conference (ITC), pp. 529-538, 2002.
[3] V. Iyengar, K. Chakrabarty and E. J. Marinissen, “Test Wrapper and Test Access Mechanism Co-Optimization for System-on-Chip,” Journal of Electronic Testing: Theory and Application, vol. 18, pp. 213-230, April 2002.
[4] V. Iyengar, K. Chakrabarty and E. J. Marinissen, “Test Access Mechanism Optimization, Test Scheduling, and Tester Data Volume Reduction for System-on-Chip,” IEEE Trans. On Computers, vol. 52, no. 12, pp. 1619-1632, December 2003.
[5] Y. Xia, M. Chrzanowska-Jeske, B. Wang and M. Jeske, “Using a Distributed Rectangle Bin-Packing Approach for Core-based SoC Test Scheduling with Power Constraints,” Proc. of the International Conference on Computer-Aided Design (ICCAD), pp. 100-105, 2003. [6] Y. Huang et al., “Optimal Core Wrapper Width Selection and SOC Test
Scheduling Based on 3-D Bin Packing Algorithm,” Proc. of IEEE International Test Conference (ITC), pp. 74-82, 2002.
[7] S. Samii, E. Larsson, K. Chakrabarty and Z. Peng, “Cycle- Accurate Test
Power Modeling and its Application to SoC Test Scheduling,” Proc. of IEEE International Test Conference (ITC), pp. 1-10, 2006.
[8] E. J. Marinissen, V. Iyengar and K. Chakrabarty, “A Set of Benchmarks for Modular Testing of SoCs,” Proc. of IEEE International Test Conference (ITC), pp. 519-528, 2002.
[9] P. Rosinger, B. Al-Hashimi and K. Chakrabarty, “Rapid Generation of Thermal-safe Test Schedules,” Proc. Design, Automation and Test in Europe (DATE) Conf., pp. 840-845, 2005.
[10] C. Liu, K. Veeraraghavan and V. Iyengar, “Thermal-Aware Test Scheduling and Hot Spot Temperature Minimization for Core-Based Systems,” Proc. of the 20th IEEE International Symposium on Defect and Fault-Tolerance in VLSI Systems (DFT'05), pp. 552-560, 2005. [11] Z. He et al., “Thermal-Aware SoC Test Scheduling with Test Set
Partitioning and Interleaving,” Proc. of the 21st IEEE International Symposium on Defect and Fault-Tolerance in VLSI Systems (DFT'06), pp. 477-485, 2006.
[12] K. Skadron et al., “Temperature-aware Microarchitecture,” Proc. of the 30th Annual Int’l Symposium on Computer Architecture (ISCA’03), pp. 2-13, 2003.
[13] K. Skadron et al., “Temperature-aware Microarchitecture: Extended discussion and results,” Tech. Rep. CS-2003-08, University of Virginia Department of Computer Science, Apr. 2003.
[14] M. R. Stan et al., “Hotspot: A dynamic compact thermal model at the processor-architecture level,” Microelectronics Journal: Circuits and Systems 34, pp. 1153-1165, Dec. 2003.
[15] S. Lee et al., “Constriction/Spreading Resistance Model for Electronics Packaging,” Proc. of ASME/JSME Thermal Engineering Conf., pp. 199-206, Mar. 1995.
Table 3. Experimental results for d695, p22810 and p93791
d695 p22810 p93791
TAM=16 TAM=16 TAM=16
Tempmax maxT TAT Pmax dT dTAT Tempmax maxT TAT Pmax dT dTAT Tempmax maxT TAT Pmax dT dTAT (oC) (oC) (cycles) (%) (%) (oC) (oC) (cycles) (%) (%) (oC) (oC) (cycles) (%) (%)
∞ 101.54 43504 1598 N/A N/A ∞ 170.94 467362 8488 N/A N/A ∞ 137.59 1842004 19690 N/A N/A
96.54 92.79 46873 1598 8.62 -7.74 165.94 152.47 472762 7226 10.80 -1.16 132.59 119.74 1868602 12540 12.97 -1.44
91.54 N/A N/A N/A N/A N/A : : : : : : : : : : : :
TAM=24 150.94 133.02 511441 6006 22.18 -9.43 117.59 115.03 1875576 12540 16.40 -1.82
Tempmax maxT TAT Pmax dT dTAT : : : : : : 112.59 N/A N/A N/A N/A N/A
(oC) (oC) (cycles) (%) (%) 130.94 N/A N/A N/A N/A N/A TAM=24
∞ 122.42 30879 1713 N/A N/A TAM=24 Tempmax maxT TAT Pmax dT dTAT
117.42 109.53 31490 1624 10.53 -1.98 Tempmax maxT TAT Pmax dT dTAT (oC) (oC) (cycles) (%) (%) 112.42 109.53 31490 1624 10.53 -1.98 (oC) (oC) (cycles) (%) (%) ∞ 107.02 1261748 12540 N/A N/A
107.42 96.88 32516 1598 20.86 -5.30 ∞ 166.37 324723 8104 N/A N/A 102.02 N/A N/A N/A N/A N/A
: : : : : : 161.37 154.07 338267 8054 7.39 -4.17 TAM=32
87.42 N/A N/A N/A N/A N/A 156.37 154.07 338267 8054 7.39 -4.17 Tempmax maxT TAT Pmax dT dTAT
TAM=32 151.37 148.98 345661 8048 10.45 -6.45 (oC) (oC) (cycles) (%) (%) Tempmax maxT TAT Pmax dT dTAT 146.37 145.06 357802 7258 12.81 -10.19 ∞ 139.82 946416 27890 N/A N/A (oC) (oC) (cycles) (%) (%) 141.37 135.45 359907 6986 18.59 -10.84 134.82 126.9 969552 20675 9.24 -2.44
∞ 105.16 22837 1650 N/A N/A 136.37 135.45 359907 6986 18.59 -10.84 129.82 126.9 969552 20675 9.24 -2.44 100.16 89.58 24817 1598 14.82 -8.67 131.37 113.89 396397 6166 31.54 -22.07 124.82 115.37 1030210 16350 17.49 -8.85
: : : : : : : : : : : : 119.82 115.37 1030210 16350 17.49 -8.85
85.16 81.41 28489 1598 22.58 -24.75 111.37 110.1 390905 6006 33.82 -20.38 114.82 107.93 1141742 12930 22.81 -20.64 80.16 77.15 28489 1598 26.64 -24.75 106.37 N/A N/A N/A N/A N/A 109.82 107.93 1141742 12930 22.81 -20.64
75.16 N/A N/A N/A N/A N/A TAM=32 104.82 103.78 1153424 12930 25.78 -21.87
TAM=64 Tempmax maxT TAT Pmax dT dTAT 99.82 96.96 1207921 12545 30.65 -27.63 Tempmax maxT TAT Pmax dT dTAT (oC) (oC) (cycles) (%) (%) 94.82 94.63 1157587 12540 32.32 -22.31
(oC) (oC) (cycles) (%) (%) ∞ 155.5 241403 9222 N/A N/A 89.82 N/A N/A N/A N/A N/A
∞ 92.76 12696 1689 N/A N/A 150.5 149.25 254660 7898 4.02 -5.49 TAM=64
87.76 84.71 15343 1620 8.68 -20.85 145.5 109.36 263916 6184 29.67 -9.33 Tempmax maxT TAT Pmax dT dTAT
82.76 N/A N/A N/A N/A N/A : : : : : : (oC) (oC) (cycles) (%) (%)
105.5 N/A N/A N/A N/A N/A ∞ 142.25 483680 36930 N/A N/A
TAM=64 137.25 113.38 527141 20935 20.30 -8.99
Tempmax maxT TAT Pmax dT dTAT : : : : : :
(oC) (oC) (cycles) (%) (%) 112.25 100.3 585385 19545 29.49 -21.03
∞ 138.81 149604 9936 N/A N/A : : : : : :
133.81 129 145417 9974 7.07 2.80 97.25 92.53 631314 12885 34.95 -30.52 128.81 113.79 153146 8542 18.02 -2.37 92.25 91.59 656079 12885 35.61 -35.64
: : : : : : 87.25 N/A N/A N/A N/A N/A
108.81 107.25 185614 6010 22.74 -24.07
103.81 N/A N/A N/A N/A N/A
![Figure 1. Lateral thermo-resistive model [9]](https://thumb-ap.123doks.com/thumbv2/123deta/5753532.27160/2.918.522.754.149.575/figure-lateral-thermo-resistive-model.webp)