Construction of a Velocity Map Imaging Apparatus and its
Application to a Study of Photoionization Processes of C
60Md. Serajul Islam Prodhan
Doctor of Philosophy
Department of Structural Molecular Science
School of Physical Science
The Graduate University for Advanced Studies
(SOKENDAI)
2008
Acknowledgements
All of the studies of my Ph. D. course were carried out under the discerning supervision of Professor Koichiro Mitsuke. I would like to articulate my deepest and sincere gratitude to him for his keen sighted guidance and encouragement throughout the present study. I am too much grateful to him for giving me opportunity to being his group member and kindness in daily life supports.
I would like to thank Dr. Hideki. Katayanagi to teach me programs as well as our group research contents whenever with long duration I needed. He really understood me and grew my great interests to get a best appetite in C/C++ and Python script languages with correlating our group research works.
I would like to express my earnest thanks to all members of Mitsuke group, Prof. Koichi Nakajima, Dr. Hajime Yagi, Dr. Chaoqun Huang, Dr. Bhim Prasad Kafle for their useful discussion and recurrent helps in my needs.
I am very much grateful to all referee professors who corrected my thesis paper as well as put their best comments to modify it.
I would like to thank Professor Tsuneo Urisu to encourage me in study.
I am thankful to Mr. Toshifumi Asono of Urisu group for his extended helps in filling up scholarship and tuition fee applications on my studies and living in Okazaki, and also to other members in this group for their helps.
I thank Professor Hiroshi Kohguchi in Hiroshima University for providing the program code to perform the IAT and Prof. Toshinori Suzuki in Riken and Kyoto University for fruitful discussion on the VMI technique.
I also thank the members of the UVSOR for their help during the course of the experiments.
I am also thankful to Ms. Shimizu, secretary, Ms. Kyoko Kamo, secretary of the Foreign Affairs of IMS and all the staffs of Sokendai students’ desk for their comprehensive helps.
Lastly, I thank my wife Nessa Ashrafun and son Aumio Fardun Islam for their silent contribution in my study.
“Table of Contents”
Title of the thesis………..i
Acknowledgements……….ii
Contents………..iii
List of abbreviations………....vi
Abstract.………..vii
Chapter 1 Preface
1.1 General Introduction………...11.2 Study of process with VMI technique………....6
References………...…10
Chapter 2 Experimental Method
2.0 Overview………...132.1 Synchrotron Radiation and Monochromator……….13
2.2 Experimental chamber and vacuum system………..17
2.3 Velocity map imaging spectrometer and data acquisition system…………17
References………...19
Chapter 3 Experiments for VMI Images of Rare Gases
3.0 To test the fundamental performance of our VMI spectrometer……...253.1 Introduction………...25
3.2 Image data analysis………...27
3.3 Simulated image of He ions………..28
3.4 To check velocity focusing condition of VMI spectrometer using He sample………..……….29
3.5 Defocusing parameters………..30
3.6 Speed distribution of rare gases………33
3.7 Temperature table by using rare gas image………..34
3.8 Conclusions………..35
References………..36
Chapter 4 Simulation for VMI images of C
56 + 4.0 Simulating the photoion images of C56+ fragment ions from C60……...494.1 Introduction………..49
4.2 Assumptions in the scattering distribution program of C60………..50
4.3 Simulated image of C56 + from C60………51
4.4 To verify vCM (C58+) and vCM (C56+) at different KER in C2- and C4-loss processes………. 54
4.5 Wiener (Optimal) Filtering with FFT………...56
4.6 Reconstructions of C56 + image by deconvolution methodology…………...59
4.7 Conclusions………..61
References………..62
Chapter 5 Summary and Future Prospects
Summary of the thesis………73References………..76
Future Prospect………...77
Appendixes
Appendix-1 ………
………..78Metropolis-Hasting algorithm………78
Appendix-2 ………...81
(a) Inverse Abel Transformation (IAT)..………81
References………..85
(b) Basic concept of the IAT………..86
Appendix-3………87
Maxwell-Boltzmann distribution function……….87
Appendix-4 ………...91
(i) Frequency domain filter in FFT calculations..………...91
(ii) Convolution Theorem……….93
Appendix-5………94
(a) Developed program codes to simulate the images………94
(i) Rare gas image simulation………94
(ii) Photodissociation of fullerene, C60 with thermal parent beam..………..99
(b) Developed program tools to analyze experimental and simulated image...106
List of Publications………...113
List of Conference /Symposium /Workshop………115
List of abbreviation
Ultraviolet synchrotron orbital radiation, UVSOR Synchrotron radiation, SR
Beamline 2B, BL2B
Velocity map imaging, VMI Time-of-flight, TOF
Microchannel plates, MCPs
Wiley-McLaren Time-of-flight, tWM
Kinetic energy, KE
Kinetic energy release, KER Point spread function, PSF Standard deviations, σx, σy
Center-of-mass velocity, vCM
Half widths at half maximum, HWHM Full widths at half maximum, FWHM Temperature in Kelvin, K
Photon energy, hν
Potential energy surface, PES Position-sensitive detector, PSD Two/three-dimensional, 2D/3D Inverse Abel transformation, IAT The Fast Fourier Transformation, FFT Electron volt, eV
Ultra-Violet, UV
Signal to noise ratio, S/N
Time to digital converter, TDC
Abstract of the Thesis
Two major topics of my thesis are (i) development of the velocity map imaging (VMI) spectrometer for investigation of the photoion images of fullerenes, and (ii) simulation studies of possible processes for C60 fragmentation. There are two plausible photofragmentation pathways of excited C60 cations, namely the stepwise C2-loss and direct fission processes. Several groups have tried to distinguish these two processes by measuring the total average kinetic energy release (KER) in the decomposition of C60
+ into C56
+ and smaller fragments. Such efforts, however, have met with failure. The portion of the KER partitioned to the ionic fragments was found to be a few tens of millielectronvolts, and is comparable to or smaller than the average thermal energies of neutral C60 molecules in an effusive beam. The above two processes therefore give C56
+ and smaller fragments with similar average kinetic energies in the laboratory system. Obviously, we must measure a precise 3D velocity distribution, speed and angular distributions, to gain helpful clue to decide on which process is more dominant. For this purpose we have developed a VMI spectrometer that is very sensitive to thermal ions having small translational energies.
Our VMI spectrometer is based on a time-of-flight (TOF) technique for the fragment ions produced by irradiation of synchrotron radiation. Its basic performance has been experimentally tested by using rare gases at photon energy h
ν
= 35 eV. The 3D velocity distributions were reconstructed by using the inverse Abel transformation (IAT) from the measured 2D images projected on a position-sensitive detector (PSD) to the cross-sectional images in the perpendicular plane of the spectrometer. Using the speed distributions extracted from these cross-sectional images, we have evaluated the temperatures by theleast-squares fit of the data points to the Maxwell-Boltzmann distribution. The best fitted curves of the lighter three rare gases are in reasonable agreements with the Maxwell-Boltzmann distributions at the temperature T = 300 K. The temperatures obtained by the fittings are 282, 272 and 295 K for He, Ne and Ar, respectively. Small deviations from the expected value of 300 K can be accounted for by systematic errors peculiar to the numerical image processing in the IAT. For Kr and Xe the agreement is much worse mainly due to smaller signal-to-background ratios. Furthermore, the best fitted curve of Xe appears to shift by 60 K in the direction of lower speed as compared to the expected distribution at 300 K. This shift can be explained as that the raw image of Xe includes not only Xe+ but also Xe2+ signal counts.
We have simulated the images of five rare gases at 300 K to compare with the experimentally obtained images. From the simulated projections on the PSD we have obtained the cross-sectional images and speed distributions. The temperature of He is evaluated to be 287 K from the least-squares fit of the data points of the simulated speed distribution to the Maxwell-Boltzmann distribution. Similar simulations were executed for Ne and Ar. All the temperatures were found to be in good agreement with those from the experimental images. Moreover, a close inspection of the simulated images revealed that the defocusing effect due to a definite ionization volume can be well reproduced by introducing two Gaussian functions as (a) 2
σ
x = 0.2 and8 . 2
2
σ
y = mm when oven with thickness monitor was not installed inside the experimental vacuum chamber, (b) 2σ
x =1.7 and 2σy = 3.2 mm when oven with thickness monitor was installed. Here,σ
x and σy corresponding to the standard deviations of two Gaussian functions which are called defocusing parameters.A novel simulation method has been established for the image of the 3D velocity distributions of C56+ produced by dissociative photoionization of C60.
We calculated the arrival positions of C56+ ions, the spatial density functions, and the projections on the PSD. The 2D cross-sectional images were derived from the projected images of C56
+ ions produced through the stepwise C2- and C4-loss processes. At T = 0 K a marked difference in the image pattern could be seen between the two processes but it is almost smeared out under bulk conditions of C60 at T = 273 K owing to the convolution of the thermal velocity of nascent parent C60
+ ions. In contrast, a remarkable difference at T = 0 K were found to remain even at T = 785 K for the C56
+ formation in the C60 beam, because the transverse velocity of the beam is extremely low. The difference in the image pattern between the two processes permits us to provide conclusive evidence on which mechanism dominates photofragmentation of C60 in the extreme UV region. We therefore consider that the present VMI spectrometer will be available for future studies of the excited-state dynamics of fullerene ions. Experimentally the image of C56+ might be contaminated by the background dark counts due to impurities such as water, air, and organic compounds. We have tried to remove the background counts from the measured 2D image by means of deconvolution using the low-pass and Wiener filters.
Chapter 1
1.1 General Introduction
In 1985, Robert Curl and Richard Smally discovered fullerene, C60, a third allotrope of carbon after diamond and graphite, in a high-pressure supersonic- nozzle beam produced with laser vaporization of graphite [1]. In C60, 60 carbon atoms are arranged to form 20 hexagons and 12 pentagons. Later Krätschmer et al. [2] opened a new epoch in large-scale production of fullerenes in 1990 and various fullerenes have been synthesized and isolated thereafter. Fullerenes have spherical empty space inside the carbon cage. The hollow space is quite unique in that it is a nanometer-scale void and the volume can be varied with the size of fullerenes. It ranges, for example, from 0.4 to 1.0 nm in diameter on going from C60 to C240 [3]. Due to the sp2-hybridized bonding arrangement there are delocalized electrons around the fullerene sphere the number of which is equal to that of the carbon atoms. This draws great interests for their electrical and optical properties. Among various fullerenes C60 exhibits an exceptionally high stability against unimolecular decomposition, novel electronic properties, peculiar reactivity and useful catalytic behaviors. Many scientists in diverse fields have endeavored to elucidate the physical and chemical properties of fullerenes by means of traditional thermodynamic, diffraction, and spectroscopic methods [4,5]. There is a remarkable improvement in the performance of C60 thin-film field-effect transistors (TFTs) fabricated and characterized by molecular-beam deposition under a high vacuum [4,5]. Superconductivity has been discovered at high temperatures in the alkali-metal-doped fullerenes, K3C60
(at critical temperature, Tc = 19 K [5-7]) and Rb3C60 [8]. Furthermore, there has been speculation on the possible chemical and industrial uses of C60 [1] and on
its importance in interstellar dust as well as in geological formations on Earth [2,3]. Recently many authors have tried to make solar cells based on C60 and its derivative [9-11].
As novel forms of fullerene-based material endohedral metallofullerenes (fullerenes with metal atom encapsulated) has already been synthesized successfully. These compounds are particularly interesting because the electron transfer from the encaged metal atom to the carbon cage is known to occur and this substantially alters electronic and magnetic properties of the fullerenes [3].
In the spectroscopic point of view, the fullerenes demonstrate unique photoabsorption and ionization properties. Moreover, a number of groups have obtained great insight into the single and multiple-photoionization processes and nature of dissociation of other clusters by observing the intrinsic behavior of photoionized fullerenes. Mass spectrometric studies of C60 or C70 show that appreciable fragmentation occurs when the system gains an internal energy more than ~ 50 eV in photoexcitation and photoionization processes [12-18]. The ion yield curves for fragments, C60-2n
z+ and C70-2n
z+ (n ≥ 1, z 1) produced from C≥ 60
or C70, respectively, have been reported in the extreme ultraviolet region [13-15]. Comparison between the experimental results and theoretical calculations revealed that the excess energy is statistically distributed among the internal degrees of freedom of the parent ions and sequential ejection of C2 units (C2– loss process) as [19-23].
Cm
z+→ C m-2
z+ + C2, Cm-2
z+→ C m-4
z+ + C2...,
Cm-2n+2z+→ Cm-2nz+ + C2 (z ≥ 1, m = 60 or 70, n ≥ 1) --- (i) This conclusion was made on the basis of the findings that the experimentally observed ion yield curves and theoretically derived fractional abundance curves showed almost the same appearance energies for the formation of Cm-2n
z+ (n = 1) [14,17]. The later curves were derived by employing the RRKM (Rice- Ramsperger-Kassel-Marcus) theory [24] to individual unimolecular reactions
steps. More reliable calculations of the rate constants of the consecutive reactions are sought before closer comparison between the two curves.
There are only a limited number of experimental studies of product analysis of the fragments. The translational energy distribution of Cm-2n
z+ has been measured by several groups to understand the energetics and mechanisms of fragmentation. Hertel and co-workers [21] evaluated the kinetic energies of Cm-2nz+ (1 ≥ ≥n 14) produced by photoionization of C60, laser multiphoton ionization mass spectrometry of C60. Later Märk and co-workers [22] performed electron-impact-ionization mass spectrometry of C60 in conjunction with the ion deflection method and reported a value of ca. 0.45 eV as the total average kinetic energy release (KER) in the decomposition of C60+ into C60-2n+ (8≥n≥1). These authors suggested that not only C2 ejection of process (i) but also single- step two-fragment fission (C2n–loss process) of the parent C60
+ ions Cmz+→ Cm-2nz+ + C2n --- (ii)
could be a possible process for the formation of C60-2nz+. The mechanisms photofragmentation have been studied by measuring the average KER in the decomposition reaction of C60
z+ into C60-2n
z+. The portion of the kinetic energy release partitioned to the fragments was found to be a few tens of meV, and is comparable to or smaller than the average thermal energies of neutral C60
molecules in an effusive beam. The above two processes therefore give C60-2nz+ fragments with similar average kinetic energies in the laboratory frame. This situation should be also the case for other fullerenes, i.e. Cm
+ (m = 70, 76, 78, 84, and so forth). These unsolved problems inspired us to construct a velocity map imaging (VMI) spectrometer in order to study the ionic fragments produced from fullerenes. The conventional time-of-flight method contains KER information in the temporal structure at the arrival period of electrons or ions of a specific mass. On the contrary the ion imaging technique can extract a precise 3D velocity distribution, i.e. speed and angular distributions from the 2D
fragment image. These distributions provide us with a helpful clue to understand the decay processes of excited fullerene ions.
In order to exploit the imaging method to its full potential one needs to improve the quality of the 2D image. The mapping of 3D distributions of charged particles onto the 2D detector is particularly dependent on the configuration of the electrodes that extract ions by electrostatic field ion lenses. In 1987, Chandler and Houston developed the first VMI technique [25] for investigating the 3D velocity distributions of photoions and photoelectrons from small molecules. Later in 1997, Eppink and Parker drastically improved the resolution of the imaging spectrometer by replacing the conventional grid assembly with three–plate open-hole electrodes [26]. Their new ion lens system can lead the ions with the same velocity vector to the same spot on the surface of 2D position-sensitive detector (PSD), even if the ions are produced at different positions in the ionization volume. After this modification the VMI technique has marked a great advance and has become these days one of the most indispensable tools in the field of photochemistry and molecular reaction dynamics [27].
The imaging techniques have been used to measure the C60 fragments in different excitation schemes. Jensen et al. [28] studied the electron-transfer and collision-induced fragmentation processes of C60 in collision with slow highly- charged rare gas ions (i.e. 50 KeV Xe17+). They measured the translational energy release distributions of the fragments ions from C60 by means of an imaging technique. In their experimental set-up a PSD was placed as a detector of a linear time-of-flight (TOF) mass spectrometer. In 2007 Climen et al. combined a time-resolved VMI technique with laser multiphoton ionization to estimate the KE release in fragmentation of C60, though no image data was reported elucidating the 3D velocity distribution of fragment ions [29].
Katayanagi et al. [30] have constructed a VMI spectrometer based on a TOF technique to observe the momentum distributions of the scattered
fragments produced from dissociative photoionization of gaseous fullerenes using synchrotron radiation. The focusing condition can be satisfied by the three element lens system of Eppink-Parker type and high kinetic energy resolution can be achieved on the fragmentation images. We optimized the arrangement and dimensions of the three electrodes of the VMI lens system by ion trajectory simulations of C56+, C58+ and C60+ produced from C60 to achieve high kinetic- energy resolution of ~ 10 meV [20].
The fundamental performance of this VMI spectrometer was experimentally investigated by using five rare gases (i.e. He, Ne, Ar, Kr, and Xe) in the photon energy of h
ν
= 35eV at 300 K. Eppink and Parker have optimized the voltages applied to their VMI lens system by adjusting the voltage to the extractor electrode with keeping the other voltages to the repeller and tube electrodes constant [26]. Following their way of adjusting we determined the optimum focusing conditions by examining the photoion images of rare gases.In my Ph.D dissertation, I present the performance tests of our VMI spectrometer for achieving the high kinetic energy resolution of the photofragment images. Moreover, I describe a methodology and results on the simulation for the image of the 3D velocity distributions of C56
+ to discuss the feasibility of the VMI experiments of C60 beams.
1.2 Study of process with VMI technique
Chemical reaction dynamics emerged as a separate branch of chemistry about 80 years ago with the derivation of the quantum mechanical expressions for the potential energy surface of chemical reactions. Since then, a huge number of experimental and theoretical works have been led to a better understanding of the quantitative nature of chemical reactions by using several modern spectroscopic techniques such as laser spectroscopy, photoabsorption spectroscopy, photoionization mass spectroscopy, and momentum imaging spectroscopy.
Potential energy curves for photodissociation of a hypothetical diatomic molecule AB into fragments A and B (internal state i, j, or k) shown in Figure 1.1 are excited via three different pathways a, b, and c. Such curves are constructed for each molecule using molecular quantum theory and models such as the Wigner-Witmer rules [31]. Due to spin-orbit coupling and other effects, curve crossing can take place leading to other dissociation products than those predicted by molecule – separated atom correlation diagrams. Using this diagram as a guide, we can make a ‘wish list’ of most important photodissociation properties we wish to quantify, as a function of excitation energy (wavelength):
)
( Σ
Α
)
( Π
Β C ( Σ )
)
(k
B
A +
)
B ( j
A +
)
( Σ
Χ
c
b
a
A – B distance
Energy
)
(i
B
A +
Figure 1.1 Hypothetical potential energy curves for different types of photodissociation pathways. (a) Direct excitation from a X(∑) ground state to the repulsive state A(∑) correlating to the first dissociation limit A + B (i). (b) Excitation to the repulsive wall of state B(Π), a bound state correlating with the second dissociation limit A + B (j). Curve crossing to the first dissociation limit via the repulsive state excited in pathway (a) is possible. Excitation at an energy
exceeding the first and second dissociation limits to a bound state C( ∑ ), correlating to A + B (k). Pre-dissociation can take place by curve crossing via another repulsive state to the second limit as drown in the figure.
(i) D0, the A-B bond energy of X state, and of the B and C bound excited states such as those reached by pathways b and c.
(ii) The symmetry (∑, ∏, ∆,…) of ground and excited states. (iii) The absorption cross sections
σ
a ,σ
b ,σ
c for each transition.(iv) Time-scales for (pre-) dissociation of each quantum level of excited states.
(v) Product yields to the first, second, and third dissociation channels. (vi) Angular distributions (beta parameter,β, and higher parameters) and
possible vector correlations for each dissociation channel.
(vii) Characterization of the importance of curve crossing over the photoexcited curve to curves leading to other dissociation products. (viii) Characterization of the importance of coherent (a + b + c) versus
incoherent (a, b, or c) excitation of the different pathways.
Each of the above-listed properties is a research field in its own right. All provide important tests of molecular quantum mechanical theory, and many have practical applications, for example, in atmospheric chemistry.
All of the above information is extracted from product photofragment images in the form of radial, angular, and three-vector information. From the product KER and from energy balance the internal state distribution of both fragments can be determined. The surface pattern of the Newton sphere of photodissociation fragments is characterized via the beta (
β
) parameter and higher order alignment parameters as needed. From these two main quantities, KER andβ
, and from knowledge of the spectroscopy, quantum mechanics ofthe parent molecule, and fragments we begin to fill in as much as possible of the above ‘wish list’.
Ion imaging is a rapidly advancing experimental technique full of possibilities in molecular dynamic research with presenting the full picture in living color. Studies of molecular reactions, energy transfer processes, and photodissociation events can be understood completely, only if the internal energies and velocities of all products can be determined. Thus far, the velocity map imaging research has had a great impact on the field of photodissociation dynamics of diatomic and small polyatomic molecules. Small molecules dissociate into multiple fragments with a limited number of internal energy states, leading to widely spaced and thus more resolvable Newton spheres.
Indeed, the photodissociation experiments in polyatomic molecules provide very detailed information on molecular interaction and bond-breaking dynamics [32]. After the invention of ion imaging technique in photo-dynamics the subsequent rapid expansion in the field has demonstrated the power of the VMI technique in studying the angular and kinetic energy distributions of photofragments [25,33]. Most often these ion imaging dissociation experiments have been done with nanosecond pulsed laser systems in which the total angular recoil distribution of a single rotational quantum state in a molecular fragment can be imaged rapidly by integration of only a few laser shots. Recently, we have succeeded to measure the speed and angular distributions of C60
z+ (z = 1,2) [31] produced from C60 molecular beams by utilizing our newly constructed VMI spectrometer with synchrotron radiation photoionization at 70 eV. Obviously, this was the first result of the velocity distributions of high symmetry fullerene cations.
References
[1] H. W. Kroto, J. R. Health, S. C. O’Brien, R. F. Curl, and R. E. Smalley, Nature (London) 318 (1985) 162
[2] W. Krätschmer, Lowell D. Lamb, K. Fostiropoulos, and D. R. Huffman, Nature 347 (1990) 354.
[3] H. Shinohara, Rep. Prog. Phys. 63 (2000) 843.
[4] J. E. Fischer and P. A. Heiney, J. Phys. Chem. Solids 54 (1993) 1725. [5] R. C. Haddon et al., Nature 350 (1991) 320.
[6] A. F. Hebrad, M. J. Rosseinsky, R. C. Haddon, D. W. Murphy, S. H. Glarum, T. T. M. Palstra, A. P. Ramirez, and A. R. Kortan, Nature (London) 350 (1991) 600.
[7] K. Tanigaki, T. W. Ebbesen, S. Saito, J. Mizuki, J. S. Tsai, Y. Kubo, and S. Kuroshima, Nature (London) 352 (1991) 222.
[8] K. Holczer, O. Klein, S-M. Huang, R. B. Kaner, K-J. Fu, R. L. Whetten, and F. Diederich, Science 252 (1991) 1154.
[9] E. A. Katz, D. Faiman, S. M. Tuladhar, J. M. Kroon, M. M. Wienk, T. Fromherz, F. Padinger, C. J. Brabec, and N. S. Sariciftci, J. Appl. Phys. 90 (2001) 5344.
[10] N. S. Sariciftci, L. Smilowitz, A. J. Heeger, and F. Wudl, Science 258 (1992) 1474.
[11] C. J. Brabec, N. S. Sariciftci, and J. C. Humelen, Adv. Funct. mater 11 (2001) 15.
[12] R. Wörgötter, B. Dünser, P. Scheier, T. D. Märk, M. Foltin, C.E. Klots, J. Laskin and C. Lifshitz, J. Chem. Phys. 104 (1996) 1225.
[13] A. Reinköster, S. Korica, G. Prümper, J. Viefhaus, K. Godehusen, O. Schwarzkopf, M. Mast and U. Becker, J. Phys. B At. Mol. Opt. Phys. 37 (2004) 2135-2144.
[14] K. Mitsuke, H. Katayanagi, J. Kou, T. Mori, and Y. Kubozono, in Ionization, Correlation, and Polarization in Atomic Collisions, CP811, edited by A. Lahman-Bennani and B. Lohmann, American Institute of Physics, New York (2006) 161-166.
[15] J. Laskin, B. Hadas, T. D. Märk, and C. Lifshitz, Int. J. Mass spectrom. 177 (1998) L9-L13.
[16] J. Kou, T. Mori, and Y. Kubozono and K. Mitsuke, J. Electron. Spectrosc. Relat. Phenom. 144 (2005) 247-250.
[17] J. Kou, T. Mori, and Y. Kubozono and K. Mitsuke, Phys. Chem. Chem. Phys. 7 (2005) 119-123.
[18] P. N. Juranic, D. Lukic, K. Barger and R. Wehlitz, Phys. Rev. A 73 (2006). [19] J. Kou, T. Mori, S. V. K. Kumar, Y. Haruyama, Y. Kubozono and K. Mitsuke, J. Chem. Phys. 120 (2004) 6005.
[20] B. P. Kafle, H. Katayanagi, and K. Mitsuke, in Synchrotron Radiation Instrumentation, CP879, edited by J. Y. Choi and S. Rah, American Institute of Physics, New York, 2007, 1809-1812.
[21] H. Gaber. R. Hiss, H. G. Busmann, and I. V. Hertel, Z. Phys. D – Atoms, Molecules and Clusters 24 (1992) 307-309.
[22] D. Muigg, G. Denifl, P. Scheier, K. Becker, and T. D. Märk, J. Chem. Phys. 108 (1998) 963-970.
[23] K. Gluch, S. Matt-Leubner, O. Echt, B. Concina, P. Scheier, and T.D Märk, J. Chem. Phys. 121 (2004) 2137.
[24] R. A. Marcus and O. K. Rice, J. Phys. Colloid Chem. 55 (1951) 894 [25] D. W. Chandler and P. L. Houston, J. Chem. Phys. 87 (1987) 1445-1447. [26] A. T. J. B. Eppink and D. H. Parker, Rev. Sci. Instrum. 68 (1997) 3477- 3448.
[27] T. Suzuki and B. Whitaker, in B. Whitaker (Ed.), Imaging in Molecular Dynamics: Technology and Applications. Cambridge University Press, Cambridge, 2003, p.165-186.
[28] J. Jensen, H. Zettergren, A. Fardi, H. T. Schmidt, and H. Cederquist, Nucl. Instrum. Methods Phys. Res., Sect. B 205, 643 (2003).
[29] B. Climen, B. Concina, M.A. Lebeault, F. Lepine, B. Baguenard, C. Bordas, Chem. Phys. Lett. 437 (2007) 17.
[30] Hideki Katayanagi, Chaoqun Huang, Hajime Yagi, Bhim. P. Kafle, Md. Serajul I. Prodhan, Koichi Nakajima and Koichiro Mitsuke, Rev. Sci. Instrum. (2008) submitted.
[31] G. Hertzberg, Molecular Spectra and Molecular Structure I: Spectra of Diatomic molecules, (Krieger Publishing Company, Florida, 1989).
[32] R. Schinke, Photodissociation Dynamics, Cambridge University Press, Cambridge, 1995.
[33] D. W. Chandler and D. H. Parker Adv. Photochem. 25 (1999), 56
Chapter 2
Experimental Method
2.0 Overview
The description on the experimental arrangements used for the construction of a velocity map imaging apparatus and its application to a study of photoionization processes of C60 has been explained in this chapter.
All the experiments have been performed at the end station of beamline BL2B constructed in the UVSOR synchrotron radiation facility of the Institute for Molecular Science in Okazaki. The optical system consists of two prefocusing mirrors, an entrance slit, an aperture, three spherical gratings (G1 – G3), two folding mirrors, a movable exit slit and a refocusing mirror was described in the literature [1, 2] and simply its schematic diagram is shown in Figure 2.1. All the data in the present study were measured using the grating G3 with grove density of 2400 lines mm-1 which covers the hν range 24 – 55 eV. A set of plane mirrors are inserted across the photon beam between the grating and exit slit. Thereby the second and higher order lights of the grating are significantly reduced and their contamination can be disregarded.
The details of our velocity map imaging spectrometer (VMI) were described elsewhere [3, 4], and we will briefly explain its design and experimental methods by using the schematic diagram in Figures 2.3a and 2.3b which are related to rare gas as well as C60 experiments, respectively.
2.1 Synchrotron Radiation and Monochromator
UVSOR (Ultraviolet Synchrotron Orbital Radiation) facility in IMS consists of a 15 MeV linear accelerator (liniac) as an electron beam pre-injector, a booster electron synchrotron (about 8.5 m diameter) for the accelerating the electron beams up to 750 MeV, and a 750 MeV electron storage ring for
producing synchrotron radiation [5]. The storage ring has a quasi-octagonal shape with combination of 8 bending magnets and 8 straight sections. In straight sections, four undulators are installed for producing higher brightness synchrotron radiation. Furthermore, a radio-frequency RF cavity is used to compensate the energy of the electron beam lost by emitting synchrotron radiation. When UVSOR is operated in its multi bunch mode, the electrons are stored with into 16 bunches. The main parameters of the UVSOR accelerator complex and beamline specifications are summarized in Tables 1 and 2.
Table 1
General parameters of the storage ring
Circumference 53.2 m
Energy 750 MeV
Injection energy 750 MeV
Number of bunches Multi bunch Mode: 16 Single bunch Mode:1
Maximum stored current
500 mA (multi bunch) 100 mA (single bunch)
Beam lifetime Multi bunch Mode: 8h (at 200 mA) Single bunch Mode: 1h (50 mA)
Beam sizes
0.39 mm (horizontal) 0.27 mm (vertical)
Pulsed light period
Multi bunch Mode: 11 ns Single bunch Mode: 176 ns
Pulsed light width ~ 1 ns (min. 20 ps) with a harmonic cavity system
Vacuum pressure ~ 1×10⁻¹⁰ Torr
Table 2
Beamline (BL2B) specifications
Monochromator 18-m spherical grating Dragon-type Wavelength range 6 – 55 nm; 24 – 205 eV
Resolution 2000 – 8000 depending on the gratings
Experiments
Mass spectrom.; Photoelectron spectrosc.; Momentum imaging spectrosc.; e--Ion coincidence spectrosc.; Fullerene beam source
The Beamline BL2B in UVSOR has been utilized for the study of photoionization and reaction dynamics of varius fullerenes in gas phase [6]. As shown in the schematic diagram of this beamline (side view) in Figure 2.1, synchrotron radiation emitted from the storage ring is focused onto the entrance slit by two pre-focusing mirrors. The incident SR (Synchrotron Radiation) was monochromatized by the Dragon type monochromator which covers the h
ν
range of 23 – 205 eV with three gratings: G1 (2400 lines mm-1, R = 18 m) at 80 – 205 eV; G2 (1200 lines mm-1, R = 18 m) at 40 – 100 eV; G3 (2400 lines mm-1, R = 9.25 m) at 24 – 55 eV [1]. After passing through the movable exit slit, the monochromatized light is refocused into the inonization region by the post- focusing mirror (toroidal type). When the entrance and exit slit widths were set to 300 µm, the resolution (the full width at half maximum) which was determined by the measurement of the photon energy was estimated to be 8.5 meV of the members of the 3s-1 np Rydberg series of argon which lie at hν = 25 – 30 eV [2]. The details of the monochromator have been published elsewhere [1, 2].The first-order light monochromatized by the grating G2 was subject to contamination of the second-order light. The hν dependence of the percentage of the second-order light was estimated by measuring the ion yield spectrum of He at h
ν
= 40 – 100 eV [6] (contamination of the third and fourth order lights were considered to be negligible and were not evaluated). The percentage was determined as an adjustable parameter to reduce the observed spectrum from the absorption cross section data of He [7]. For instance, the percentage of hν = 40 eV was found to be 22 %. Alternatively, the percentage of the second-order light could be calculated based on the Kr+ yield spectra of Kr in the vicinity of the 3d5/25p1 resonance peaks appearing at 45.6 and 91.2 eV, with the aid of the reported partial photoionization cross section [8] of Kr at around 45 and nearly 90 eV. The resultant percentage was 23% at ~ 45 eV, which accords well with the value obtained using the ion yield spectrum of He.2.2 Experimental chamber and vacuum system
The experimental chamber is evacuted by turbomolecular pump with its pumping speed of 1000 l/s. The typical background pressure is 5.0×10⁻⁸ Torr without a sample gas. Moreover, a differential pumping chamber has been set between the experimental chamber and the post-focusing mirror which is pumped by an ion pump and supported by two turbo molecular pumps of pumping speed of 340 l/s installed near the both ends of this chamber. When the sample gas is introduced, the background pressure of up to ~ 1×10⁻⁵ Torr is allowed in the experimental chamber with keeping the pressure in the post- focusing mirror chamber ~ 1×10⁻⁹ Torr. Typically, during the experiments the pressure of the chamber was kept to be 1×10⁻⁶ to ~ 1×10⁻⁷ Torr. To shield the photoionization region from the external magnetic field, the µ-metal shield is equipped inside the experimental chamber.
2.3 Velocity map imaging spectrometer and data acquisition
system
The constructed velocity map imaging apparatus is shown in Figure 2.2. Figures 2.3a and 2.3b show the schematic illustrations of the VMI spectrometer based on a time-of-flight (TOF) technique for rare gas as as well as C60 experiments, respectively. In these diagrams: a, repeller; b, extractor; c, drift tube entrance; d, ion drift tube; e, position-sensetive detector (PSD); f, fullerene sample cell; g, nozzle and orifices; h, crystal-oscillator surface thickness monitor. Rare gases of room temperature were introduced into the vacuum chamber through a tube with an inner diameter of 4.4 mm by controlling a niddle valve. An ambient gas pressure was approximately 2.0×10⁻⁶ Torr. The ionization volume lies between the repeller and extractor electrodes and its center is located on the symmetry axis of the VMI lens. The monochromatized
synchrotron radiation with having the spot size of ~ 3 mm horizontal and ~ 1 mm vertical was continuously focused at the center of the intersection region to photoionize the rare gas atoms. The produced photoions of the ionization volume are then extracted by the VMI electrode assembly traveled through a drift tube. Their 3D scattering distributions were projected onto the surface of the PSD (Quantar Technology, 3390A) with a 256×256 spatial resolution composed of chevron-type dual microchannel plates (MCPs) of 25 mm in diameter. This PSD was placed at 375 mm away from the center of ionization volume. The position data were processed by a position computer (Quanter Technology, 2401B). The signal from PSD is also fed into a TDC (time to digital converter) to measure the TOF.
Moreover in photoionization experiments of gaseous C60, the powder of pure C60 is loaded in a cylindrical quartz tube (Figure 2.3b) and further purified by eliminating the organic solvent such as benzene or toluene through heating the sample for one day (12 h) in a vacuum at nearly 2000C. In order to produce a molecular beam of C60, sample holder is to be heated up at 700 – 800 K with a resistive heater. The produced molecular beam was passed from a conical nozzle with a throat diameter of 1 to 2.5 mm and a divergence angle of 7.2o. The distance between the exit of the quartz tube and intersection region is about 43 mm. The water cooled thickness monitor, h (effective area, 53.5 mm2; Inficon, XTM/2) placed about 35 mm away from the central point of the ionization region for the purpose of measuring the flux of the fullerene beam correctly. Photon monitor and picoammeter were used for counting the photoions per second and to measure the photon flux of the synchrotron radiation, respectively. Eppink and Parker have optimized the voltages applied to their VMI lens system by adjusting the voltage VE applied to the extractor electrode with keeping the other constant [9]. Following their way of adjusting we determined the optimum focusing conditions by examining the photoion images of rare gases. The voltages applied to the repeller, extractor and tube electrodes were
VR = 640 V, VE = 353 V and VT = -350 V, respectively. The data acquisition time was set 60 s and the average ion count was ~ 3.5×10⁴ cps. More generally, optimum conditions were obtained when (VE– VT) / (VR– VT) = 0.71. There was no influence of the recoil velocity generated by photoelectron ejection on the speed distribution, because the photon energy used is relatively small (h
ν
= 25 − 50 eV).References
[1] M. Ono, H. Yoshida, H. Hattori and K. Mitsuke, Nucl. Instrum. and Methods in Phys. Res. Sect.A 467, (2001) 577.
[2] H. Yoshida and K. Mitsuke, J. Synchrotron Rad. 5, (1998) 774.
[3] Bhim P. Kafle, Hideki Katayanagi, and Koichiro Mitsuke, in Synchrotron Radiation Instrumentation, CP879, edited by J. Y. Choi and S. Rah, American Institute of Physics, New York, 2007, 1809-1812.
[4] Hideki Katayanagi, Chaoqun Huang, Hajime Yagi, Bhim P. Kafle, Md. Serajul I. Prodhan, Koichi Nakajima and Koichiro Mitsuke, Rev. Sci. Instrum. (2008) (Submitted)
[5] UVSOR ACTIVITY REPORT (2007), Pg. 14 - 24
[6] K. Mitsuke, H. Katayanagi, Bhim P. Kafle, C. Huang, H. Yagi, Md. Serajul I. Prodhan, and Y. Kubozono, J. Phys. Chem. A 111 (34), (2007) 8336.
[7] J. M. Bijau and F. J. Wuilleumier, J. Electron Spectrosc. Relat. Phenom. 71 (1995) 205.
[8] N. Saito and H. I. Suzuki, Int. J. Mass Spec. Ion Proc. 115 (1992) 157. [9] A. T. J. B. Eppink and D. H. Parker, Rev. Sci. Instrum. 68 (9), 3477 (1997).
Figures of Chapter Two
Schematic diagram (side view) of BL2B
UVSOR 750 MeV Electron Storage Ring
SR
M0
M1 S1
AP
G1, G2 & G3 S2
M4
Q
y x z
06
SR, Synchrotron radiation SR, Synchrotron radiation source point; M0, Elliptically bent source point; M0, Elliptically bent plane mirror; M1, pre
plane mirror; M1, pre--focusing focusing (spherical) mirror, S1, Entrance slit; (spherical) mirror, S1, Entrance slit; AP, Aperture; G1, G2 & AP, Aperture; G1, G2 & G3, G3, Spherical gratings;
Spherical gratings; S2, Exit slit; M4, Refocusing mirror (Toroidal mirror);
Q, Sample point; x, Molecular Beam direction; y, Syn. Rad. path; and z, TOF axis.
G1 (2400 lines mm-1, R = 18 m) at 80 –205 eV; G2 (1200 lines mm-1, R = 18 m) at 40 –100 eV; G3 (2400 lines mm-1, R = 9.25 m) at 23 –55 eV
15 MeV Linac 750 MeV Booster Synchrotron
Figure 2.1
Schematic diagram (side view) of BL2B equipped with an 18 m spherical grating monochromator (SGM).
Constructed velocity map imaging (VMI) Apparatus
Figure 2.2
Main components: 1. Repeller electrode, 2. Extractor electrode, 3. Tube electrode, 4. Time-of-flight (TOF) tube, 15. Potential switch, 11 & 13. Grounded electrodes, 12. Retarding electrode and 17. PSD holder
Monochromator
& Controller Photon monitor
& Picoammeter
Z
y x
VT SR VR
b a
e d c
The Schematic Diagram of our VMI Spectrometer at BL2B
VE Preamplifier
XY DISPLAY
Position Computer
TDC I/F
GPIB I/F
GPIB Power Supplies
For the electrodes
Rare gas experiments
Figure 2.3a
Velocity map imaging setup for rare gas experiments.
Thickness Monitor
Monochromator
& Controller Photon monitor
& Picoammeter
Z
y SR x
VT VR
h
b a
e d c
g
f
The Schematic Diagram of our VMI Spectrometer at BL2B
VE Preamplifier
XY DISPLAY
Position Computer
TDC I/F
GPIB I/F
GPIB
GPIB Power Supplies
For the electrodes
C60experiments
Figure 2.3b
Schematic illustration of the VMI spectrometer. (a), repeller; (b), extractor; (c), ion drift tube entrance; (d), ion drift tube; (e), position-sensitive detector (PSD); (f), fullerene sample cell; g, nozzle and orifices; (h), crystal- oscillator surface thickness monitor.
(a) (b)
(d)
(c)
Figure 2.4
Photographs of our VMI spectrometer (TOF based), end station of BL2B and monochromator. (a) Inside view of the electrodes, ion drift tube, thickness monitor, and oven with other components, (b) Position of the PSD installed inside the experimental vacuum chamber. (c) Outside view of the end station of BL2B and (d) 18-m spherical grating monochromator.
Chapter 3
“Published in Chem. Phys. Letters, CPL 469 (2009) 19-25”
3.0 To test the fundamental performance of our VMI
spectrometer
3.1 Introduction
The velocity map imaging (VMI) technique was first developed by Chandler and Houston [1] for investigating the three-dimensional (3D) velocity distributions of photoions and photoelectrons from small molecules. Eppink and Parker [2] have replaced the conventional electrostatic lenses having a meshed hole by a new lens system composed of three electrodes with an open hole to dramatically improve the resolution of images. Their lens system can guide the ions with the same velocity vector to the same spot on the surface of a 2D position-sensitive detector (PSD), even if the ions are produced at different positions in the ionization volume. After this modification the VMI technique has marked a great advance and has become these days one of the most indispensable tools in the field of photochemistry and molecular reaction dynamics [3].
We have recently constructed a VMI spectrometer based on a time-of- flight (TOF) technique to observe the momentum distributions of the scattered fragments produced from dissociative photoionization of gaseous fullerenes using synchrotron radiation [4,5]. It is well known from previous photon and electron impact experiments that appreciable fragmentation occurs when C60 or C70 gains an internal energy more than ~ 50 eV in excitation and ionization processes [6-12]. In 2007 Climen et al. combined a time-resolved VMI technique with laser multiphoton ionization to estimate the kinetic energy
release (KER) in fragmentation of C60, though no image data was reported elucidating the 3D velocity distribution of fragment ions [13].
Decomposition of C60
z+ or C70
z+ (z 1) primarily formed leads to fragment ions with even numbered carbon atoms, C
≥
60-2n
z+ and C70-2n
z+. More generally various fullerenes Cm undergo similar fragmentation by way of Cmz+ [14]. Here, n designates the number of C2 units lost. The size m of the fullerenes and higher fullerenes takes 60, 70, 76, 78, 84, and so forth. For the fragmentation with n ≥ 2 two possible processes have been proposed [4,15,16]. One process is sequential ejection of C2 units as
Cmz+→ Cm-2z+ + C2, Cm-2z+→ Cm-4z+ + C2...,
Cm-2n+2z+→ Cm-2nz+ + C2, C2-loss process (1) and the other is fission-like ejection of C2n as
Cm
z+→ C m-2n
z+ + C2n, C2n-loss process (2)
For instance, the formation of C56+ may proceed under either C2- or C4-loss process from C60+ (z ≥ 1, m = 60 or 70, n ≥ 2). Several groups have tried to distinguish the two processes by measuring the average KER in the decomposition of C60 into C56
+ and smaller fragments [14-16]. Such efforts, however, have met with failure. The portion of the KER partitioned to C60-2n
z+
fragments was found to be a few tens of meV, and is comparable to or smaller than the average thermal energies of neutral C60 molecules in an effusive beam. The two mechanisms therefore give C60-2n
z+ fragments with similar average kinetic energies in the laboratory frame. This situation should be also the case for other fullerenes i.e. Cm
z+ (m = 70, 76, 78, 84, and so forth). It is needed to measure a precise 3D velocity distribution, i.e. speed and angular distributions, from which we can gain helpful clue to understand the decay mechanisms of excited fullerene ions. Thus there is an obvious need for a VMI spectrometer which is sensitive to thermal ions with small translational energies. In this chapter we will report the performance tests of our VMI spectrometer aimed to high kinetic-energy resolution on the photofragment images of fullerenes. To
check this performance we have selected five rare gases (i.e. He, Ne, Ar, Kr, and Xe) at room temperature because of their known velocity distributions.
3.2 Image data analysis
We defined a Cartesian coordinate system whose origin is located at the center of the ionization volume. Here, the synchrotron radiation path is assigned to the y axis, and the symmetry axis of the VMI lens and drift tube to the z axis. The x axis intersecting with the y and z axes at right angles accords with the molecular beam path when C60 is used as a sample. We can convert the image on the PSD to the cross-sectional image of the initial 3D velocity distribution in the x-y plane by using the inverse Abel transformation (IAT) [1,17,18]. In the case of rare gases proper conversion by IAT is guaranteed because their 3D velocity distribution is isotropic which must be cylindrical symmetric along all the axes. On the other hand the application of IAT for C60 fragment ions is also fulfilled as the 3D velocity distribution of the C60 molecular beam is cylindrical symmetric with respect to the x axis which is parallel to the plane of PSD [2]. This constraint is satisfied for the detection of parent ions, such as C60
+ and C60 2+, because the 3D velocity distribution of the C60 molecular beam is cylindrical symmetric with respect to the x axis (Figure 2.3b). Furthermore, IAT is applicable even for dissociated ions, such as C58
+ and C56
+, if the polarization vector of synchrontron radiation is directed to the x axis.
Using the cross-sectional image in the x-y plane, we have then calculated the radial distance r between the origin and each pixel and obtained a histogram of pixel intensities as a function of r, which will be hereafter called the radial distribution. Finally, the radial distribution was converted to the speed distribution by using the change of variable,
r = v tWM (3.2)
where v represents the speed (i.e. velocity magnitude), and tWM the TOF value calculated from the Wiley-McLaren formula [19].
3.3 Simulated image of He ions
We have simulated the projection of the 3D velocity distribution of He at 300 K and compared them with the experimentally obtained images. The number of He atoms used in the simulation was set to . It is assumed that the ionization takes place at the origin and that each He
105
= N
+ ion flies from the origin with keeping its original thermal velocity
v
of a parent He. The speed was simulated by generating random numbers utilizing Metropolis- method from Maxwell-Boltzmann distribution| v |
v =
⎟⎟⎠⎞
⎜⎜⎝⎛−
⎟⎟⎠⎞
⎜⎜⎝⎛
= kT
v v m
T k m v
N
N d 4 2 exp 2
d
1 2 2 2
3
π π (3.3a)
where
v v N N d
) ( d
1 is the probability density function of the speed of He atoms at the temperature
T
. In the right hand,m
, stand for the mass of He, and Boltzmann constant, respectively. The 3D velocity components of Hek
+ can be expressed as
) cos , sin sin , cos sin
( ) ,
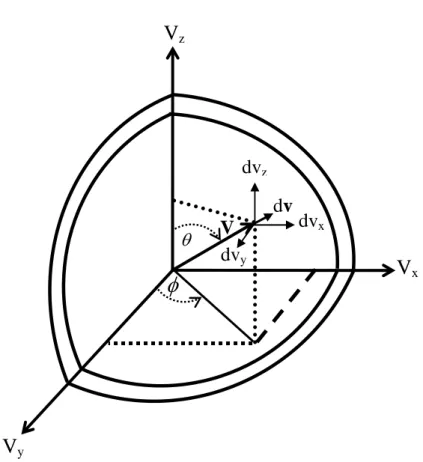
(v x v y,v z = v θ φ v θ φ v θ (3.3b) with the polar angle θ with respect to axis and the azimuth angle z
φ
on the x- y plane (see Figure-3 of Appendix-3). We generated uniformly distributed random numbers for cosθ
andφ
. The arrival position of the He+ ion after the flight timetWM should be (x , y, z) = (vxtWM, vytWM, vztWM ) . Repeating the above procedure for every He+ and adding up the number of ions at each volume element dxdydz, we can evaluate the spatial density function.dz dy dx
z y x dN z N
y x
I( , , ) = 1 ( , , ) (3.3c)
The 2D image projected on an x-y plane is then calculated by the sum of over z as
) , , (x y z I
(3.3d)
∑
=
z
z y x I y
x
I ( , ) ( , , )
The calculated is equivalent to the experimental image on the PSD, if the size of the ionization is sufficiently small and the magnification factor of the VMI lens system is unity. The spatial resolution is set to mm corresponding to that of the PSD.
) , (x y I
1 .
= 0
= dy dx
3.4 To check velocity focusing conditions of VMI spectrometer
using He sample
Eppink and Parker have optimized the voltages applied to their VMI lens system by adjusting the voltage VE applied to the extractor electrode with keeping the other voltages constant [2]. Following their way of adjusting we determined the optimum focusing conditions by examining the photoion images of rare gases. In the insets of Figure 1, Panels (a – d) show 2D raw images of He+ at 300 K, i.e. the projections of the 3D velocity distributions on the PSD. The voltages applied to the MCP, repeller, and tube electrodes were VMCP = - 2200 V, VR = 640 V and VT = - 350 V, respectively. The panels (a – d) correspond to the extractor voltages, VE = 338, 343, 348 and 353 V, respectively. The data acquisition time was 60 s and the average ion count was ~ 3.5 × 10⁴ cps. We projected the images onto the horizontal axis of the PSD by summing up pixel intensities in the vertical direction from -128 to + 128. This procedure was carried out for the 2D images measured with different VE values from 338 to 353 V at interval of 5 V. The resultant 4 curves are summarized in Figure 1(e). The curve at VE = 353 V is the sharpest among all the curves. Obviously, the focusing condition depends strongly on the extractor voltages. More generally, optimum conditions were obtained when (VE - VT) / (VR - VT) = 0.71.
3.5 Defocusing parameters
The Panel (a) of Figure 2 shows the ideal 2D projection of He+ at 300 K which was obtained by simulation as explained in § 3.3 and it is specified as simulationn I. By applying the IAT to this image we have obtained the cross- sectional image of Panel (b) and speed distribution in Figure 2(c). A narrow dotted stripe in Panel (b) running along the vertical symmetric axis (i.e. x axis) appears from the noise due to numerical image processing in the IAT and has no physical meaning. The temperature was estimated in Figure 2(c) to be 287 K from the least-squares fit of the calculated data points (filled circles) to the Maxwell-Boltzmann distristribution (solid curve). The curve accords well with the experimental curve with T = 282 K (Figure 5 k). Similar simulations were executed for Ne and Ar. There temperatures determined from the simulated speed distributions were found to be in good agreements with those from Figures 5(l) and (m), respectively.
The Panel (a) of Figure 3 shows the experimental 2D projections on the PSD of the 3D velocity distribution of He+ produced by photoionization of He at
= 35
ν
h eV in absence of oven with thickness monitor (see Figure 2.3a of chapter 2) installation. The elliptical image of Panel 3(a) whose major axis lies on the y axis suggests that the velocity focusing conditions are not realized all over the ionization volume and that the deformation from the ideal circular image of Figure 2(a) arises from the elongation of the ionization volume along the photon beam path. We performed a different simulation for a quantitative treatment dealing with a finite ionization volume which is referred to simulation II. The spatial distribution of ionization points is represented by the “point spread function”:
⎟⎟⎠⎞
⎜⎜⎝⎛
⋅⎟⎟ −
⎠
⎜⎜⎝ ⎞
⎛ −
⋅
= 22 22
exp 2 1 exp 2
1 2 ) 1 , (
y y
x x
y y x
x
PSF
π σ σ σ σ
(3.5a)where the standard deviations
σ
x and σy of the two Gaussian functions are called defocusing parameters. Individually,σ
x andσ
ycan be correlated to the above deformation in the x and y directions, respectively, because the electric field in the VMI spectrometer has a cylindrical symmetry with respect to the z axis [4]. In simulation II the arrival position of a He+ ion is given by) ,
, (
) , ,
(x y z = vxtWM + ∆x vytWM + ∆ y vztWM + ∆z (3.5b) and the random numbers are generated for ∆x and ∆ y from the distribution of
. Consequently simulated for the defocused ionization volume should differ from that for the single ionization point. Usually,
) , (x y
PSF I(x,y)
σ
x2 ,
σ
y2 are smaller than the full widths at the half maximum (FWHM) of the ionization volume with respect to the x and y coordinates, respectively.
The values of 2
σ
x and 2σ
y can be obtained from the comparison between experimental and ideal 2D projections, i.e. in Figures 3(a) and 2(a), respectively. In Figure 3(c) the radial distributions of the two images are extracted from their upper ( and lowertriangular areas: the filled circles from Figure 3(a) and filled stars from Figure 2(a). Then
) 135 45− 0
φ
= (φ
= 225− 3150 )σ
x2 is optimized by simulation II, so that a recalculated radial distribution can get closer to the filled circles. Next, a similar optimization is carried out for 2
σ
y alone starting from the filled circles and filled stars in Figure 3(d). Here, each radial distribution was extracted from the leftand right triangular areas of the image. Subsequently the best combination of
) 225 135
(
φ
= − 0 (φ
= 315− 450)σ
x2 and 2