WORLD ECONOMIC OUTLOOK
April 2014
Recovery Strengthens, Remains Uneven
Cataloging-in-Publication Data Joint Bank-Fund Library
World economic outlook (International Monetary Fund)
World economic outlook : a survey by the staff of the International Monetary Fund. — Washington, DC : International Monetary Fund, 1980–
v. ; 28 cm. — (1981–1984: Occasional paper / International Monetary Fund, 0251-6365).
— (1986– : World economic and financial surveys, 0256-6877) Semiannual. Some issues also have thematic titles.
Has occasional updates, 1984– ISSN (print) 0256–6877 ISSN (online) 1564–5215
1. Economic development — Periodicals. 2. Economic forecasting — Periodicals. 3. Economic policy — Periodicals. 4. International economic relations — Periodicals. I. International Monetary Fund. II. Series: Occasional paper (International Monetary Fund). III. Series: World economic and financial surveys.
HC10.80
ISBN 978-1-48430-834-9 (paper) 978-1-47551-576-3 (PDF) 978-1-47557-193-6 (ePub) 978-1-48432-630-5 (Mobi)
Disclaimer: The analysis and policy considerations expressed in this publication are those of the IMF staff and do not represent official IMF policy or the views of the IMF Executive Directors or their national authorities.
Recommended citation: International Monetary Fund, World Economic Outlook— Recovery Strengthens, Remains Uneven (Washington, April 2014).
Publication orders may be placed online, by fax, or through the mail: International Monetary Fund, Publication Services
P.O. Box 92780, Washington, DC 20090, U.S.A. Tel.: (202) 623-7430 Fax: (202) 623-7201
E-mail: [email protected] www.imfbookstore.org
www.elibrary.imf.org
Assumptions and Conventions ix
Further Information and Data xi
Preface xii Foreword xiii
Executive Summary xv
Chapter 1. Recent Developments and Prospects 1
he Demand and Activity Perspective 1
he External Sector Perspective 12
Downside Risks 13
Policies 19
Special Feature: Commodity Prices and Forecasts 25
Box 1.1. Credit Supply and Economic Growth 32
Box 1.2. Is China’s Spending Pattern Shifting (away from Commodities)? 36 Box 1.3. Anchoring Inlation Expectations When Inlation Is Undershooting 41 Box 1.4. Exchange Rate Regimes and Crisis Susceptibility in Emerging Markets 44 References 47
Chapter 2. Country and Regional Perspectives 49
he United States and Canada: Firming Momentum 49
Europe 53
Asia: Steady Recovery 57
Latin America and the Caribbean: Subdued Growth 60
Commonwealth of Independent States: Subdued Prospects 63
he Middle East and North Africa: Turning the Corner? 65
Sub-Saharan Africa: Accelerating Growth 68
Spillover Feature: Should Advanced Economies Worry about Growth Shocks
in Emerging Market Economies? 72
References 79
Chapter 3. Perspectives on Global Real Interest Rates 81
Stylized Facts: Measuring Real Rates and the Cost of Capital 83
Determinants of Real Rates: A Saving-Investment Framework 86
Which Factors Contributed to the Decline in Real Interest Rates? 88
Should We Expect a Large Reversal in Real Rates? 96
Summary and Policy Conclusions 97
Appendix 3.1. Model-Based Inlation and Dividend Growth Expectations 99
Appendix 3.2. Investment Proitability 99
Appendix 3.3. Fiscal Indicator 100
Appendix 3.4. he Efect of Financial Crises on Investment and Saving 101
Appendix 3.7. Sample of Countries Used in Tables and Figures 102
Box 3.1. Saving and Economic Growth 107
References 111 Chapter 4. On the Receiving End? External Conditions and Emerging Market Growth Before, During,
and After the Global Financial Crisis 113
Efects of External Factors on Emerging Market Growth 116
Global Chain or Global China? Quantifying China’s Impact 124
Growth Efects: he Long and the Short of It 126
Shifting Gears: Have Emerging Markets’ Growth Dynamics Changed since the Global Financial Crisis? 128
Policy Implications and Conclusions 133
Appendix 4.1. Data Deinitions, Sources, and Descriptions 133
Appendix 4.2. Estimation Approach and Robustness Checks 137
Box 4.1. he Impact of External Conditions on Medium-Term Growth in Emerging Market Economies 145 References 150 Annex: IMF Executive Board Discussion of the Outlook, March 2014 153
Statistical Appendix 155
Assumptions 155
What’s New 156
Data and Conventions 156
Classiication of Countries 157
General Features and Composition of Groups in the World Economic Outlook Classiication 157 Table A. Classiication by World Economic Outlook Groups and heir Shares in Aggregate GDP,
Exports of Goods and Services, and Population, 2013 159
Table B. Advanced Economies by Subgroup 160
Table C. European Union 160
Table D. Emerging Market and Developing Economies by Region and Main Source of Export Earnings 161 Table E. Emerging Market and Developing Economies by Region, Net External Position,
Status as Heavily Indebted Poor Countries, and Low-Income Developing Countries 162
Table F. Key Data Documentation 164
Box A1. Economic Policy Assumptions Underlying the Projections for Selected Economies 174
List of Tables 179
Output (Tables A1–A4) 180
Inlation (Tables A5–A7) 187
Financial Policies (Table A8) 192
Foreign Trade (Table A9) 193
Current Account Transactions (Tables A10–A12) 195
Balance of Payments and External Financing (Tables A13–A14) 201
Flow of Funds (Table A15) 203
Medium-Term Baseline Scenario (Table A16) 207
World Economic Outlook, Selected Topics 209
Tables
Table 1.1. Overview of the World Economic Outlook Projections 2
Table 1.SF.1. Root-Mean-Squared Errors across Forecast Horizons h (Relative to the Random
Walk Model) 31
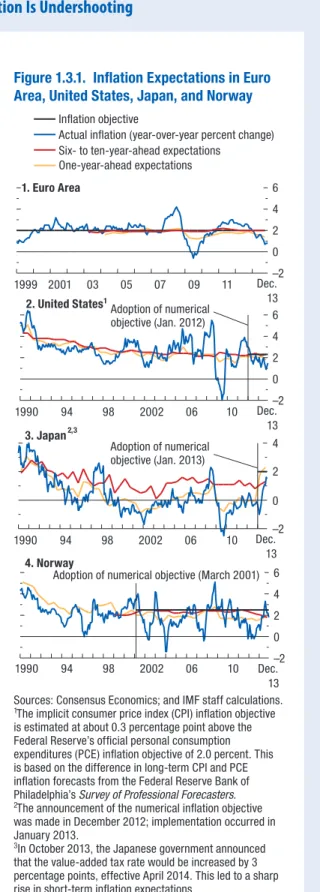
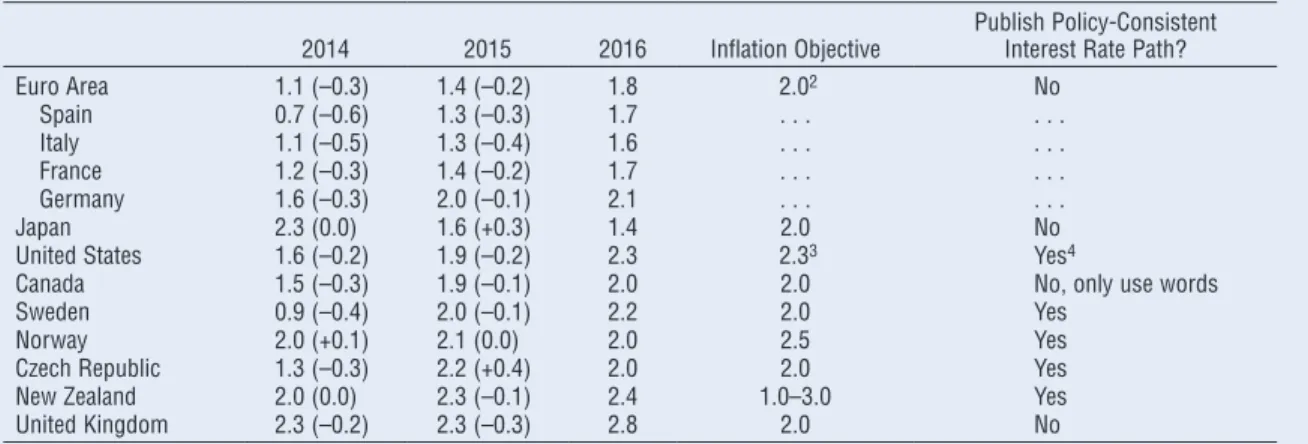
Table 1.3.1. Consensus Consumer Price Index Inlation Expectations 42
Table 2.1. Selected Advanced Economies: Real GDP, Consumer Prices, Current Account Balance, and Unemployment 52 Table 2.2. Selected European Economies: Real GDP, Consumer Prices, Current Account Balance, and
Unemployment 54 Table 2.3. Selected Asian Economies: Real GDP, Consumer Prices, Current Account Balance, and
Unemployment 59 Table 2.4. Selected Western Hemisphere Economies: Real GDP, Consumer Prices, Current Account
Balance, and Unemployment 62
Table 2.5. Commonwealth of Independent States: Real GDP, Consumer Prices, Current Account
Balance, and Unemployment 65
Table 2.6. Selected Middle East and North African Economies: Real GDP, Consumer Prices, Current
Account Balance, and Unemployment 67
Table 2.7. Selected Sub-Saharan African Economies: Real GDP, Consumer Prices, Current Account
Balance, and Unemployment 69
Table 2.SF.1. Exports to Emerging Market Economies, 1995 versus 2008 74 Table 3.1. Alternative Hypotheses Explaining a Decline in Real Interest Rates 87
Table 3.2. Factors Afecting Real Interest Rates 96
Table 3.3. Investment (Saving) and the Real Interest Rate, Reduced-Form Equations 102 Table 3.4. Data Coverage for Global Interest Rates, Investment, and Saving 103
Table 3.1.1. Saving and Growth: Granger Causality Tests 108
Table 3.1.2. Determinants of the Evolution in Saving-to-GDP Ratios 110 Table 4.1. Impulse Responses to Shocks within the External Block: Baseline Model 119 Table 4.2. Impulse Responses to Shocks within the External Block: Modiied Baseline Model
with China Real GDP Growth 126
Table 4.3. Share of Output Variance Due to External Factors 128
Table 4.4. Data Sources 134
Table 4.5 Sample of Emerging Market Economies and International Organization for Standardization
Country Codes 135
Table 4.6. Correlations of Domestic Real GDP Growth with Key Variables, 1998–2013 138
Table 4.1.1. Growth Regressions for Emerging Markets, 1997–2011 146
Table 4.1.2. Growth Regressions for Emerging Markets: Brazil, China, India, Russia, and South Africa
versus Other Emerging Market Partner Growth, 1997–2011 148
Table 4.1.3. Growth Regressions for Emerging Markets 149
Table A1. Summary of World Output 180
Table A2. Advanced Economies: Real GDP and Total Domestic Demand 181
Table A3. Advanced Economies: Components of Real GDP 182
Table A4. Emerging Market and Developing Economies: Real GDP 184
Table A5. Summary of Inlation 187
Table A6. Advanced Economies: Consumer Prices 188
Table A7. Emerging Market and Developing Economies: Consumer Prices 189 Table A8. Major Advanced Economies: General Government Fiscal Balances and Debt 192
Table A9. Summary of World Trade Volumes and Prices 193
Table A10. Summary of Balances on Current Account 195
Table A14. Emerging Market and Developing Economies: Private Financial Flows 202
Table A15. Summary of Sources and Uses of World Savings 203
Table A16. Summary of World Medium-Term Baseline Scenario 207
Online Tables
Table B1. Advanced Economies: Unemployment, Employment, and Real GDP per Capita Table B2. Emerging Market and Developing Economies: Real GDP
Table B3. Advanced Economies: Hourly Earnings, Productivity, and Unit Labor Costs in Manufacturing Table B4. Emerging Market and Developing Economies: Consumer Prices
Table B5. Summary of Fiscal and Financial Indicators
Table B6. Advanced Economies: General and Central Government Net Lending/Borrowing and Excluding Social Security Schemes
Table B7. Advanced Economies: General Government Structural Balances
Table B8. Emerging Market and Developing Economies: General Government Net Lending/ Borrowing and Overall Fiscal Balance
Table B9. Emerging Market and Developing Economies: General Government Net Lending/ Borrowing
Table B10. Advanced Economies: Exchange Rates
Table B11. Emerging Market and Developing Economies: Broad Money Aggregates Table B12. Advanced Economies: Export Volumes, Import Volumes, and Terms of Trade
in Goods and Services
Table B13. Emerging Market and Developing Economies by Region: Total Trade in Goods
Table B14. Emerging Market and Developing Economies by Source of Export Earnings: Total Trade in Goods Table B15. Advanced Economies: Current Account Transactions
Table B16. Emerging Market and Developing Economies: Balances on Current Account
Table B17. Emerging Market and Developing Economies by Region: Current Account Transactions Table B18. Emerging Market and Developing Economies by Analytical Criteria: Current
Account Transactions
Table B19. Summary of Balance of Payments, Financial Flows, and External Financing Table B20. Emerging Market and Developing Economies by Region: Balance of Payments
and External Financing
Table B21. Emerging Market and Developing Economies by Analytical Criteria: Balance of Payments and External Financing
Table B22. Summary of External Debt and Debt Service
Table B23. Emerging Market and Developing Economies by Region: External Debt by Maturity and Type of Creditor
Table B24. Emerging Market and Developing Economies by Analytical Criteria: External Debt by Maturity and Type of Creditor
Table B25. Emerging Market and Developing Economies: Ratio of External Debt to GDP Table B26. Emerging Market and Developing Economies: Debt-Service Ratios
Table B27. Emerging Market and Developing Economies, Medium-Term Baseline Scenario: Selected Economic Indicators
Figures
Figure 1.1. Global Activity Indicators 3
Figure 1.2. GDP Growth Forecasts 3
Figure 1.3. Monetary Conditions in Advanced Economies 4
Figure 1.4. Fiscal Policies 5
Figure 1.5. Global Inlation 6
Figure 1.6. Capacity, Unemployment, and Output Trend 7
Figure 1.7. Overheating Indicators for the Group of Twenty Economies 9
Figure 1.8. Financial Market Conditions in Advanced Economies 10
Figure 1.9. Financial Conditions and Capital Flows in Emerging Market Economies 11 Figure 1.10. Monetary Policies and Credit in Emerging Market Economies 11
Figure 1.11. Exchange Rates and Reserves 12
Figure 1.12. External Sector 13
Figure 1.13. Risks to the Global Outlook 14
Figure 1.14. Recession and Delation Risks 14
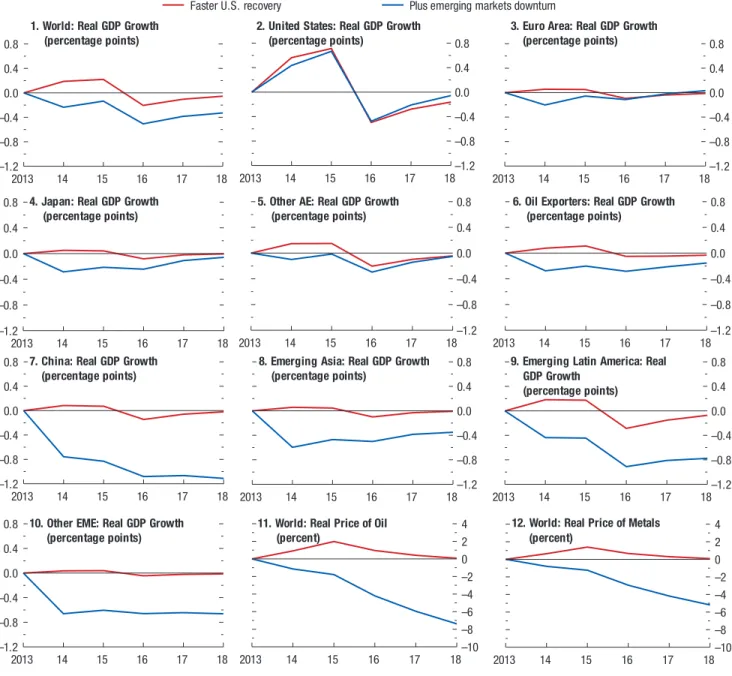
Figure 1.15. Slower Growth in Emerging Market Economies and a Faster Recovery in the United States 18
Figure 1.SF.1. Commodity Market Developments 26
Figure 1.SF.2. Brent Forecast Errors and Futures 27
Figure 1.SF.3. Vector Autoregression and Combination Forecasts 29
Figure 1.SF.4. Rolling Root-Mean-Squared Errors: Recursive Estimation 30 Figure 1.1.1. Cumulative Responses of GDP to a 10 Percentage Point Tightening of Lending Standards 33
Figure 1.1.2. Credit Supply Shocks 34
Figure 1.1.3. Contribution of Credit Supply Shocks to GDP 34
Figure 1.2.1. China: Real GDP Growth and Commodity Prices 36
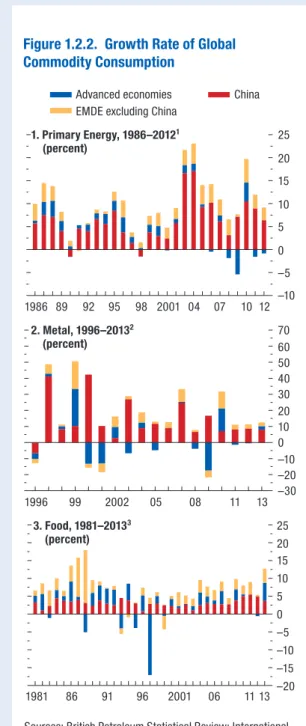
Figure 1.2.2. Growth Rate of Global Commodity Consumption 37
Figure 1.2.3. Actual and Predicted Per Capita Commodity Consumption 38
Figure 1.2.4. Spending Patterns 39
Figure 1.3.1. Inlation Expectations in Euro Area, United States, Japan, and Norway 41 Figure 1.4.1. Distribution of Exchange Rate Regimes in Emerging Markets, 1980–2011 44 Figure 1.4.2. Predicted Crisis Probability in Emerging Markets, 1980–2011 45
Figure 1.4.3. Probability of Banking or Currency Crisis 46
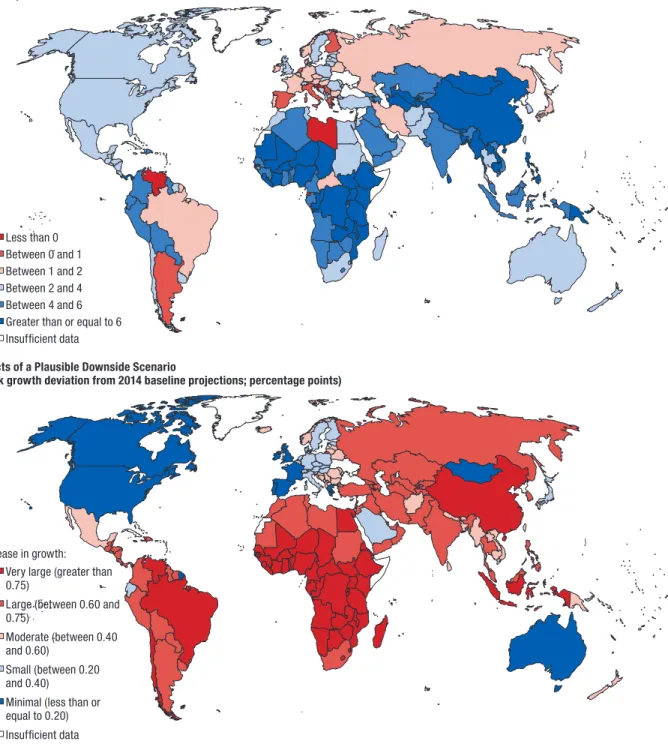
Figure 2.1. 2014 GDP Growth Forecasts and the Efects of a Plausible Downside Scenario 50
Figure 2.2. United States and Canada: Recovery Firming Up 51
Figure 2.3. Advanced Europe: From Recession to Recovery 55
Figure 2.4. Emerging and Developing Europe: Recovery Strengthening, but with Vulnerabilities 56
Figure 2.5. Asia: Steady Recovery 58
Figure 2.6. Latin America and the Caribbean: Subdued Growth 61
Figure 2.7. Commonwealth of Independent States: Subdued Prospects 64
Figure 2.8. Middle East, North Africa, Afghanistan, and Pakistan: Turning a Corner? 66
Figure 2.9. Sub-Saharan Africa: Accelerating Growth 70
Figure 2.SF.1. Real Trade Linkages between Advanced Economies and Emerging Market Economies 73 Figure 2.SF.2. Financial Exposure of Advanced Economies to Emerging Market Economies 74 Figure 2.SF.3. Event Studies around Downturn Episodes in Emerging Market Economies 75 Figure 2.SF.4. Peak Efect of a Growth Shock to Emerging Market Economies on Advanced
Economies’ Output Growth 77
Figure 2.SF.5. Model Simulations of Potential Growth Spillover Efects from Emerging Market
Economies on Advanced Economies 78
Figure 3.1. Ten-Year Interest Rate on Government Bonds and Inlation 81
Figure 3.2. Real Interest Rate Comparison 84
Figure 3.3. Real Interest Rates, Real Returns on Equity, and Cost of Capital 85
Figure 3.4. Common Factors in Real Interest Rates 85
Figure 3.5. Real Interest Rate and Shifts in Demand for and Supply of Funds 87
Figure 3.6. Investment-to-GDP Ratios 88
Figure 3.7. Investment Shifts in Advanced Economies 89
Figure 3.10. Efect of U.S. Monetary Policy Shocks on Real Interest Rates 92 Figure 3.11. Real Long-Term Interest Rates and Real Returns on Equity 93 Figure 3.12. Portfolio Shifts and Relative Demand for Bonds versus Equity 94 Figure 3.13. Portfolio Shifts and Relative Riskiness of Bonds versus Equity, 1980–2013 94 Figure 3.14. Efect of Financial Crises on Saving- and Investment-to-GDP Ratios 95 Figure 3.15. Implications of Lower Real Interest Rates for Debt Sustainability 97
Figure 3.16. Investment Shifts in Advanced Economies 100
Figure 3.17. Global Long-Term Real Interest Rates 106
Figure 3.18. Convergence of Real Interest Rates in the Euro Area 106
Figure 3.1.1. Saving Rate and Accelerations (Decelerations) in GDP 109
Figure 3.1.2. Total Saving: Actual versus Conditional Forecasts 109
Figure 4.1. Growth Developments in Advanced and Emerging Market and Developing Economies 114
Figure 4.2. Average Country Rankings, 2000–12 118
Figure 4.3. Impulse Responses of Domestic Real GDP Growth to External Demand Shocks 120
Figure 4.4. Impulse Responses to External Financing Shock 120
Figure 4.5. Impulse Responses to U.S. High-Yield Spread Shock 121
Figure 4.6. Correlations between Growth Responses to External Shocks and Country-Speciic
Characteristics 122 Figure 4.7. Impulse Responses of Domestic Real GDP Growth to Terms-of-Trade Growth Shock 123 Figure 4.8. Historical Decompositions of Real GDP Growth into Internal and External Factors 124
Figure 4.9. Impulse Responses to Real GDP Growth Shock in China 125
Figure 4.10. Historical Decomposition of Real GDP Growth with China as an Explicit External Factor 127 Figure 4.11. Emerging Markets’ Output and Growth Performance after Global Recessions 129 Figure 4.12. Out-of-Sample Growth Forecasts Conditional on External Factors, by Country 131 Figure 4.13. Conditional Forecast and Actual Growth since the Global Financial Crisis, by Country 132 Figure 4.14. Domestic Real GDP Growth across Emerging Markets versus United States and China 136 Figure 4.15. Average Growth for Regional Groups of Emerging Market Economies 137
Figure 4.16. Impact of Prior Choice on Average Impulse Responses 139
Figure 4.17. Average Impulse Responses to Shocks from Alternative U.S. Monetary Policy Variables 140 Figure 4.18. Domestic Real GDP Growth Response to U.S. Federal Funds Rate and 10-Year
U.S. Treasury Bond Rate under Alternative Speciications 141
Figure 4.19. Average Impulse Responses to Alternative Measures of U.S. Monetary Policy Shock 142
Figure 4.20. Alternative Monetary Policy Shocks 142
Figure 4.21. Impulse Response of Domestic Real GDP Growth to External Financing Shocks 143 Figure 4.22. Average Impulse Responses of Domestic Real GDP Growth to Shocks under Alternative
Vector Autoregression Speciications 143
Figure 4.23. Brazil: Comparison of Responses under the Baseline Model with Responses from
Model with Sample Beginning in the First Quarter of 1995 144
Figure 4.24. Comparison of Impulse Responses from Panel Vector Autoregression with Responses
from the Baseline Model 144
Figure 4.1.1. Export Partner Growth Elasticity 147
Figure 4.1.2. Export Partner Growth 147
Note 7 in Figure 1.3 on page 4 has been corrected to remove Colombia from the list of upward pressure countries.
(April 10, 2014)
Panel 3 of Figure 4.2 (page 118) and panel 2 of Figure 4.6 (page 122) have been replaced to correct errors in the underlying data.
(April 11, 2014)
Panel 1 of Figure 1.3 has been revised to change the underlying data for the October 2013 WEO projections for the United States from overnight swap rates to federal funds rate futures.
(April 21, 2014)
In Statistical Table A15 on page 204, the irst instance of “Emerging and Developing Europe” has been cor- rected to read “Emerging and Developing Asia.”
A number of assumptions have been adopted for the projections presented in the World Economic Outlook (WEO). It has been assumed that real efective exchange rates remained constant at their average levels during January 31–Febru- ary 28, 2014, except for those for the currencies participating in the European exchange rate mechanism II (ERM II), which are assumed to have remained constant in nominal terms relative to the euro; that established policies of national authorities will be maintained (for speciic assumptions about iscal and monetary policies for selected economies, see Box A1 in the Statistical Appendix); that the average price of oil will be $104.17 a barrel in 2014 and $97.92 a barrel in 2015 and will remain unchanged in real terms over the medium term; that the six-month London interbank ofered rate (LIBOR) on U.S. dollar deposits will average 0.4 percent in 2014 and 0.8 percent in 2015; that the three-month euro deposit rate will average 0.3 percent in 2014 and 0.4 percent in 2015; and that the six-month Japanese yen deposit rate will yield on average 0.2 percent in 2014 and 2015. hese are, of course, working hypotheses rather than forecasts, and the uncertainties surrounding them add to the margin of error that would in any event be involved in the projections. he estimates and projections are based on statistical information available generally through March 24, 2014.
he following conventions are used throughout the WEO: . . . to indicate that data are not available or not applicable;
– between years or months (for example, 2013–14 or January–June) to indicate the years or months cov- ered, including the beginning and ending years or months;
/ between years or months (for example, 2013/14) to indicate a iscal or inancial year.
“Billion” means a thousand million; “trillion” means a thousand billion.
“Basis points” refer to hundredths of 1 percentage point (for example, 25 basis points are equivalent to ¼ of 1 percentage point).
For some countries, the igures for 2013 and earlier are based on estimates rather than actual outturns.
Data refer to calendar years, except in the case of a few countries that use iscal years. Please refer to Table F in the Statistical Appendix, which lists the reference periods for each country.
Projections for Ukraine are excluded due to the ongoing crisis.
he consumer price projections for Argentina are excluded because of a structural break in the data. Please refer to note 6 in Table A7 for further details.
Korea’s real GDP series is based on the reference year 2005. his does not relect the revised national accounts released on March 26, 2014, after the WEO was inalized for publication. hese comprehensive revisions include implementing the 2008 System of National Accounts and updating the reference year to 2010. As a result of these revisions, real GDP growth in 2013 was revised up to 3 percent from 2.8 percent (which is the igure included in Tables 2.3 and A2).
On January 1, 2014, Latvia became the 18th country to join the euro area. Data for Latvia are not included in the euro area aggregates, because the database has not yet been converted to euros, but are included in data aggre- gated for advanced economies.
Starting with the April 2014 WEO, the Central and Eastern Europe and Emerging Europe regions have been renamed Emerging and Developing Europe. he Developing Asia region has been renamed Emerging and Devel- oping Asia.
Cape Verde is now called Cabo Verde.
As in the October 2013 WEO, data for Syria are excluded for 2011 onward because of the uncertain political situation.
If no source is listed on tables and igures, data are drawn from the WEO database. When countries are not listed alphabetically, they are ordered on the basis of economic size. Minor discrepancies between sums of constituent igures and totals shown relect rounding.
As used in this report, the terms “country” and “economy” do not in all cases refer to a territorial entity that is a state as understood by international law and practice. As used here, the term also covers some territorial entities that are not states but for which statistical data are maintained on a separate and independent basis.
Composite data are provided for various groups of countries organized according to economic characteristics or region. Unless noted otherwise, country group composites represent calculations based on 90 percent or more of the weighted group data.
he boundaries, colors, denominations, and any other information shown on the maps do not imply, on the part of the International Monetary Fund, any judgment on the legal status of any territory or any endorsement or acceptance of such boundaries.
his version of the World Economic Outlook (WEO) is available in full through the IMF eLibrary (www.elibrary. imf.org) and the IMF website (www.imf.org). Accompanying the publication on the IMF website is a larger com- pilation of data from the WEO database than is included in the report itself, including iles containing the series most frequently requested by readers. hese iles may be downloaded for use in a variety of software packages.
he data appearing in the World Economic Outlook are compiled by the IMF staf at the time of the WEO exer- cises. he historical data and projections are based on the information gathered by the IMF country desk oicers in the context of their missions to IMF member countries and through their ongoing analysis of the evolving situ- ation in each country. Historical data are updated on a continual basis as more information becomes available, and structural breaks in data are often adjusted to produce smooth series with the use of splicing and other techniques. IMF staf estimates continue to serve as proxies for historical series when complete information is unavailable. As a result, WEO data can difer from those in other sources with oicial data, including the IMF’s International Financial Statistics.
he WEO data and metadata provided are “as is” and “as available,” and every efort is made to ensure, but not guarantee, their timeliness, accuracy, and completeness. When errors are discovered, there is a concerted efort to correct them as appropriate and feasible. Corrections and revisions made after publication are incorporated into the electronic editions available from the IMF eLibrary (www.elibrary.imf.org) and on the IMF website (www.imf.org). All substantive changes are listed in detail in the online tables of contents.
For details on the terms and conditions for usage of the WEO database, please refer to the IMF Copyright and Usage website (www.imf.org/external/terms.htm).
Inquiries about the content of the World Economic Outlook and the WEO database should be sent by mail, fax, or online forum (telephone inquiries cannot be accepted):
World Economic Studies Division Research Department International Monetary Fund
700 19th Street, N.W. Washington, DC 20431, U.S.A.
Fax: (202) 623-6343
Online Forum: www.imf.org/weoforum
he analysis and projections contained in the World Economic Outlook are integral elements of the IMF’s surveil- lance of economic developments and policies in its member countries, of developments in international inancial markets, and of the global economic system. he survey of prospects and policies is the product of a comprehen- sive interdepartmental review of world economic developments, which draws primarily on information the IMF staf gathers through its consultations with member countries. hese consultations are carried out in particular by the IMF’s area departments—namely, the African Department, Asia and Paciic Department, European Depart- ment, Middle East and Central Asia Department, and Western Hemisphere Department—together with the Strategy, Policy, and Review Department; the Monetary and Capital Markets Department; and the Fiscal Afairs Department.
he analysis in this report was coordinated in the Research Department under the general direction of Olivier Blanchard, Economic Counsellor and Director of Research. he project was directed by homas Helbling, Divi- sion Chief, Research Department, and Jörg Decressin, Deputy Director, Research Department.
he primary contributors to this report are Abdul Abiad, Aseel Almansour, Aqib Aslam, Samya Beidas-Strom, John Bluedorn, Rupa Duttagupta, Davide Furceri, Andrea Pescatori, Marco E. Terrones, and Juan Yepez Albornoz.
Other contributors include Ali Alichi, Angana Banerji, Benjamin Beckers, Alberto Behar, Sami Ben Naceur, Patrick Blagrave, Kevin Clinton, Alexander Culiuc, Joshua Felman, Emilio Fernandez Corugedo, Roberto Garcia- Saltos, Roberto Guimarães-Filho, Keiko Honjo, Benjamin Hunt, Dora Iakova, Deniz Igan, Gregorio Impavido, Zoltan Jakab, Douglas Laxton, Lusine Lusinyan, Andre Meier, Pritha Mitra, Dirk Muir, Jean-Marc Natal, Marco Pani, Mahvash Qureshi, Jesmin Rahman, Marina Rousset, Damiano Sandri, John Simon, Serhat Solmaz, Shane Streifel, Yan Sun, Li Tang, Boqun Wang, and Shengzu Wang.
Gohar Abajyan, Gavin Asdorian, Shan Chen, Tingyun Chen, Angela Espiritu, Madelyn Estrada, Sinem Kilic Celik, Mitko Grigorov, Cleary A. Haines, Pavel Lukyantsau, Olivia Ma, Tim Mahedy, Anayo Osueke, Katherine Pan, Sidra Rehman, Daniel Rivera Greenwood, Carlos Rondon, Yang Yang, and Fan Zhang provided research assistance. Luis Cubeddu provided comments and suggestions. Mahnaz Hemmati, Toh Kuan, Emory Oakes, and Richard Watson provided technical support. Skeeter Mathurin and Anduriña Espinoza-Wasil were responsible for word processing. Linda Griin Kean and Michael Harrup of the Communications Department edited the manu- script and coordinated production of the publication with assistance from Lucy Scott Morales and Sherrie Brown. he Core Data Management team from the IMF’s IT department and external consultant Pavel Pimenov provided additional technical support.
he analysis has beneited from comments and suggestions by staf members from other IMF departments, as well as by Executive Directors following their discussion of the report on March 21, 2014. However, both projec- tions and policy considerations are those of the IMF staf and should not be attributed to Executive Directors or to their national authorities.
T
he dynamics that were emerging at the time of the October 2013 World Economic Outlook are becoming more visible:he recovery then starting to take hold in advanced economies is becoming broader. Fiscal consolidation is slowing, and investors are less wor- ried about debt sustainability. Banks are gradually becoming stronger. Although we are far short of a full recovery, the normalization of monetary policy—both conventional and unconventional—is now on the agenda.
hese dynamics imply a changing environment for emerging market and developing economies. Stron- ger growth in advanced economies implies increased demand for their exports. he normalization of mon- etary policy, however, implies tighter inancial condi- tions and a tougher inancial environment. Investors will be less forgiving, and macroeconomic weaknesses will become more costly.
Acute risks have decreased, but risks have not disappeared. In the United States, the recovery seems solidly grounded. In Japan, Abenomics still needs to translate into stronger domestic private demand for the recovery to be sustained. Adjustment in the south of Europe cannot be taken for granted, especially if Euro wide inlation is low. As discussed in the April 2014 Global Financial Stability Report, inancial reform is incomplete, and the inancial system remains at risk. Geopolitical risks have arisen, although they have not yet had global macroeco- nomic repercussions.
Looking ahead, the focus must increasingly turn to the supply side:
Potential growth in many advanced economies is very low. his is bad on its own, but it also makes iscal adjustment more diicult. In this context, measures to increase potential growth are becoming more important—from rethinking the shape of labor market institutions, to increasing competition and productivity in a number of nontradables sectors, to rethinking the size of the government, to examining the role of public investment.
Although the evidence is not yet clear, potential growth in many emerging market economies also appears to have decreased. In some countries, such as China, this may be in part a desirable byproduct of more balanced growth. In others, there is clearly scope for some structural reforms to improve the outcome.
Finally, as the efects of the inancial crisis slowly diminish, another trend may come to dominate the scene, namely, increased income inequality. hough inequality has always been perceived to be a central issue, until recently it was not believed to have major implications for macroeconomic developments. his belief is increasingly called into question. How inequality afects both the macroeconomy and the design of macroeconomic policy will likely be increas- ingly important items on our agenda.
Olivier Blanchard Economic Counsellor
G
lobal activity has broadly strengthened and is expected to improve further in 2014–15, with much of the impetus coming from advanced economies. Inlation in these economies, however, has undershot projections, relecting still-large output gaps and recent commod- ity price declines. Activity in many emerging market economies has disappointed in a less favorable external inancial environment, although they continue to contribute more than two-thirds of global growth. heir output growth is expected to be lifted by stron- ger exports to advanced economies. In this setting, downside risks identiied in previous World Economic Outlook reports have diminished somewhat. here are three caveats: emerging market risks have increased, there are risks to activity from lower-than-expected inlation in advanced economies, and geopolitical risks have resurfaced. Overall, the balance of risks, while improved, remains on the downside.he renewed increase in inancial volatility in late January of this year highlights the challenges for emerging market economies posed by the changing external environment. he proximate cause seems to have been renewed market concern about emerging market fundamentals. Although market pressures were relatively broadly based, countries with higher inlation and wider current account deicits were generally more afected. Some of these weaknesses have been present for some time, but with prospects of improved returns in advanced economies, investor sentiment is now less favorable toward emerging market risks. In view of pos- sible capital low reversals, risks related to sizable external funding needs and disorderly currency depreciations are a concern. Some emerging market economies have tight- ened macroeconomic policies to shore up conidence and strengthen their commitment to policy objectives. Overall, inancial conditions have tightened further in some emerging market economies compared with the October 2013 World Economic Outlook. he cost of capital has increased as a result, and this is expected to dampen investment and weigh on growth.
Looking ahead, global growth is projected to strengthen from 3 percent in 2013 to 3.6 percent in
2014 and 3.9 percent in 2015, broadly unchanged from the October 2013 outlook. In advanced economies, growth is expected to increase to about 2¼ percent in 2014–15, an improvement of about 1 percentage point compared with 2013. Key drivers are a reduction in iscal tightening, except in Japan, and still highly accommodative monetary condi- tions. Growth will be strongest in the United States at about 2¾ percent. Growth is projected to be positive but varied in the euro area: stronger in the core, but weaker in countries with high debt (both private and public) and inancial fragmentation, which will both weigh on domestic demand. In emerging market and developing economies, growth is projected to pick up gradually from 4.7 percent in 2013 to about 5 percent in 2014 and 5¼ percent in 2015. Growth will be helped by stronger external demand from advanced economies, but tighter inancial conditions will dampen domestic demand growth. In China, growth is projected to remain at about 7½ percent in 2014 as the authorities seek to rein in credit and advance reforms while ensuring a gradual transition to a more balanced and sustainable growth path.
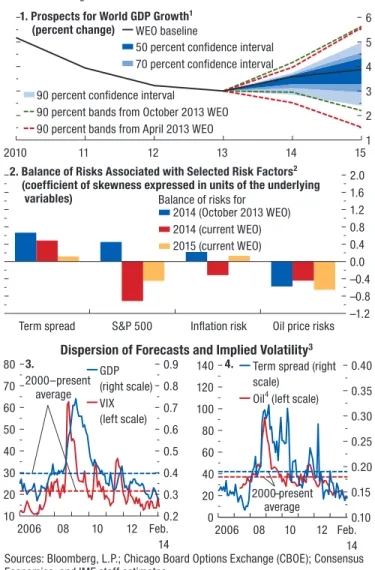
he global recovery is still fragile despite improved prospects, and signiicant downside risks—both old and new—remain. Recently, some new geopolitical risks have emerged. On old risks, those related to emerging market economies have increased with the changing external environment. As highlighted in the April 2014 Global Financial Stability Report, unexpect- edly rapid normalization of U.S. monetary policy or renewed bouts of high risk aversion on the part of investors could result in further inancial turmoil. his would lead to diicult adjustments in some emerg- ing market economies, with a risk of contagion and broad-based inancial stress, and thus lower growth. In advanced economies, risks to activity associated with very low inlation have come to the fore, espe- cially in the euro area, where large output gaps have contributed to low inlation. With inlation likely to remain below target for some time, longer-term inla- tion expectations might drift down, leading to even lower inlation than is currently expected, or possibly
to delation if other downside risks to activity mate- rialize. he result would be higher real interest rates, an increase in private and public debt burdens, and weaker demand and output.
he strengthening of the recovery from the Great Recession in the advanced economies is a welcome development. But growth is not evenly robust across the globe, and more policy eforts are needed to fully restore conidence, ensure robust growth, and lower downside risks.
Policymakers in advanced economies need to avoid a premature withdrawal of monetary accom- modation. In an environment of continued iscal consolidation, still-large output gaps, and very low inlation, monetary policy should remain accommoda- tive. In the euro area, more monetary easing, includ- ing unconventional measures, is necessary to sustain activity and help achieve the European Central Bank’s price stability objective, thus lowering risks of even lower inlation or outright delation. Sustained low inlation would not likely be conducive to a suitable recovery of economic growth. In Japan, implementa- tion of the remaining two arrows of Abenomics— structural reform and plans for iscal consolidation beyond 2015—is essential to achieve the inlation target and higher sustained growth. he need for credible medium-term iscal plans, however, extends beyond Japan. he April 2014 Fiscal Monitor high- lights that the combination of large public debt stocks and the absence of medium-term adjustment plans that include speciic measures and strong entitlement reforms is the main factor behind important medium- term iscal risks in advanced economies, including in the United States. In the euro area, repairing bank balance sheets in the context of a credible asset quality review and recapitalizing weak banks will be critical if conidence is to improve and credit is to revive. Also essential for achieving these goals is progress on com- pleting the banking union—including an independent Single Resolution Mechanism with the capacity to
undertake timely bank resolution and common back- stops to sever the link between sovereigns and banks. More structural reforms are needed to lift investment and activity prospects.
Emerging market economies will have to weather turbulence and maintain high medium-term growth. he appropriate policy measures will difer across these economies. However, many of them have some policy priorities in common. First, policymakers should allow exchange rates to respond to changing fundamentals and facilitate external adjustment. Where international reserves are adequate, foreign exchange interventions can be used to smooth volatility and avoid inancial disruption. Second, in economies in which inlation is still relatively high or the risks that recent currency depreciation could feed into underlying inlation are high, further monetary policy tightening may be neces- sary. If policy credibility is a problem, strengthening the transparency and consistency of policy frameworks may be necessary for tightening to be efective. hird, on the iscal front, policymakers must lower budget deicits, although the urgency for action varies across economies. Early steps are required if public debt is already elevated and the associated reinancing needs are a source of vulnerability. Fourth, many economies need a new round of structural reforms that include investment in public infrastructure, removal of bar- riers to entry in product and services markets, and in China, rebalancing growth away from investment toward consumption.
Low-income countries will need to avoid a buildup of external and public debt. Many of these countries have succeeded in maintaining strong growth, partly relecting better macroeconomic policies, but their external environment has also been changing. Foreign direct investment has started to moderate with declin- ing commodity prices, and commodity-related budget revenues and foreign exchange earnings are at risk. Timely policy adjustments will be important to avoid a buildup in external debt and public debt.
1
Global activity strengthened during the second half of 2013 and is expected to improve further in 2014–15. The impulse has come mainly from advanced economies, although their recoveries remain uneven. With supportive monetary conditions and a smaller drag from fiscal con- solidation, annual growth is projected to rise above trend in the United States and to be close to trend in the core euro area economies. In the stressed euro area economies, however, growth is projected to remain weak and fragile as high debt and financial fragmentation hold back domes- tic demand. In Japan, fiscal consolidation in 2014–15 is projected to result in some growth moderation. Growth in emerging market economies is projected to pick up only modestly. These economies are adjusting to a more difficult external financial environment in which international investors are more sensitive to policy weakness and vulner- abilities given prospects for better growth and monetary pol- icy normalization in some advanced economies. As a result, financial conditions in emerging market economies have tightened further compared with the October 2013 World Economic Outlook (WEO), while they have been broadly stable in advanced economies. Downside risks continue to dominate the global growth outlook, notwithstanding some upside risks in the United States, the United Kingdom, and Germany. In advanced economies, major concerns include downside risks from low inflation and the possibil- ity of protracted low growth, especially in the euro area and Japan. While output gaps generally remain large, the monetary policy stance should stay accommodative, given continued fiscal consolidation. In emerging market econo- mies, vulnerabilities appear mostly localized. Nevertheless, a still-greater general slowdown in these economies remains a risk, because capital inflows could slow or reverse. Emerging market and developing economies must therefore be ready to weather market turmoil and reduce external vulnerabilities.
The Demand and Activity Perspective
Global growth picked up in the second half of 2013, averaging 3⅔ percent—a marked uptick from the 2⅔ percent recorded during the previous six months.
Advanced economies accounted for much of the pickup, whereas growth in emerging markets increased only modestly (Figure 1.1, panel 2). h e strengthening in activity was mirrored in global trade and industrial production (Figure 1.1, panel 1).
h e latest incoming data suggest a slight modera- tion in global growth in the i rst half of 2014. h e stronger-than-expected acceleration in global activity in the latter part of 2013 was partly driven by increases in inventory accumulation that will be reversed. Overall, however, the outlook remains broadly the same as in the October 2013 WEO: global growth is projected to strengthen to 3.6 percent in 2014 and then to increase further to 3.9 percent in 2015 (Table 1.1).
• A major impulse to global growth has come from the United States, whose economy (Figure 1.2, panel 1) grew at 3¼ percent in the second half of 2013— stronger than expected in the October 2013 WEO. Some of the upside surprise was due to strong export growth and temporary increases in inventory demand. Recent indicators suggest some slowing in early 2014. Much of this seems related to unusually bad weather, although some payback from previous inventory demand increases may also be contribut- ing. Nevertheless, annual growth in 2014–15 is projected to be above trend at about 2¾ percent (Table 1.1). More moderate fiscal consolidation helps; it is estimated that the change in the primary structural balance will decline from slightly more than 2 percent of GDP in 2013 to about ½ percent in 2014–15. Support also comes from accommoda- tive monetary conditions as well as from a real estate sector that is recovering after a long slump (Figure 1.3, panel 5), higher household wealth (Figure 1.3, panel 3), and easier bank lending conditions.
• In the euro area, growth has turned positive. In Germany, supportive monetary conditions, robust labor market conditions, and improving confidence have underpinned a pickup in domestic demand, reflected mainly in higher consumption and a tenta- tive revival in investment but also in housing. Across
(Percent change unless noted otherwise)
Year over Year
Difference from January 2014 WEO
Update
Q4 over Q4
Projections Estimates Projections
2012 2013 2014 2015 2014 2015 2013 2014 2015
World Output1 3.2 3.0 3.6 3.9 –0.1 –0.1 3.3 3.6 3.7
Advanced Economies 1.4 1.3 2.2 2.3 0.0 0.0 2.1 2.1 2.4
United States 2.8 1.9 2.8 3.0 0.0 0.0 2.6 2.7 3.0
Euro Area2 –0.7 –0.5 1.2 1.5 0.1 0.1 0.5 1.3 1.5
Germany 0.9 0.5 1.7 1.6 0.2 0.1 1.4 1.6 1.7
France 0.0 0.3 1.0 1.5 0.1 0.0 0.8 1.2 1.6
Italy –2.4 –1.9 0.6 1.1 0.0 0.0 –0.9 0.7 1.4
Spain –1.6 –1.2 0.9 1.0 0.3 0.2 –0.2 1.1 0.9
Japan 1.4 1.5 1.4 1.0 –0.3 0.0 2.5 1.2 0.5
United Kingdom 0.3 1.8 2.9 2.5 0.4 0.3 2.7 3.0 1.9
Canada 1.7 2.0 2.3 2.4 0.1 0.0 2.7 2.1 2.4
Other Advanced Economies3 1.9 2.3 3.0 3.2 0.1 0.0 2.9 2.7 3.6
Emerging Market and Developing Economies4 5.0 4.7 4.9 5.3 –0.2 –0.1 4.8 5.2 5.3
Commonwealth of Independent States 3.4 2.1 2.3 3.1 –0.3 0.1 1.3 2.0 2.5
Russia 3.4 1.3 1.3 2.3 –0.6 –0.2 1.1 1.6 2.5
Excluding Russia 3.3 3.9 5.3 5.7 1.2 1.4 . . . . . . . . .
Emerging and Developing Asia 6.7 6.5 6.7 6.8 0.0 0.0 6.4 6.7 6.8
China 7.7 7.7 7.5 7.3 0.0 0.0 7.7 7.6 7.2
India5 4.7 4.4 5.4 6.4 0.0 0.0 4.7 5.7 6.5
ASEAN-56 6.2 5.2 4.9 5.4 –0.2 –0.2 . . . . . . . . .
Emerging and Developing Europe 1.4 2.8 2.4 2.9 –0.5 –0.2 3.6 2.5 2.9
Latin America and the Caribbean 3.1 2.7 2.5 3.0 –0.4 –0.3 1.9 3.1 2.5
Brazil 1.0 2.3 1.8 2.7 –0.5 –0.2 1.9 2.0 2.9
Mexico 3.9 1.1 3.0 3.5 0.0 0.0 0.6 4.5 2.4
Middle East, North Africa, Afghanistan, and Pakistan 4.2 2.4 3.2 4.4 –0.1 –0.4 . . . . . . . . .
Sub-Saharan Africa 4.9 4.9 5.4 5.5 –0.7 –0.3 . . . . . . . . .
South Africa 2.5 1.9 2.3 2.7 –0.5 –0.6 2.1 2.1 3.0
Memorandum
European Union –0.3 0.2 1.6 1.8 0.2 0.1 1.1 1.7 1.7
Low-Income Developing Countries 5.7 6.1 6.3 6.5 –0.3 0.1 . . . . . . . . .
Middle East and North Africa 4.1 2.2 3.2 4.5 –0.2 –0.5 . . . . . . . . .
World Growth Based on Market Exchange Rates 2.5 2.4 3.1 3.3 0.0 0.0 2.8 3.0 3.2
World Trade Volume (goods and services) 2.8 3.0 4.3 5.3 –0.1 0.1 . . . . . . . . .
Imports
Advanced Economies 1.1 1.4 3.5 4.5 0.1 0.3 . . . . . . . . .
Emerging Market and Developing Economies 5.8 5.6 5.2 6.3 –0.7 –0.1 . . . . . . . . .
Exports
Advanced Economies 2.1 2.3 4.2 4.8 0.2 0.1 . . . . . . . . .
Emerging Market and Developing Economies 4.2 4.4 5.0 6.2 –0.4 –0.1 . . . . . . . . .
Commodity Prices (U.S. dollars)
Oil7 1.0 –0.9 0.1 –6.0 0.4 –0.8 2.6 –2.3 –6.3
Nonfuel (average based on world commodity export weights) –10.0 –1.2 –3.5 –3.9 2.7 –1.5 –3.0 –3.2 –3.0
Consumer Prices
Advanced Economies 2.0 1.4 1.5 1.6 –0.2 –0.1 1.2 1.6 1.7
Emerging Market and Developing Economies4 6.0 5.8 5.5 5.2 –0.2 –0.1 5.3 5.1 4.7
London Interbank Offered Rate (percent)
On U.S. Dollar Deposits (six month) 0.7 0.4 0.4 0.8 0.0 0.3 . . . . . . . . .
On Euro Deposits (three month) 0.6 0.2 0.3 0.4 –0.1 –0.2 . . . . . . . . .
On Japanese Yen Deposits (six month) 0.3 0.2 0.2 0.2 0.0 0.0 . . . . . . . . .
Note: Real effective exchange rates are assumed to remain constant at the levels prevailing during January 31–February 28, 2014. When economies are not listed alphabetically, they are ordered on the basis of economic size. The aggregated quarterly data are seasonally adjusted. Projections for Ukraine are excluded in the April 2014 WEO due to the ongoing crisis but were included in the January 2014 WEO Update. Latvia is included in the advanced economies; in the January 2014 WEO Update, it was included in the emerging and developing economies.
1The quarterly estimates and projections account for 90 percent of the world purchasing-power-parity weights.
2Excludes Latvia.
3Excludes the G7 (Canada, France, Germany, Italy, Japan, United Kingdom, United States) and euro area countries but includes Latvia.
4The quarterly estimates and projections account for approximately 80 percent of the emerging market and developing economies.
5For India, data and forecasts are presented on a fiscal year basis and output growth is based on GDP at market prices. Corresponding growth forecasts for GDP at factor cost are 4.6, 5.4, and 6.4 percent for 2013, 2014, and 2015, respectively.
6Indonesia, Malaysia, Philippines, Thailand, Vietnam.
0.0 0.5 1.0 1.5 2.0 2.5 3.0 3.5 4.0
2010: H1
11:H1 12:H1 13:H1 14:H1 15: H2
–5 0 5 10 15 20 25
2010 11 12 13 Feb.
14 1. World Trade, Industrial Production, and Manufacturing PMI
(three-month moving average; annualized percent change)
October 2013 WEO April 2014 WEO Advanced Economies
4.0 4.5 5.0 5.5 6.0 6.5 7.0 7.5 8.0 8.5
2010: H1
11:H1 12:H113:H114:H1 15: H2 Emerging Market and Developing Economies 4. GDP Growth
(annualized semiannual percent change) –3
–2 –1 0 1 2 3 4 5
2012 13 Feb.
14 2. Manufacturing PMI
(deviations from 50; three- month moving average)
–6 –3 0 3 6 9 12 15
2012 13 Jan.
14 3. Industrial Production
(three-month moving average; annualized percent change) Advanced economies1
Emerging market economies2
Advanced economies1 Emerging market economies2 Manufacturing PMI (deviations from 50) Industrial production
World trade volumes
Sources: CPB Netherlands Bureau for Economic Policy Analysis; Haver Analytics; Markit Economics; and IMF staff estimates.
Note: IP = industrial production; PMI = purchasing managers’ index.
1Australia, Canada, Czech Republic, Denmark, euro area, Hong Kong SAR (IP only), Israel, Japan, Korea, New Zealand, Norway (IP only), Singapore, Sweden (IP only), Switzerland, Taiwan Province of China, United Kingdom, United States.
2Argentina (IP only), Brazil, Bulgaria (IP only), Chile (IP only), China, Colombia (IP only), Hungary, India, Indonesia, Latvia (IP only), Lithuania, Malaysia (IP only), Mexico, Pakistan (IP only), Peru (IP only), Philippines (IP only), Poland, Romania (IP only), Russia, South Africa, Thailand (IP only), Turkey, Ukraine (IP only), Global activity strengthened in the second half of 2013, as did world trade, but the pickup was uneven: broad based in advanced economies, but mixed in emerging market economies. Although export growth improved, domestic demand growth remained mostly unchanged.
–4 –2 0 2 4 6 8 10 12
2010 11 12 13 14 15:
Q4 –2 0 2 4 6 8 10 12 14
2010 11 12 13 14 15:
Q4 –4 –2 0 2 4 6 8
2010 11 12 13 14 15:
Q4 –4
–2 0 2 4 6 8
–8 –4 0 4 8 12 16
2010 11 12 13 14 15:
Q4 1. United States and Japan
2. Euro Area
Source: IMF staff estimates. 3. Emerging and Developing Asia
4. Latin America and the Caribbean
United States (left scale) Japan (right scale)
Euro area
France and Germany Spain and Italy
Emerging and developing Asia China
India
Latin America and the Caribbean Brazil
Mexico
Advanced economies (left scale)
Growth in advanced economies is projected to strengthen moderately in 2014–15, building up momentum from the gains in 2013. Growth in the United States will remain above trend, and growth in Japan is expected to moderate, mostly as the result of a modest fiscal drag. Among emerging market economies, growth is projected to remain robust in emerging and developing Asia and to recover somewhat in Latin America and the Caribbean.
tightening from about 1 percent of GDP in 2013 to ¼ percent of GDP is expected to help lift growth (Figure 1.4, panel 1). Outside the core, contribu- tions from net exports have helped the turnaround, as has the stabilization of domestic demand.
• However, growth in demand is expected to remain sluggish, given continued financial fragmentation, tight credit (see Figure 1.3, panel 2), and a high corporate debt burden. As discussed in Box 1.1, past credit supply shocks in some economies have not yet fully reversed and are still weighing on credit and growth. Credit demand is also weak, however, because of impaired corporate balance sheets. Overall, economic growth in the euro area is projected to reach only 1.2 percent in 2014 and 1½ percent in 2015.
• In Japan, some underlying growth drivers are expected to strengthen, notably private invest- ment and exports, given increased partner country growth and the substantial yen depreciation over the past 12 months or so. Nevertheless, activity overall is projected to slow moderately in response to a tightening fiscal policy stance in 2014–15. The tightening is the result of a two-step increase in the consumption tax rate—to 8 percent from 5 per- cent in the second quarter of 2014 and then to 10 percent in the fourth quarter of 2015—and to the unwinding of reconstruction spending and the first stimulus package of the Abenomics program. How- ever, at about 1 percent of GDP, the tightening of the fiscal policy stance in 2014 will be more moder- ate than was expected in the October 2013 WEO, as a result of new fiscal stimulus amounting to about 1 percent of GDP. This stimulus is projected to lower the negative growth impact of the tighten- ing by 0.4 percentage point to 0.3 percent of GDP in 2014. In 2015, the negative growth effect of the fiscal stance is projected to increase to ½ percent of GDP. Overall, growth is projected to be 1.4 percent in 2014 and 1.0 percent in 2015.
In emerging market and developing economies, growth picked up slightly in the second half of 2013. he weaker cyclical momentum in comparison with that in the advanced economies relects the opposite efects of two forces on growth. On one hand, export growth increased, lifted by stronger activity in advanced economies and by currency depreciation. Fiscal policies are projected to be broadly neutral (see Figure 1.4, panel 1). On the other hand, investment weakness continued, and external funding and domestic inancial conditions increasingly
60 80 100 120 140 160 180
2000 02 04 06 08 10 13: Q3
0 10 20 30 40 50
2007 08 09 10 11 12 Mar. 14 450
500 550 600 650 700 750 800
2000 02 04 06 08 10 13: Q3 3. Household Net-Worth-to-
Income Ratio
–10 –5 0 5 10 15 20
2006 07 08 09 10 11 12 13: Q4 2. Nonfinancial Firm and
Household Credit Growth2 (year-over-year percent change)
5. Real House Price Indices (2000 = 100)
6. Central Bank Total Assets (percent of 2008 GDP)
60 70 80 90 100 110 120 130 140
2000 02 04 06 08 10 13: Q4 4. Household Debt-to-Income
Ratio
Euro area United States
United States Euro area
Fed ECB8
BOJ
Japan Advanced economies experiencing upward pressure7
United States EA stressed economies6
Euro area4 Japan EA core5 United States
Euro area Japan3
Italy Spain
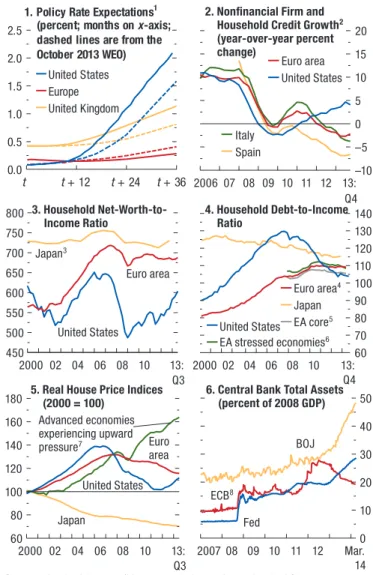
Monetary conditions have remained broadly supportive in advanced economies, but more so in the United States than in the euro area or Japan. Policy rates remain close to the zero lower bound, but they are expected to rise beginning in 2015, especially in the United States, where household net worth and house prices have recovered. Household debt has broadly stabilized in the euro area relative to disposable income, and it has declined markedly in the United States. Credit to the nonfinancial private sector in the euro area has continued to decline, reflecting tight lending standards and weak demand.
Figure 1.3. Monetary Conditions in Advanced Economies
Sources: Bank of America/Merrill Lynch; Bank of Italy; Bank of Spain; Bloomberg, L.P.; Haver Analytics; Organization for Economic Cooperation and Development; and IMF staff calculations.
Note: BOJ = Bank of Japan; EA = euro area; ECB = European Central Bank; Fed = Federal Reserve.
1Expectations are based on the federal funds rate futures for the United States, the sterling overnight interbank average rate for the United Kingdom, and the euro interbank offered forward rate for Europe; updated March 26, 2014.
2Flow-of-funds data are used for the euro area, Spain, and the United States. Italian bank loans to Italian residents are corrected for securitizations.
3Interpolated from annual net worth as a percent of disposable income.
4Euro area includes subsector employers (including own-account workers).
5Austria, France, Germany, Netherlands, Slovenia. Loans are used for the Netherlands to calculate the ratio.
6Greece, Ireland, Italy, Portugal, Spain.
7Upward pressure countries: Australia, Austria, Belgium, Canada, Hong Kong SAR, Israel, Norway, Singapore, Sweden, Switzerland.
8ECB calculations are based on the Eurosystem’s weekly financial statement. 0.0
0.5 1.0 1.5 2.0 2.5
t t+ 12 t+ 24 t+ 36 1. Policy Rate Expectations1
(percent; months on x -axis; dashed lines are from the October 2013 WEO)
United States Europe United Kingdom