Development of flat-field EUV spectrometers
with absolute calibration and
study of impurity behavior in edge plasmas
on LHD
Malay Bikas Chowdhuri
Doctor of Philosophy
Department of Fusion Science
School of Physical Sciences
The Graduate University for Advanced Studies
2008
Abstract
Impurity control is one of crucial problems to be solved in fusion research. The extreme ultraviolet (EUV) spectroscopy gives a major diagnostic technique to monitor and study the impurity behavior in magnetically confined fusion plasmas. For the purpose, two flat-field EUV spectrometers for impurity diagnostics in 10−130 and 50−500Å ranges have been developed with varied-line-spacing (VLS) laminar-type holographic gratings. The spectral characteristics obtained from the holographic gratings were compared with ones from conventional ruled gratings and excellent property was found in the holographic gratings, i.e., negligibly low level of stray light and higher-order emission intensity. The EUV spectrometers have been absolutely calibrated using a new technique based on the combination of EUV bremsstrahlung and branching ratio. EUV spectra have been thus successfully observed from high-temperature plasmas in Large Helical Device (LHD) and several EUV line emissions of Ti, Fe, Mo and W have been analyzed and identified in detailed for the purpose of further development of the impurity diagnostics.
The edge impurity transport in intrinsically existing ergodic layer of LHD, where the transport parallel to magnetic fields is relatively dominant, has been studied through the observation of carbon emissions. Four resonance transitions of CIII (977Å: 2s2p
1P1−2s2 1S0), CIV (1548Å: 2p 2P−2s 2S), CV (40.27Å: 1s2p 1P1−1s2 1S0) and CVI (33.73Å: 2p 2P−1s 2S) have been observed with the EUV spectrometers and 20cm normal incidence VUV spectrometers. The ratio of CV+CVI to CIII+CIV has been analyzed in a variety of magnetic configurations and plasma parameters. The impurity screening was evidently observed and the physical mechanism on the impurity transport given by the edge stochastic magnetic fields has been discussed with the thermal force and friction force. The modeling of the edge impurity transport with EMC3+EIRENE simulation code strongly suggests the importance of the friction force for the enhancement of the impurity screening. The density dependence of the measured ratio indicating the impurity screening effect is in good agreement with the modeling result.
Contents
1. Introduction...1
1.1. Impurity in nuclear fusion research...1
1.2. EUV spectroscopy...2
1.3. Motivation of the present study...4
1.4. LHD and relevant diagnostics...6
References...11
2. Development of EUV spectrometers and their calibration...13
2.1. Spectrometer for 50-500Å (EUV_Long)...13
2.1.1. Introduction...13
2.1.2. Details on 1200grooves/mm flat-field EUV spectrometer...14
2.1.3. Comparison between ruled and holographic gratings...21
2.1.4. Absolute intensity calibration...25
2.1.5. Summary...29
2.2. Spectrometer for 10-130Å (EUV_Short)...31
2.2.1. Introduction...31
2.2.2. Details on 2400grooves/mm flat-field EUV spectrometer...32
2.2.3. Comparison between ruled and holographic gratings...36
2.2.4. Absolute intensity calibration...42
2.2.5. Summary...46
2.3. Spectroscopic evaluation on a ruled and two holographic gratings to monitor 10-30Å...47
2.3.1. Introduction...47
2.3.2. Comparative studies on a ruled and two holographic gratings...49
2.3.3. Summary...53
2.4. Comparison between 1200 and 2400grooves/mm gratings...54
References...57
3. EUV spectra and line analysis...59
3.1. Details on high-Z Mo and W spectra observed by EUV_Long...59
3.1.1. Introduction...59
3.1.2. Experimental setup...60
3.1.3. EUV spectra and analysis...61
3.1.3.1. Molybdenum...61
3.1.3.2. Tungsten...66
3.1.4. Summary...68
3.2. Details on low- and medium-Z spectra observed by EUV_Short...69
References...76
4. Analysis on carbon behavior in LHD...77
4.1. CIII to CVI behaviors during recombining phase...77
4.1.1. Introduction...77
4.1.2. Experimental setup...78
4.1.3. Description of calculation...79
4.1.4. Results and discussions...80
4.1.4.1. Temporal evolution of carbon emissions during recombining phase...80
4.1.4.2. Density dependence of carbon emissions during recombining and steady state phases...87
4.1.5. Summary...89
4.2. Edge impurity transport study of plasmas with ergodic layer using CIII to CVI...92
4.2.1. Introduction...92
4.2.2. LHD edge magnetic structures...93
4.2.3. Experimental setup...96
4.2.4. Brief description on impurity transport in ergodic layer...97
4.2.5. Experimental results and discussions...99
4.2.5.1. Density dependence of carbon emissions...103
4.2.5.2. Carbon emissions with different magnetic axes...105
4.2.5.3. Carbon emissions with externally supplied m/n=1/1 magnetic island...110
4.2.5.4. Carbon emissions with H2 and He discharges...114
4.2.6. Comparison with simulated carbon emission with edge transport code...118
4.2.7. Summary...123
References...124
5. Summary and conclusion...127
Acknowledgements...131
List of publications...133
List of Figures
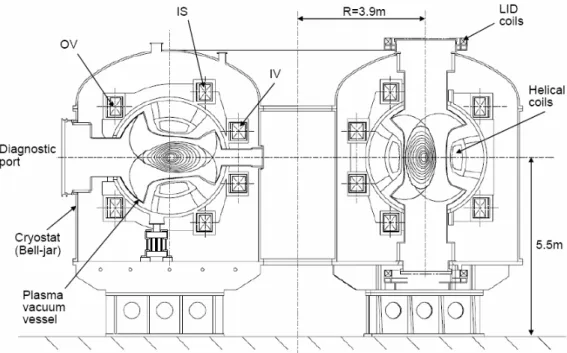
1.1 Cross sectional view of LHD with magnetic field structure, coils position,
vacuum vessel and cryostat………...7
2.1 Details of EUV flat-field spectrometer………...15
2.2 Schematic diagram of EUV flat-field spectrometer………...16
2.3 Calculated focal curves as a parameter of angles of incidence………...17
2.4 Experimentally obtained spectral resolution before and after alignments………….18
2.5 Theoretical and experimental reciprocal linear dispersions as a function of wavelength……….20
2.6 Typical spectra with ruled and holographic gratings……….21
2.7 Experimentally obtained spectral resolution for ruled and holographic gratings as a function of wavelength……….22
2.8 Peak intensity of higher order light and raw spectra including higher order emission for ruled and holographic gratings………24
2.9 Experimental and estimated continuum as a function of wavelength for ruled and holographic gratings……….27
2.10 Variation of relative sensitivities as a function of wavelength for ruled and holographic gratings………28
2.11 Inverse absolute sensitivity of holographic grating EUV spectrometer as a function of wavelength………..28
2.12 Schematic drawing and design specification of 2400grooves/mm EUV flat-field spectrometer………33
2.13 Calculated focal curves of 2400grooves/mm VLS concave grating as a parameter of angle of incidence……….34
2.14 Experimental and theoretical reciprocal linear dispersions as a function of wavelength………35
2.15 Experimentally obtained spectral resolution at three wavelengths as a function of distance from designed linear focal position………...36
2.16 Typical EUV spectra with ruled and holographic gratings………37
2.17 Experimentally obtained spectral resolution for ruled and holographic
gratings as a function of wavelength………..38
2.18 Examples of Gaussian fitted line profile showing spectral resolution for ruled and holographic grating………40
2.19 EUV spectra from LHD discharges obtained for ruled and holographic gratings representing higher order CVI emissions……….41
2.20 Calculated and experimental EUV bremsstrahlung continuum as a function of wavelength for ruled and holographic gratings………...43
2.21 Variation of relative sensitivities against wavelength for ruled and holographic gratings………...44
2.22 Absolute sensitivity of 2400grooves/mm EUV spectrometer with ruled and holographic gratings as a function of wavelength……….45
2.23 Typical spectra from LHD discharges obtained with ruled, old holographic and new holographic gratings………48
2.24 Inverse absolute sensitivities as a function of wavelength for ruled, old holographic and new holographic gratings………50
2.25 Experimentally obtained spectral resolution for ruled, old holographic and new holographic gratings as a function of wavelength………...51
2.26 Computationally simulated spectral resolution for old and new holographic gratings as a function of wavelength………...52
2.27 Local groove line-spacing as a function of distance from grating center for old and new holographic gratings………..53
2.28 Comparison between EUV Spectra in 50 to 130Å simultaneously recorded from two flat-field spectrometers of EUV_Short and EUV_Long………...55
2.29 Comparison of spectral resolution (FWHM) and absolute sensitivity between two EUV spectrometers………...56
3.1 Mo spectrum in 20−165Å………..62
3.2 Mo spectrum in 165−315Å………64
3.3 Mo spectrum in 315−500Å………64
3.4 W spectra in 24−80Å at Δt=340 and 440ms after pellet injection……….65
3.5 EUV spectrum in 20 to 65Å of H- and He-like ions from low-Z impurities………70
3.6 FeXVII-XXIV EUV spectrum of n=2-3 transitions from L-shell partially
ionized iron and neon EUV spectrum...…………...71 3.7 TiXIII-XX EUV spectrum of n=2-3 transitions from L-shell partially
ionized titanium……….73 4.1 Typical discharge for the present analysis showing plasma stored energy,
NBI heating pulses, <ne>, Te(0) and emissions of CIII, CIV, CV and CVI………..81 4.2 Time behaviors of central electron temperature and horizontal plasma radius
at horizontally elongated plasma cross section during recombining phase………...82 4.3 Calculated and experimental total radiation power of CIII, CIV, CV and CVI……83 4.4 Radial profiles of ne, Te and densities and emissivities of CIII to CVI……….84 4.5 Fractional abundances and emissivities for CIII, CIV, CV and CVI………86 4.6 CVI intensity and CVI/(neQ) plotted against line-averaged electron density
for recombining and steady state phases………88 4.7 CV intensity and CV/(neQ) plotted against line-averaged electron density
for recombining and steady state phases………90 4.8 CIII intensity against line-averaged electron density for recombining and
steady state phases……….91 4.9 CIV intensity against line-averaged electron density for recombining and
steady state phases……….91 4.10 Schematic views of horizontally elongated plasma cross section in Rax=3.6
and 4.0m of LHD...94 4.11 Edge profiles of magnetic field connection length as a function of major
radius at outboard side of horizontally elongated plasma cross section in
Rax=3.6 and 4.0m...95 4.12 Fractional abundances of C+, C+2, C+3, C+4, C+5 and C+6 as a function of Te...100 4.13 Vertical profiles of CIII, CIV and CV at Rax=3.6m...102 4.14 View chords of visible spectrometer and magnetic field structure of LHD
in Rax=3.6m...102 4.15 Ratio of CV+CVI to CIII+CIV and normalized intensities of (CV+CVI)/ne
and (CIII+CIV)/ne for Rax=3.6m...103 4.16 Edge ne and Te profiles for low- and high-density discharges in Rax=3.6m...104
4.17 Ratio of CV+CVI to CIII+CIV and normalized intensities of (CV+CVI)/ne
and (CIII+CIV)/ne in Rax=3.60, 3.75, 3.90 and 4.00m...106 4.18 Edge profiles of magnetic field connection length, Lc, at inboard and
outboard sides for horizontally elongated plasma cross section in
Rax=3.60, 3.75, 3.90 and 4.00m...107 4.19 Ergodic layer thickness at inboard and outboard sides in horizontally
elongated plasma cross section...108 4.20 Edge ne and Te profiles for Rax=3.60 and 4.00m...109 4.21 Radial profiles of rotational transform in Rax=3.60, 3.75, 3.85, 3.90 and 4.00m....109 4.22 Magnetic field structures of edge ergodic layer at horizontally elongated
plasma cross sections Rax=3.75 and 3.85m with and without LID...111 4.23 Ratio of CV+CVI to CIII+CIV and normalized intensities of (CV+CVI)/ne
and (CIII+CIV)/ne for Rax=3.75 and R=3.85m without and with LID...112 4.24 Edge ne and Te profiles with and without LID at Rax=3.75 and 3.85m...113 4.25 Ratio of CV+CVI to CIII+CIV and normalized intensities of (CV+CVI)/ne
and (CIII+CIV)/ne for H2 and He discharges...115 4.26 Plasma stored energy, line-averaged density and normalized intensities
of CIII/ne, CIV/ne, CV/ne and CVI/ne in H2 and He discharges...116 4.27 Te at ρ=1 and divertor ion saturation current for H2 and He discharges...117 4.28 2-dimensional profile of connection length in ergodic layer of LHD
(Rax=3.75m) superposed with Poincare plot of magnetic field lines...118 4.29 Edge profiles of carbon density summed up over all charge states for
different edge densities of nLCFS=2 and 4×10¹⁹m-3...119 4.30 Ratios of CV to CIII+CIV obtained from experiment and simulation with and without friction force...120 4.31 Radial carbon density profiles of each charge state simulated by
EMC3-EIRENE code with nLCFS=2 and 4×10¹⁹m-3...122
List of Tables
1.1 LHD plasma diagnostics………8
2.1 Observed transitions of Mo (Z=42) ions in 65−90Å………...63
2.2 Observed transitions of W (Z=74) ions in 24−40Å……….67
2.3 Observed transitions of W (Z=74) ions in 50−70Å……….68
2.4 Observed n=2-3 transitions of L-shell partially ionized Fe (Z=26) ions in 10 to 20Å……...72
2.5 Observed n=2-3 transitions of L-shell partially ionized Ti (Z=22) ions in 10 to 30Å……...74
Chapter 1
Introduction
1.1. Impurity in nuclear fusion research
The most promising nuclear reaction for fusion reactor using magnetic confinement is;
D+T→4He(3.52MeV)+n(14.06MeV) , (1.1) where D and T are the deuterium and tritium, respectively, and 4He (alpha particle) and n (neutron) are the nuclear reaction product. High temperature (~10keV) and high density (~1020m-3) plasma is required to produce enough fusion output. The Lawson criterion [1] gives the physical condition for the fusion reactor formation based on the α particle heating. It is defined by the fusion triple product of the plasma energy confinement time, τE, plasma temperature, T, and plasma ion density, ni and gives us the following relation; niTτE〉1021m−3.keV.s , (1.2) where τE is defined by
τE = Wp Pin. (1.3) Here, Wp is the plasma stored energy and Pin is the input heating power.
Impurities such as carbon, oxygen and metallic elements intrinsically exist in the magnetic confined plasmas since several plasma facing components are installed in the vacuum vessel [2, 3]. The presence of impurities leads to an increase of radiation loss in addition to a dilution of fuel ions [4]. The net input power, Pin-net, is reduced by the radiation loss as
Pin_net=Pin−Prad. (1.4) Impurity control becomes basically an important issue in fusion research. The control of metallic impurities is essentially required, since the radiation loss from high-Z impurities
is much bigger than low-Z impurities [5]. The line radiation loss from a specific impurity element is expressed by
Prad=nenimpR, (1.5) where R is the radiation coefficient as a function of electron temperature. The total radiation loss is the sum of line emissions from impurities. The impurity control becomes a crucial issue in fusion research. Therefore, the study of the impurity behavior is also important to find better impurity control method.
1.2. EUV spectroscopy
In fusion plasmas, carbon (Z=6) is widely used as a plasma facing component in the vacuum vessel and oxygen (Z=8) exists on the surface of the plasma facing component as water and carbon oxide. Nitrogen (Z=7) sometimes appears after opening of the vacuum vessel. Boron (Z=5) is found through boronization which is one of methods to control the impurity content. These impurities are called 'low-Z impurity'. On the other hand, metallic impurities such as chromium (Z=24) and iron (Z=26) are basically originated in the vacuum vessel made of stainless steel. Titanium gettering to suppress the oxygen influx brings titanium (Z=22) into plasmas. These impurities are called 'medium-Z impurity' in the present thesis. Recently, the use of high-Z impurity like molybdenum (Z=42) and tungsten (Z=74) is planned in ITER as a candidate for the plasma facing components.
The extreme ultraviolet (EUV) wavelength range of 10−500Å contains many strong spectral lines which can be used as a tool for spectroscopic diagnostics. For example, Δn=0 resonance transitions from partially ionized medium–Z impurities are emitted in the 90−500Å range [3, 6]. This range also contains spectral lines from higher excited states in low-Z impurities [3, 7]. Resonance lines from H- and He-like ions of B, N, C, and O appear in 10−65Å. This shorter wavelength range also contains Δn=1 transitions from Ti and Fe [3, 8]. Strong spectral band appears in 45−85Å range for Mo
and W [9, 10]. Therefore, the observation of spectra in this EUV range is very crucial to understand the impurity behavior in fusion plasmas.
Plasma spectroscopy in the EUV range is commonly performed using a grazing incidence spectrometer based on diffraction grating. This grating consists of a large number of grooves ruled on concave substrate. The groove structure makes possible to diffract the incident light into one or more spectral orders according to the grating equation [11];
mλ=d
(
sinα+sinβ)
, (1.6) where λ, d and m are the wavelength of light, groove spacing and spectral order number, respectively. The values of α and β are the angles of incidence and diffraction, respectively. In the EUV range, the angle of incidence has to be large, since the reflectivity on the grating becomes low for shorter wavelength. Therefore, the grazing incidence spectrometer is used instead of normal incidence spectrometer. The focal mechanism of the traditional gazing incidence spectrometer [12] is based on Rowland circle geometry [13]. However, the focal position is curved along the Rowland curve. It is difficult for the grazing spectrometer to observe spectra using multichannel detector such as charge couple device (CCD). The grazing incidence spectrometer is then limited to use as monochromator.A flat focal plane is required in order to observe the EUV spectra with good spectral resolution. Fonck et al. has developed an EUV spectrometer for measurement of 100-1100Å range using 450grooves/mm flat focal toroidal grating with spectral resolution of ~2Å [14]. It can also monitor the EUV spectra with better resolution of
~0.4Å, replacing by 2100grooves/mm toroidal grating. The complete flat focal plane has been achieved by Kita et al. [15] using an aberration corrected varied-line-spacing (VLS) grooves spherical-concave grating which focuses all diffracted rays onto the flat plane. The flat focal plane therefore provides the same spectral resolution along a certain wavelength interval. The necessary ruled grating is manufactured using a feedback- controlled mechanical ruling machine. The EUV spectra have been observed using this flat-field spectrometer with VLS ruled grating at least during past 20 years.
1.3. Motivation of the present study
The EUV spectrometer with VLS ruled grating usually suffers from higher order effect and larger stray light. The influence is typically seen in the line identification. The identification becomes often difficult because many spectral lines closely exist in the EUV wavelength range and the 1st order original lines overlap with many other higher orders lines. Therefore, it is pointed out that further improvement is required in addition to its sensitivity and spectral resolution. One of the candidates for the improvement is the replacement of the ruled grating by the holographic grating. It is well known that the holographic grating has a specific property to suppress the higher orders light and the stray light [16].
Recently, the VLS laminar-type holographic grating has been newly developed by Shimadzu Co. Ltd. [17]. It has a rectangular groove shape whereas the ruled grating has a triangular groove shape. The holographic grating is manufactured using holographic technique through chemical process. The flat-field spectrometers with laminar-type holographic gratings have been developed through the present thesis for the further improvement on the spectral characteristics.
Molybdenum and tungsten have been considered as a candidate for the plasma facing material in ITER. The spectroscopic study on the high-Z impurities becomes important in the next generation fusion device. The spectral lines of the high-Z elements, however, have not been well investigated until now. Any exact wavelengths have not been determined even now. Most of the spectral lines from such highly ionized high-Z impurities are emitted in EUV and soft X-ray ranges. Extensive study is necessary on the line analysis of high-Z elements in addition to theoretical work based on atomic physics. On the other hand, n=3-2 transitions from partially L-shell ionized medium-Z impurities (16<Z<27) emitted in the 10-30Å range are very useful to impurity diagnostics, since the charge state distribution can be easily measured from the transition array. The spectral line structure of the transition has not been actively studied until now mainly due to the technical difficulty. The emission spectra in such a short wavelength range can be successfully measured using flat-field spectrometer because of its wider wavelength
interval with good spectral resolution in comparison with the conventional grazing incidence and crystal spectrometers [12, 18].
In helical devices, such as Large Helical Device (LHD) [19], the edge magnetic fields are intrinsically stochastic and the edge plasma is then characterized by the presence of thick stochastic magnetic field structure surrounding the plasma core, which is called ergodic layer [20]. The particle transport parallel to the magnetic fields becomes important in the ergodic layer as well as the transport perpendicular to the magnetic fields. It is reported that the parallel particle transport can lead to the reduction of impurity influx [21]. Recently in several tokamaks, the effect of the stochastic magnetic fields has been extensively studied using perturbation field supplied by external magnetic field coils in relation to edge localized mode (ELM) [22]. In Tore Supra tokamak, a significant reduction of the intrinsic impurity amount was found by the activation of ergodic divertor [23]. Reduction of highly ionized carbon has been also observed during ergodic divertor operation in TEXTOR [24]. This unique edge impurity behavior can be explained by the competition among several forces directly affecting the parallel particle motion [25].
In LHD the magnetic field structure of the ergodic layer can be well calculated, whereas the estimation of the stochastic magnetic field structure is not so simple. The magnetic field structure in the ergodic layer can be easily modified by changing the coil currents of LHD, which give large freedom for formation of the magnetic field configuration. The local island divertor (LID) coils can also control m/n=1/1 island width at plasma edge. The study of the edge impurity transport in the ergodic magnetic fields is significantly important further to understand the physical mechanism.
1.4. LHD and relevant diagnostics
Physical parameters of LHD are as follows; Major radius: 3.5≤R≤4.1m (standard: R=3.6m)
Average minor radius: a=0.6m at R=3.6m
Magnetic field strength at plasma center: B0<3.0T Plasma volume: Vp=30m3 at R=3.6m.
Magnetic surface for confinement is formed by a pair of l/m=2/10 continuous helical and three pairs of poliodal coils, where l and m are the poloidal and toroidal pitch numbers. All the coils are made of superconductor. A cross sectional view of LHD is shown in Fig.1.1. The pairs of outer vertical (OV), inner vertical (IV) and inner shaping (IS) coil are seen in the figure. Ten pairs of local island divertor (LID) coils made of normal conductor are also set at the top and bottom ports of all vertically elongated plasma cross section. Helical coils (HC) produce the elliptical magnetic surface in LHD and the strong vertical field produced by HC is necessarily cancelled by OV coils. The position of the plasma axis, which can significantly determine the fundamental nature for confinement, is changed by the vertical field from the OV and IV coils. The shape of the elliptical plasma can be modified by the quadrupole field from the IS coils. The LID coils are mainly used for the cancellation and expansion of m/n=1/1 island, where m and n are poloidal and toroidal mode number.
In LHD the divertor structure is intrinsically formed seen in Fig.1.1 [26]. Divertor tiles are made of carbon, which is a major impurity in LHD at present. The vacuum vessel is made of stainless steel and the wall conditioning is normally done by He glow discharge. Boronization and titanium gettering are occasionally carried out according to the experimental purpose. Thick stochastic magnetic field lines region known as ergodic layer exist at outside of last closed flux surface (LCFS). Detailed feature of the ergodic layer is discussed in section 4.2.
Fig. 1.1 Cross sectional view of LHD with magnetic field structure, coils position, vacuum vessel and cryostat.
A discharge is generally initiated by electron cyclotron heating (ECH) [27] and sustained by three negative ion based neutral beam injection (NBI) [28]. The discharge can be also initiated by NBI itself. Total ECH power produced by three gyrotrons at the characteristics frequencies of 84, 82.6 and 168 GHz. is ~2.0MW. Ion cyclotron resonance heating (ICRH) is mainly used for steady-state operation with total power of
~2.7MW in maximum using 6 antennas. Three NBIs undertaking the main heating in LHD are aligned for tangential injection. The heating power of each beam is ~4−5MW at energy of 180keV. Recently a low-energy beam based on positive ion is installed as a perpendicular injection.
LHD diagnostics [29] have been designed by the following key issues; (a) Multi-dimensional (2- or 3-dimensional) measurement to study non- axisymmetric toroidal plasma
b) Diagnostics in the steady state operation.
The main physics issues considered during the design are as follows; (a) Energy and particle transports in LHD magnetic field configuration, b) Magnetohydrodynamic (MHD) equilibrium and stability,
(c) Characteristics of the helical divertor, and (d) Confinement of energetic particles.
The main diagnostics are listed in Table 1.1. Here, the diagnostics relevant to the present work are briefly described.
Table 1.1 LHD plasma diagnostics
Diagnostics Measurements
Magnetic probe Ip, Wp
2mm interferometer line-averaged electron density (<ne>) FIR laser interferometer ne(r)
microwave reflectometer ne fluctuation Thomson scattering Te(r), ne(r) Electron cyclotron emission (ECE) Te(r)
X-ray pulse height analyzer (PHA) Te, impurities
TOF neutral particle analyzer Ti, ion energy spectrum f(E) Charge exchange spectroscopy (CXS) Ti(r), plasma rotation (Vp(r), Vt(r)) X-ray crystal spectroscopy Ti, Vt
Bolometer Prad(r)
VUV and EUV spectroscopy impurity, Ti
Visible spectroscopy impurity, n0(H), Zeff
Soft X-ray diode array MHD
CO2 laser scattering micro-instability Heavy ion beam probe (HIBP) Φp(r), Φp fluctuation
Langmuir probe edge Te, ne, Φp
Divertor spectroscopy recycling, particle influx
Li beam probe ne fluctuation
High energy particle diagnostics fast ion energy spectra visible/infrared camera plasma-wall interaction
Spectroscopic diagnostics covering visible to X-ray ranges have been installed to monitor and study the impurity behavior in LHD plasmas [30]. Visible diagnostics consist of two 50cm UV-visible spectrometers, one 1.33m visible spectrometer, Zeff
profile measurement system, Hα and HeI monitors in visible range. One of the 50cm visible spectrometers has three gratings of 100, 1800 and 3600grooves/mm and another one has 150, 600 and 1200grooves/mm gratings. These two spectrometers can simultaneously observe the visible spectra from 26channels. The visible spectrometer
with 1.33m focal length has aberration-corrected mirror system and a grating of 1800grooves/mm with a reciprocal linear dispersion of 0.3nm/mm. This system creates extremely good spectral resolution and measures detailed spectral line profiles. Array of 100 optical fibers is used to transfer the visible light. Visible bremsstrahlung profile for Zeff measurement is installed with a combination of 84 optical fibers (a core diameter: 300μm), 80 photomultipliers and an interference filter having a center wavelength of 5215Å [31]. Recently, visible spectrometer for Zeff profile measurement is also installed with 100 optical fibers (a core diameter: 100μm).
VUV and EUV spectroscopy include an impurity monitor station consisting of three 20cm normal incidence spectrometers (300–2000Å) and five 20cm normal incidence monochromators, a 2.2m grazing incidence monochromator (100–1200Å), Hα and HeI monitors, total radiation monitor and a soft x-ray monitor. The 20cm momochromators equipped with secondary electron multiplier (SEM) tubes observe the emissions from spectral lines of Lα (1215Å), CIII (977Å), CIV (1548Å), OV (630Å), and OVI (1031Å). The grazing incidence monochromator is routinely used to monitor the FeXVI (335Å) line. Radial profiles of edge impurity are measured by 3m VUV spectrometer with the use of view-angle adjustable mirrors set in front of an entrance slit and back illuminated CCD detector [32]. Two flat-field EUV spectrometers to cover 10−500Å, which is a part of the present study, is now completed and routinely used to observe the emission spectra from highly ionized impurities.
The X-ray pulse height analyzer with Si(Li) and Ge detectors is also installed to measure the heavy metallic impurity emission from the plasma core. Radial profile of line-integrated x-rays can be measured by scanning the line of sight of four Si(Li) detectors in a steady phase of LHD discharges [33]. A crystal spectrometer has been developed for the measurement of ion temperature and toroidal rotation velocity in the central part of LHD plasma using Doppler broadening and its shift of x-ray lines from He- and H-like Ar and Ti ions [34].
Electron temperature (Te) and density (ne) profiles are measured by Thomson scattering diagnostics [35] at a horizontally elongated plasma cross section. The backscattering system adopted as the Thomson scattering diagnostics observes the whole plasma region along a major radius (R) on the mid-plane under the severe port constraint
of the helical configuration. The system consists of 200 radial measurement points with a spatial resolution of 15–30mm, which depends on the radial position of laser scattering. The overall optical-electrical conversion efficiency can be very high by use of a large collection mirror (150×1.80cm), optical fibers with large core diameter (2mm), filter polychromators with high transmittance, avalanche photo detectors and Nd-YAG lasers (four 50Hz lasers: 0.5J/pulse, two 10Hz lasers: 2.5J/pulse). This high repetition system enables us to obtain high quality data of Te(r) and ne(r) of LHD. The spatial resolution in each point is very high due to the adoption of short scattering spatial length. The high repetition and high spatial resolution allow to observe the detailed information of magnetic islands seen in LHD magnetic surface [36]. The absolute value of the density is checked with line-integrated density measured by a 285GHz millimeter interferometer.
Electron density profile is also measured by 13 channels FIR laser interferometer at vertically elongated plasma cross section [37]. The FIR laser beam is generated by CH3OH laser, which is pumped by CO2 lasers, with a wavelength of 118.8μm. The frequency difference between the CH3OH lasers for the probe beam and the reference beam is 1MHz. The power of CH3OH laser is 150mW. Laser beam and optical components are enclosed and filled with dry air in order to reduce absorption by water vapor. A probe laser beam is split into 13 beams using beam splitter. The 13 probe beams pass through the LHD plasma vertically and are reflected back. Each probe beam is mixed with the reference beam and is detected by Schottky barrier diode. Thirteen beams can cover the whole region of the plasma with 90mm separation, while the laser beam width is about 50mm. The observed signal-to-noise ratio is 30−40dB/10kHz, and the phase fluctuation is approximately 1/100 fringes. Radial density profiles have been obtained with an Abel inversion technique. The observed density resolution is 4×10¹⁷m-3. Using its good temporal and spatial resolutions, particle diffusion coefficients are obtained with density modulation due to gas puffing [38].
Ion flux distribution is measured by an array of 16 dome-type Langmuir probes embedded in divertor carbon tiles and plasma stored energy is measured by diamagnetic loop in a usual way.
References
[1] J. Wesson, Tokamaks, 3rd edition, Oxford University Press, (2004). [2] R. C. Isler, Nucl. Fusion 24, 1599 (1984).
[3] C De Michelis and M Mattioli, Rep. Prog. Phys. 47, 1233 (1984).
[4] P. C. Stangeby, The Plasma Boundary of Magnetic Fusion Devices, Institute of Physics Publishing, (2000).
[5] X. Bonnin et al., Suppl. Nucl. Fusion 2, 1028 (1992). [6] B. C. Stratton et al., Phys. Rev. A 31, 2534 (1985).
[7] R. Katai, S Morita and M. Goto, Plasma Fusion Res. 2, 006 (2007). [8] B. C. Stratton et al., Fusion Sci. Tech. 53, 431 (2008).
[9] C. Jupen et al., Physica Scripta. 68, 230 (2003). [10] K. Asmussen et al., Nucl. Fusion 38, 967 (1998).
[11] A. Thorne, U. Litzen and S. Johansson, Spectrophysics, Spinger-Verlag, (1999). [12] W. L. Hodge et al., Rev. Sci, Instrum. 55, 16 (1984).
[13] J. A. R. Samson and D. L. Ederer, Vacuum Ultraviolet Spectroscopy I, Academic Press, (1998).
[14] R. J. Fonck et al., Appl. Opt. 21, 2115 (1982). [15] T. Kita et al., Appl. Opt. 22, 512 (1983).
[16] M. Koike et al., Proceeding of SPIE 4146, 163 (2000).
[17] M. Koike et al., J. electron Spect. & Rel. Phenom. 101-103, 913 (1999).
[18] I. Sakurai, Y. Tawara, C. Matsumoto, A. Furuzawa, S. Morita and M. Goto, Rev. Sci. Instrum. 77, 10F328 (2006).
[19] A. Iiyoshi et al., Nucl. Fusion 39, 1245 (1999). [20] N. Ohyabu et al., Nucl. Fusion 34, 387 (1994).
[21] Ph Ghendrih et al., Plasma Phys. Control. Fusion 38, 1653 (1996). [22] T. E. Evans et al., Phys. Plasmas 9, 4957 (2002).
[23] C. Breton et al., Nucl. Fusion 31, 1774 (1991). [24] G. Telesca et al., J. Nucl. Mater 44, 337 (2005). [25] Z. Tokar, Phys. Plasmas 6, 2808 (1999).
[26] N. Ohyabu et al., J. Nucl. Mater. 266-269, 302 (1999).
[27] S. Kubo et al., J. Plasma Fusion Res. 78, 99 (2002). [28] O. Kaneko et al., Nucl. Fusion 43, 692 (2003).
[29] S. Sudo et al., Plasma Phys. Control. Fusion 45, 1127 (2003). [30] S. Morita, M. Goto et al., Plasma Sci. Tech. 8, 55 (2006).
[31] H. Nozato, S. Morita, M. Goto et al., J. Plasma Fusion Res. Series 5, 442 (2002). [32] S. Morita and M. Goto, Rev. Sci. Instrum. 74, 2036 (2003).
[33] S. Muto, S. Morita et al., Rev. Sci. Instrum. 72, 1206 (2001). [34] S. Morita and M. Goto, Rev. Sci. Instrum. 74, 2375 (2003). [35] K. Narihara et al., Rev. Sci. Instrum. 72, 1122 (2001). [36] K. Narihara et al., Phys. Rev. lett. 87, 13002 (2001). [37] K. Kawahata et al., Rev. Sci. Instrum. 70, 695 (1999). [38] K. Tanaka et al., Nucl. Fusion 46, 110 (2006).
Chapter 2
Development of EUV spectrometers and their calibration
2.1. Spectrometer for 50-500Å (EUV_Long)
2.1.1. Introduction
Spectral emissions in the extreme ultra violet (EUV) wavelength range from magnetically confined high temperature plasmas can be used to estimate the radiation losses from impurities, to study the impurity transport phenomena, to understand the plasma-wall interaction and also to monitor over all discharge conditions [1]. The grazing incidence spectrometers with an array detector like micro-channel plate, photo diode array and charge couple device (CCD) detector are well served to these purposes due to the capability of providing spectral and temporal information simultaneously. Therefore, such spectrometers have been used in many tokamaks [1, 2] and other magnetically confined plasma devices [3, 4].
On the other hand, a flat focal plane is required in order to mount the multi- channel flat detectors. The flat focal plane has been recently achieved using a varied-line- spacing (VLS) grooves concave grating which focuses all diffracted rays onto the flat plane [5]. The use of the mechanically ruled VLS grating presents the same spectral resolution along the detector size and relatively easy alignment of the detector. When the VLS grating with 1200grooves/mm at the grating center is used, the flat-field EUV spectrometer measures a wavelength range of 50 to 500Å with good spectral resolution, which covers the important lines of partially ionized medium-Z impurities like Ne, Ar. Ti., Cr, Fe etc. These spectral lines mainly emitted from the plasma core can be considered as a local plasma diagnostics.
However, the line identification becomes frequently difficult, since so many lines closely exist in such a wavelength range. Furthermore, the 1st order original lines
overlap with many higher orders lines. It is well known that the holographic grating has a distinct advantage over the mechanically ruled grating from the standpoint of its ability to suppress overlapping higher orders light and to reduce the stray light level [6]. Recently, the VLS laminar-type holographic grating with flat-field focal plane has been newly developed by Shimadzu Co. Ltd [7, 8].
At first, the EUV spectrometer with the mechanically ruled 1200groves/mm grating was constructed to measure LHD plasmas. Next, the grating was replaced by the VLS holographic grating to compare the spectral resolution and sensitivities between the two gratings. The relative sensitivities have been determined using EUV continuum radiation. The absolute sensitivity calibration is done with the combination of the EUV continuum and the branching ratio [9] of CIV lines (3p-3s: 5800Å/3p-2s: 312Å). In this section the comparison of the EUV spectrometer characteristics between the ruled and holographic gratings is presented with detailed technical explanations of the spectrometer. A new technique for the absolute calibration applied to the holographic grating EUV spectrometer is also presented.
2.1.2. Details on 1200grooves/mm flat-field EUV spectrometer
A schematic drawing of a flat-field EUV spectrometer is shown in Fig.2.1. It consists of a fixed entrance slit of 30μm width, a gold-coated concave VLS grating and CCD. Several masks are placed in front of the grating and at the back side of the grating to reduce the impinging scattered light. An electrical insulator is placed between the detector and the spectrometer. A pulse motor is used for the movement of the CCD detector along the focal plane to change a wavelength range to be measured. A laser light can be focused on the grating center as a zero-th order light to align the spectrometer view axis. The spectrometer is evacuated by a magnetically floating turbo molecular pump. The pressure of the spectrometer is generally kept in the order of 10-8torr. A back-illuminated CCD (Andor DO420-BN) is used as a detector. The size of the CCD is 26.6×6.6mm2 with a pixel size of 26×26μm2 and the number of channels of 1024×255. Data are transferred with a time interval of 5ms in full vertical binning mode. An upper
half of the CCD is masked by a rectangular slit to reduce the EUV emission intensity. A mechanically ruled VLS 1200grooves/mm gold-coated grating (Hitachi 001-0266) is set up as the first step of the present study. The effective area of the grating is 26mm in groove length and 46mm in grooves distance. A blaze angle and wavelength are 3.2° and 1000Å, respectively. The spectrometer was installed on a radial port perpendicular to the toroidal magnetic field of the LHD through a bellow flange at a distance of 9m from the plasma center.
Fig. 2.1 Details of EUV flat-field spectrometer.
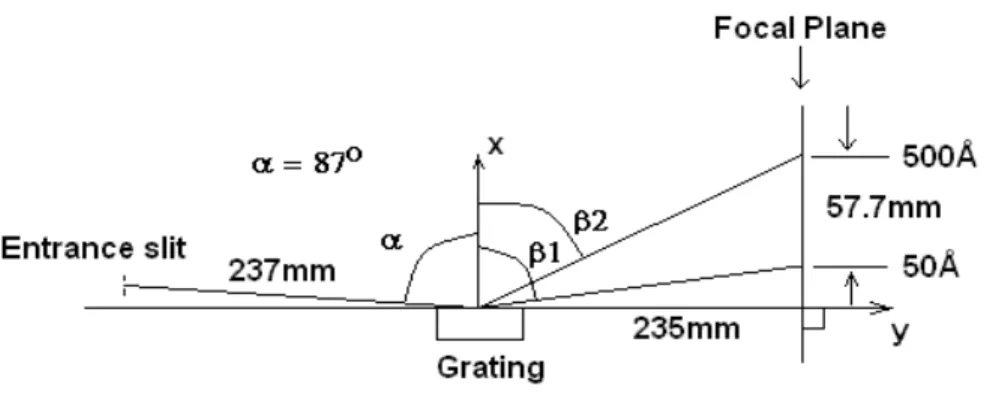
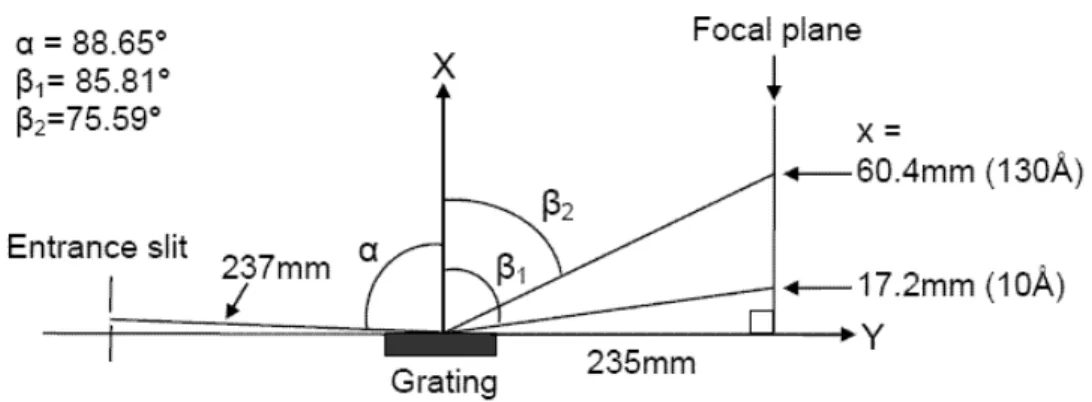
A schematic design specification of the EUV spectrometer is illustrated in Fig.2.2. Details of the grating design have been reported in different papers [4, 5, 10]. The 1200grooves/mm VLS concave grating covers a wavelength range of 50 to 500Å at an angle of incidence of α=87°. A radius of curvature is 5649mm, then the distance between the grating center and the entrance slit is 237mm and the distance between the focal plane perpendicular to the grating surface and the grating center is 235mm. The angle of diffraction, β, determines the wavelengths to be measured.
Fig. 2.2 Schematic diagram of EUV flat-field spectrometer with its parameters.
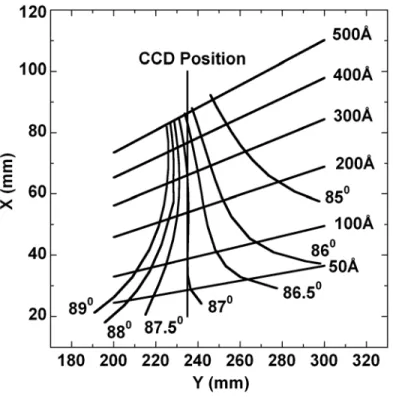
Focal curves at the detector position are calculated as a parameter of the angle of incidence, as shown in Fig.2.3. The x-y coordinate is indicated in Fig.2.2. The calculation is done in relation to the total light path for the mechanically ruled aberration corrected concave grating. The light path function [10] can be written as a power series of the groove coordinate and is then expressed as
[ ( ) ]
ij ij
ij C m M
F = + λ /σ0 , (2.1) where Cij is the usual term corresponding to the equally spaced straight grooves and Mij
the aberration-corrected term related to varied spacing curved grooves. The complete aberration free image can be obtained when each key term of the light path function is kept either zero or minimum. The first two terms related with dispersion of the grating and horizontal focal condition are given as
sinα sinβ
10 =− −
C , (2.2) 1
10 =
M , (2.3)
⎟⎟⎠
⎜⎜ ⎞
⎝
⎛ −
+ ′
⎟⎟⎠
⎜⎜ ⎞
⎝
⎛ −
= r R r R
C α α cos β cosβ 2
1 cos cos
2
1 2 2
20
(2.4)
and
⎟
⎠
⎜ ⎞
⎝
⎛ − θ
= 2
b tan R
M20 1 2 , (2.5) where α and β are the angles of incidence and diffraction, respectively, σ0 the nominal groove spacing, R the grating radius, m the diffraction order, λ the wavelength, r and r׳
the incidence and diffraction radial distances, respectively, θ the grooves angle with respect to the normal of grating. The value of b2, which is a ruling parameter, corresponds to a flat focal condition, taken from Ref. 5. The tanθ is assumed to be zero since the value of θ is very small. The two terms, F10 and F20, are solved together for different lambdas and the angles of incidence to get the focal curves. It is seen from the figure that the focal condition varies abruptly with variation of the angle of incidence. However, only the focal curve for the angle of incidence of 87° gives an approximately good straight focal condition in the wavelength range of 100 to 300Å. Therefore, the vertical line at y=235mm shown in the figure indicates an exact position of the CCD detector. From the focal curve it could be clearly understood that the approximately determined linear focusing sharply drops below 50Å. The linear focusing is also lost gradually at wavelengths above 300Å.
Fig. 2.3 Calculated focal curves as a parameter of angles of incidence. Positions of X and Y axes are indicated in Fig.2.2. A solid vertical line denoted with CCD position means a designed position of detector.
The most difficult and important point during the construction of the EUV spectrometer is setting of the grating angle. The exact position of the angle of incidence of the grating can be determined by checking the spectral resolution as a function of y- coordinate. For this purpose spectral emissions from the LHD plasmas were measured and the wavelengths were calibrated using well known emission lines from impurities like He, C and Ne. All spectra used to check spectral resolution were recorded with a full image mode in order to measure an exact spectral resolution avoiding an influence of the spectral line tilt.
Fig. 2.4. Experimentally obtained spectral resolution Δλ0 (full width at foot position of spectrum) (a) before and (b) after angle realignment of ruled grating as a function of distance from designed focal plane indicated in Fig.2.2. Data are plotted at three different wavelengths.
Figure 2.4 shows a plot of the full width at foot position of spectral lines, Δλ0, as a
function of displacement along the y axis. The position of ΔY=0 means the position of Y=235mm expressed by the vertical line in Fig.2.3. The different values of ΔY are obtained by the use of insulator flange with different thicknesses. Data are plotted for typical three wavelengths of 120, 210 and 310Å. It is visible from Fig.2.4 (a) that the best focus position deviates from the regular position +5mm apart and the shorter wavelengths are focused at relatively larger Y coordinate. It indicates that the incidence angle is smaller than the designed value of 87°. Seeing Fig.2.3 we understand the true angle of incidence is 86.8°.
When the plot of Fig.2.4 (a) was obtained, we used a collimated laser light to adjust the angle of incidence of the grating. Then, we knew it was impossible to adjust the angle within an accuracy of 0.02−0.04°. The method to set the grating was changed to a new technique with a telescope. Two telescopes were set behind the detector position and the grating edge was monitored while translating and rotating the grating. The position of the grating was finally determined as a standard position of the entrance slit and grating center. This method excellently improved the accuracy of the grating angle setting. Figure 2.4 (b) shows the result after the realignment. The best focus position becomes identical for three wavelengths, close to the regular position. The spectral resolution of Δλ0 is almost the same at different wavelengths with symmetric line shape. Thus, the alignment of the grating has been accurate enough and the CCD position has been also accurate within 0.5mm of the designed value.
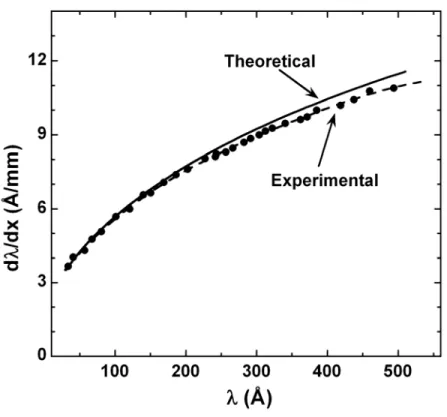
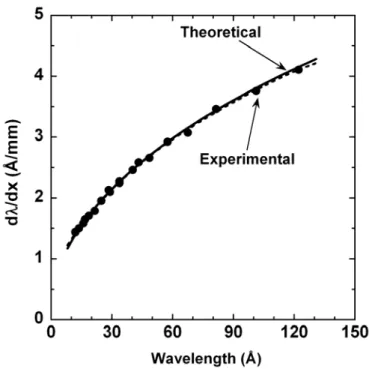
The reciprocal linear dispersions are experimentally determined and compared with theoretical values, as revealed in Fig.2.5. The wavelength λ is given as a function of distance along focal plane (x-direction in Fig.2.2) by
mλ=σ0(sinα +sinβ) (2.6) and
β cot
=235
L , (2.7)
where α, β, λ, m and σ0 are as their usual meaning. The value of L is the distance along y-axis between the grating and focal plane. Using these two equations it is found that the theoretical reciprocal linear dispersion varies from 4.26 to 11.48Å/mm over the
corresponding wavelength range of 50 to 500Å. The total length in the spectral range is 57.7mm (see Fig.2.2). The angle of incidence on the focal plane of each spectral line varies from 6.96 to 20.18°. The experimental values expressed with closed circles are in a fairly good agreement with the calculated ones. For example, the dispersion is 7.62Å/mm at 200Å, which corresponds to 0.198Å/ch in the CCD image. However, there exists a very small discrepancy between them at longer wavelength side. The discrepancy is only 0.4Å/mm (0.01Å/ch) at 500Å and does not pose any problem in using the spectrometer. We believe that this discrepancy originated due to an angular deviation of the CCD detector from the designed focal plane. Small misalignment in the angle of incidence of the grating and the detector position will be other origins, which can give a little contribution to the error.
Fig. 2.5 Theoretical and experimental reciprocal linear dispersions as a function of wavelength. Experimental data are fitted with a dashed line.
2.2.3. Comparison between ruled and holographic gratings
The VLS laminar-type holographic grating [7, 8] having equivalent parameters to the ruled grating was mounted on the same spectrometer after removing the ruled grating for comparative study. The setting of the grating was performed to achieve the best resolution by the new method using the two telescopes as mentioned in the former section. In the present LHD discharges only the carbon is a main impurity because divertor plates are made of carbon. The amount of nitrogen is negligible except for the beginning of experimental campaign after long opening of the vacuum vessel, and the amount of oxygen is estimated to be less than 10-3 to the electron density.
Fig. 2.6 Typical spectra with (a) ruled and (b) holographic gratings obtained from NBI-heated LHD discharges.
EUV spectra are observed from NBI-heated H2 discharges in LHD. The exposure time per frame is 5ms and twenty frames are summed up to get better signal-to-noise ratio. The line-averaged electron density was around 4×10¹⁹m-3 in both discharges as measured by FIR interferometer diagnostics. Results are shown in Figs.2.6 (a) and (b) for ruled and holographic gratings, respectively. The spectrum from the holographic grating revealed in Fig.2.6 (b) is obtained after replacing the ruled grating by the holographic grating. Both spectra show resonance transitions of highly charged ions from carbon and iron which are the intrinsic impurity in LHD. The emissions from highly ionized argon are seen in the spectra. A small amount of argon is routinely puffed at beginning of discharges for the ion temperature measurement using a crystal spectrometer. The helium line originates in the helium glow discharge for vacuum wall cleaning. In this longer wavelength range of 170−390Å both spectra have no clear difference in relation to the spectral resolution.
Fig. 2.7 Experimentally obtained spectral resolution Δλ0 (full width at foot position of spectrum) for ruled and holographic gratings as a function of wavelength.
The wavelength dispersion and the spectral resolution for the holographic grating were also determined from the emission spectra of LHD plasmas. The same reciprocal linear dispersion as the ruled grating is, of course, confirmed. Figure 2.7 presents comparison of the spectral resolution Δλ0 (full width at foot position) between the ruled and holographic gratings as a function of wavelength. It shows nearly constant Δλ0
values of 4 channels independent of the wavelength for both gratings. Especially, the Δλ0
of the 1st order line takes a value between 3.5 and 4.0channels for the whole wavelength range in both gratings. The full width at half maximum (FWHM) of the spectral line, Δλ, estimated from a Gaussian fitting is 0.25Å at 192Å, which corresponds to 1.3 channels of the CCD detector. The Gaussian fitting of the spectral lines revealed unchanged spectral resolution across the detector, verifying that the spectral focus is certainly flat.
The capability of the two gratings was examined to check the contribution of the higher order light. The peak intensities of higher order light from CV (40.27Å), CVI (33.73Å) and FeXX (132.66Å) are plotted in Figs.2.8 (a) and (b) for ruled and holographic gratings, respectively. The relevant spectra are also shown in Figs.2.8 (c) and (d). The spectrum of Fig.2.8 (c) is measured during carbon impurity pellet injection in the LHD discharge and Fig.2.8 (d) is taken from a discharge with carbon limiter insertion in order to record higher carbon intensities. When the spectrometer is moved to the lower (upper) wavelength limit, the spectrum edge in longer (shorter) wavelength side is hidden behind the rectangular slit placed in front of the CCD, which is seen around 130−145Å (~100channels). In Figs.2.8 (a) and (b) all the intensities are normalized by their 1st order light. The second order light of CV from the holographic grating is only about 18 percent of the first order as shown in Fig.2.8 (b), whereas for the ruled grating the intensities from higher order light never decreases so quickly and maintains relatively strong intensities up to 8th order light, as revealed in Fig.2.8 (a). But the reduced second order light of CVI and FeXX in the ruled grating indicates a clear wavelength dependence on the higher order effect. This wavelength dependence is not evident for the holographic grating. Thus, the difference in the reflectivity of higher order light between the two types of the grating becomes very clear in the present work. This result confirms that the laminar-type holographic grating can suppress the higher order line spectra very efficiently compared with the ruled grating.
Fig. 2.8 Peak intensities of higher order light normalized to the 1st order light for (a) ruled and (b) holographic gratings. Raw spectra during carbon pellet injection and carbon limiter insertion are traced for (c) ruled and (d) holographic gratings, respectively, indicating higher order CV emissions.
2.1.4. Absolute intensity calibration
The conventional branching ratio method is a reliable technique to calibrate the EUV spectrometer absolutely. It determines an absolute emissivity of the vacuum ultra violet (VUV) spectral line using a branching pair of a VUV line and an absolutely calibrated visible line. Line emissions from partially ionized impurity ions from high- temperature plasmas have been used for the technique. Although several line pairs have been adopted so far for the absolute calibration, the line pair of 3p-3s/3p-2s transitions from lithium-like ions can give the simplest relation between the two transitions. However, the amount of impurities in recent magnetically confined plasmas has been greatly reduced because the vacuum wall was covered by carbon materials and an efficient discharge cleaning of the plasma facing component could be established. The status on the impurity content in LHD is also the same as other toroidal devices and the amount of low-Z impurities like nitrogen and oxygen and medium-Z impurities like chromium and iron are not normally visible. Therefore, it is difficult to get a sufficient number of lines pairs in order to fill a whole wavelength span of the spectrometer. Only the carbon emissions, however, became very strong since the divertor plates are made of carbon. The lithium-like ion of CIV, which has the strongest emission in VUV range, has been easily observed and could be successfully employed for the absolute calibration of our present instrument.
Recently, a relative intensity calibration of a high-resolution VUV spectrometer has been done using the continuum radiation in the field of astrophysics [11]. In this method a predicted free-free continuum radiation for an assumed electron temperature was compared with an experimental continuum. Then, a calibration curve against wavelength has been plotted from the ratio of the predicted to measured continuum intensities. The CCD detector used in the present study can be cooled by a Peltier device down to −70°C, and then the thermal noise is reduced to an extremely low level of 1count/sec/ch. The noise level is steady during a discharge. We can subtract the contribution of the noise from the raw data. Furthermore, the use of the holographic grating largely decreased the influence of the higher order light. The stray light in the EUV spectrometer is also completely deleted by setting many masks and slits. Thus, the
application of the continuum radiation from high-temperature plasmas to the spectrometer calibration can really give a very nice method also in the field of fusion plasma experiment. In fusion devices the electron temperature and density profiles have been measured from Thomson scattering diagnostic [12]. The continuum radiation can be accurately calculated from the measured profiles. The continuum radiation is generally composed of free-free radiation and free-bound radiation known as bremsstrahlung and radiative recombination, respectively. Here, the contribution from radiative recombination could be ruled out as the LHD plasma has a very high core electron temperature (≥2keV) and a relatively high edge temperature (≥200−500eV) at last closed flux surface in the moderate electron density range (2−3×10¹⁹m-3). The free- free radiant flux [13] can be expressed as
[
-1]
e e ff e
eff ) W.cm .Å
exp( T T
g n . Z
E 3
2 2 1
28 2 12400
10 89
1 − −
λ − λ
λ
×
= , (2.8)
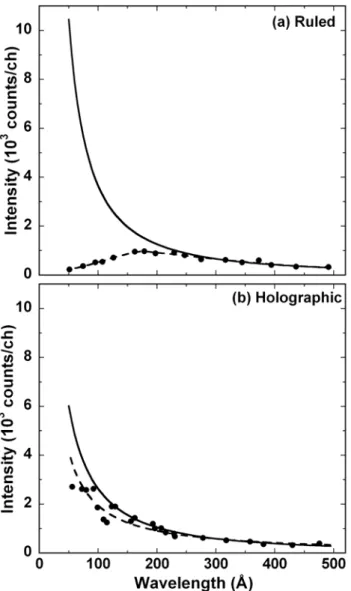
where ne is the electron density in cm-3, Zeff the effective ion charge, Te the electron temperature in eV, gff the free-free gaunt factor and λ the wavelength in Å. The free-free continuum in LHD has been usually measured in the visible and x-ray ranges in order to calculate the Zeff [14] value and the electron temperature [15]. Reproducible discharges with a similar electron temperature and density were selected to scan the whole detectable wavelength range as the spectrometer covers only 200Å at a time. Data obtained in every 5ms are accumulated to take a good signal-to-noise ratio and the final data were summed up ten temporal frames. The experimentally obtained continuum counts were compared with calculated values as a function of wavelength, which are integrated along the line-of-sight under considerations of the electron and density profiles. The experimental and calculated continuum radiations are shown for the ruled and holographic gratings in Figs.2.9 (a) and (b), respectively. The calculated continuum radiation traced with solid lines, which is normalized to the measured continuum at 312Å, increases with decreasing wavelength because the electron temperature is high. However, the measured continuum for the ruled grating decreases with decreasing wavelength (see Fig.2.9 (a)). It means that the reflectivity of the ruled grating quickly decreases at shorter wavelength range, at least lower than 200Å. In the holographic grating, on the contrary, the measured continuum radiation shows a similar tendency to the calculated one (see
Fig.2.9 (b)), although the experimental data in Fig.2.9 (b) are relatively scattered because of the limited number of discharges which are suitable to spectrometer calibration. The relative sensitivities of the conventional ruled grating and the newly developed holographic grating can be obtained from those data, as shown in Fig.2.10. Both data are also normalized at 312Å. The relative sensitivity is almost flat against the wavelength for the holographic grating, whereas it sharply reduced below 200Å for the ruled grating.
Fig. 2.9 Experimental EUV continuum line integrated intensities (solid circles) with fitting curve (dash line) and estimated EUV continuum (solid line) as a function of wavelength for (a) ruled and (b) holographic gratings.
Fig. 2.10 Variation of relative sensitivities as a function of wavelength for ruled and holographic gratings.
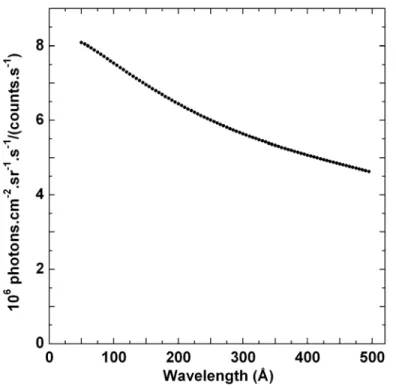
Fig. 2.11 Inverse absolute sensitivity of holographic grating EUV spectrometer as a function of wavelength.
In order to obtain the absolute sensitivity of the EUV spectrometer with the holographic grating the branching ratio method has been applied to the result of the relative sensitivity calibration mentioned above. The branching pair of visible doublet of 5801.33Å (3p 2P3/2−3s 2S1/2) and 5811.97Å (3p 2P1/2−3s 2S1/2) to EUV doublet of 312.42Å (3p 2P3/2−2s 2S1/2) and 312.45Å (3p 2P1/2−2s 2S1/2) lines was used in CIV Li-like ionic sequence. The transition probability values have been taken from online NIST atomic database [16]. These values are 3.17×10⁷ and 4.63×10⁹s-1 for visible and EUV transition, respectively. The visible lines absolutely calibrated with a standard tungsten lamp are measured by a 50cm visible spectrometer with an 1800grooves/mm grating and a CCD detector. The two visible lines of CIV 5801.33Å and 5811.97Å are well resolved and fitted by a Gaussian profile to calculate the total counts of the lines. The contribution of the background counts and their nearby lines is eliminated from the raw data. The CIV doublet of 312.42Å and 312.45Å in the EUV range can not be resolved because of the low spectrometer resolution. The inverse absolute sensitivity of the EUV spectrometer is thus obtained in combination with the branching method and the free-free continuum radiation measurement, as shown in Fig.2.11. The absolute intensity of the EUV emissions can be easily recorded by multiplying the CCD counts by the inverse sensitivity of the figure. The advantage of this method is that the sensitivity curve can be obtained continuously against the wavelength, whereas the branching method gives only scattered values. This method is also applicable to high temperature plasmas with low impurity content.
2.1.5. Summary
Spectroscopic characteristics of newly developed 1200grooves/mm holographic grating used for a flat-field EUV spectrometer, which covers a wavelength range of 50−500Å, have been studied by comparison with a conventional 1200grooves/mm ruled grating. The incidence angle of the grating, critical for optimum spectral resolution, can be accurately determined by moving the CCD detector position and checking the spectral resolution with theoretically calculated focal curves. The best resolution obtained for