Theoretical predictions of the
oscillating mechanism in cyanobacterial
circadian rhythms
Hisako IMAMURA
DOCTOR OF
PHILOSOPHY
Department of Basic Biology
School of Life Science
The Graduate University for Advanced Studies
2007
Table of Contents
page
Table of Contents 1
Chapter I: General Introduction 2
Chapter II: Transcriptional Autoregulation by KaiC 8
Introduction 9
Models 12
Results 16
Discussion 26
Figures and Tables 29
Chapter III: KaiC Phosphorylation Cycle 42
Introduction 43
Models and Results 45
Discussion 55
Figures and Tables 58
Chapter IV: General Discussion 67
Chapter V: Appendices 74
Appendix I 75
Appendix II-A 76
Appendix II-B 81
Appendix III-A 84
Appendix III-B 86
Appendix III-C 88
Chapter VI: References 91
Acknowledgements 99
Chapter I:
General Introduction
All organisms on earth are exposed to the fluctuating environment of the day-night cycle. As a result, organisms including prokaryotes, plants and animals have evolved mechanisms to adjust their physiology, metabolism, and behavior to such environmental changes. Such mechanisms are widely known as circadian clocks (circa = about, dies = a day) and involve endogenous oscillations with a period of about 24 h. The clock allows organisms to anticipate daily changes and to prepare for the right activity at an appropriate timing. This mechanism is energetically economical and remarkably advantageous for reproductive fitness and survival in nature (Lakin-Thomas and Brody, 2004; Young and Kay, 2001). Acquisition and development of the circadian clock has been much focused on as an adaptive strategy in the course of evolution. Moreover, circadian rhythms are fundamental to photoperiodism events involving seasonal breeding, hibernation, and flowering regulation.
In mammals, diverse vital functions such as sleeping, feeding, cardiac rate, blood pressure, hepatic function, body temperature, and hormonal production exhibit circadian rhythms (Foster and Kreitzman, 2004). Especially for humans, the maintenance of the sleep-wake cycle is necessary to organize one's social life. The occurrences of health hazards such as insomnia or depression arising from sleep disorders have increased in recent years (Foster and Kreitzman, 2004). An accurate internal clock is thus crucial in the struggle for survival in both nature and civilized society.
The circadian clock that controls diverse and sophisticated phenomena at an individual level is cell autonomous, and persists in the absence of environmental cues. Molecular biological studies have revealed that the essential mechanisms for these endogenous and self-sustaining rhythms are cyclic expressions of the responsible genes, so called clock genes. In mammals, the rhythms in each neuron are synchronized and amplified in the suprachiasmatic nucleus where
photic entrainment occurs. This master clock regulates endocrine output and orchestrates clocks in peripheral tissues. From the perspective of systems biology, the hierarchical structure of the circadian clock appears an excellent model of the complex systems that result from intercellular interactions.
Taken together, the mechanism of circadian rhythms is an interdisciplinary subject covering physiology, neuroscience, and cellular, molecular, and systems biology. Indeed, its elucidation is driven by the growing social and medical demands.
Another approach for circadian research that can be seen as indispensable is a mathematical one. The earliest model predicting oscillations due to transcriptional negative feedback was proposed by Goodwin (Goodwin, 1965) at a time when the role of such a regulatory mechanism in the origin of circadian rhythms was not yet known. One of the best characterized interactions of clock genes is that of Drosophila, in which the PER/TIM complex indirectly represses transcriptions of period and timeless, by binding to the transcription factor CLOCK protein (Dunlap, 1999). This transcriptional feedback mechanism, together with phosphorylation of clock proteins, is remarkably well conserved in other animals, such as Neurospora, Arabidopsis and mouse, and seems to be a general requirement for self sustaining circadian oscillations (Hardin, 2006; Wijnen and Young, 2006; Young and Kay, 2001). Theoretical studies have confirmed the importance of delayed negative feedback for rhythm generation (Goldbeter, 1995). This portrayal of the transcription-translation feedback oscillator (TTO) has indeed been a dogma in respect to circadian rhythm (Appendix I).
As well as circadian rhythms, mathematical studies have also provided insights into the properties of other biological rhythms (Goldbeter, 2002). The first such application was in ecology to study oscillations resulting from
interactions between prey and predators (Murray, 1989b). In cellular physiology, Hodgkin and Huxley developed a model of neural rhythms, which remains at the core of most models related to oscillating membrane potentials (Keener and Sneyd, 1998). Structural perspectives obtained from mathematical analyses often relate to the general conditions for oscillations and can be applied to other rhythmic phenomena. Investigations of biological rhythms often utilize the store of existing knowledge. Recently, tasks to which mathematical approaches have been applied are increasing. Because of the substantial progress that has been made in molecular biology, the picture of the interacting networks of proteins, RNA and genes that go to make up a biological function is an increasingly exhaustive one. In circadian studies, investigations at the molecular level have revealed multiple coupling networks of feedback loops for which the total behavior is difficult to comprehend (Glossop et al., 1999). In view of the complexity of the associated processes, mathematical analysis and numerical simulations are needed to present a global description of how the network might be organized. As well, these investigations reveal possibilities of being able to suggest novel components or missing connections in the regulatory networks. It is expected that theoretical predictions and experimental identifications will combine to give a clearer understanding of the global mechanism involved, and in return improve mathematical modeling and experimental designs.
Cyanobacteria are thought to have been the first oxygen-evolving photosynthetic organisms on Earth (Ditty et al., 2003). Oxygenic photosynthesis originating in these bacteria is thought to be responsible for changing the prehistoric environment to an oxygen-enriched atmosphere and for creating the ozone layer (Ditty et al., 2003). Photosynthesis in cyanobacteria is repressed rhythmically by the clock, saving unnecessary energy expenditure at night. This
is an adaptive mechanism, as co-culture competition experiments have demonstrated that there is a selective advantage for cells those internal timekeepers are in tune with the rhythms of their environment (Woelfle et al., 2004). The discovery of cyanobacterial circadian rhythms overturned past dogmas that held: (1) that organisms with a cell division time of less than 24 h could not sustain a circadian rhythm, and (2) that prokaryotes could not sustain rhythmicity because cellular complexity and organelles, particularly a membrane-bound nucleus, were required (Kondo et al., 1997; Mori et al., 1996). Moreover, the existence of prokaryotic circadian rhythms enabled simple investigations and observations of the circadian mechanism. For this purpose, Synechococcus elongatus PCC 7942, a genetically tractable strain, was developed as a model organism where circadian rhythms could be visualized by introducing the luciferase reporter system (Kondo et al., 1993).
In S. elongatus, the clock protein KaiC regulates genome-wide expressions including that of kai genes in continuous light conditions (Kondo et al., 1997; Nakahira et al., 2004). This transcriptional autoregulation is consistent with the TTO model (Ishiura et al., 1998). Phosphorylation of the clock protein is proposed to play a critical role in transcriptional regulation in the cyanobacterial clock system (Iwasaki et al., 2002; Nishiwaki et al., 2004; Xu et al., 2004). In Chapter II: Transcriptional Autoregulation by KaiC, I predict how KaiC regulates transcriptional activity depending on its phosphorylated state. I give a theoretical insight into how this mechanism contributes to robust oscillations. The study has been published as “Transcriptional autoregulation by phosphorylated and non-phosphorylated KaiC in cyanobacterial circadian rhythms” in the Journal of Theoretical Biology.
The finding of the circadian cycling of KaiC phosphorylation without
transcription has broken the last dogma regarding the TTO (Nakajima et al., 2005; Tomita et al., 2005). In addition to its chronobiological importance, the non-TTO Kai oscillator is an inspiring theme for mathematical research in terms of oscillations derived from purely biochemical interaction in a closed system. This minimal system seen in cyanobacteria cannot be reproduced by the two-variable framework that I used in Chapter II, which focused on the TTO mechanism. Here, I focus on the significance of the variety of KaiC states. I speculate that some processes among complex formations and possible variations of KaiC phosphorylation would be required for rhythm generation. Indeed, theoretical study has demonstrated that a network comprised of a small number of elements cannot generate oscillations, and that multiple reaction steps allow periodicity (Goldbeter, 1995). In Chapter III: KaiC Phosphorylation Cycle, I examine how non-TTO KaiC oscillations can result from the experimentally observed interactions among the Kai proteins and I predicte the structure of KaiC state transition. I also determine what kind of feedback process controls oscillations in a general closed system. This study has been published as “Predicting regulation of the phosphorylation cycle of KaiC clock protein using mathematical analysis,” in the Journal of Biological Rhythms.
Chapter II:
Transcriptional Autoregulation by KaiC
Introduction
Circadian rhythms maintain cyclic behavior even under constant conditions without environmental cues. This is called free-run, and is primary evidence that circadian rhythmicity is intrinsic and includes self-sustained oscillators. In model organisms such as Drosophila, Neurospora, and mouse, circadian rhythms have been shown to be based on cyclic oscillation at a transcriptional level of the clock genes (reviewed in Dunlap, 1999; Young and Kay, 2001). Clock genes form networks of transcriptional interactions including feedback loops to generate autonomous oscillatory dynamics. This TTO model was applied for understanding the cyanobacterial clock mechanism before the discovery of the non-TTO KaiC phosphorylation cycle. In this chapter a study based on this old view that transcriptional autoregulation by KaiC is responsible for cyanobacterial circadian oscillation is demonstrated.
In the cyanobacterium Synechococcus elongatus PCC 7942, clock genes kaiA, kaiB, and kaiC have been characterized as indispensable clock regulators (Ishiura et al., 1998). The kai genes form a gene cluster, where kaiB and kaiC are co-transcribed as kaiBC mRNA. KaiC plays a central role and exhibits rhythms in transcription, translation, and phosphorylation statuses under continuous light conditions (Iwasaki et al., 2002; Nishiwaki et al., 2000). The other clock proteins KaiA and KaiB modulate KaiC autophosphorylation: KaiA enhances autophosphorylation of KaiC, and KaiB inhibits this action of KaiA (Iwasaki et al., 2002; Kitayama et al., 2003; Williams et al., 2002; Xu et al., 2003).
From the fact that KaiC overexpression consistently reduces the kaiBC promoter activity, it has been considered that KaiC negatively regulates kaiBC
transcription (Ishiura et al., 1998). Contrarily, KaiA positively regulates transcription as KaiA overexpression induces kaiBC transcription in a wildtype strain. KaiA overexpression in the kaiC- strain did not show transcriptional up-regulation, suggesting that KaiC, coupled with KaiA, is involved in the positive limb of transcriptional regulation (Iwasaki et al., 2002). Moreover, KaiC overexpression in a kaiA-inactivated (kaiA-) strain did not repress and instead gradually induced kaiBC expression. KaiA and KaiC appear to regulate kaiBC transcription in a cooperative, but unknown way. Considering the fact that KaiA enhances KaiC phosphorylation, it is suggested that this cooperative regulation is realized by KaiC phosphorylation. Indeed, it was observed that overexpression of the nonphosphorylatable KaiC mutant only transiently represses kaiBC transcription (Nishiwaki et al., 2004). This result provides proof of the existence of the phosphorylation-dependent switch by KaiC.
In this study, I investigated and predicted the possible mechanisms of transcriptional regulation by KaiC in its phosphorylated state to realize circadian oscillation using a mathematical model. Considering the experimental results, phosphorylated and non-phosphorylated KaiC may have different roles in transcriptional regulation. I developed a mathematical model that included concentrations of phosphorylated and non-phosphorylated KaiC, and kaiBC mRNA. I used transcriptional regulation functions that switch their values depending on the amounts of phosphorylated and non-phosphorylated KaiC. I examined all regulation patterns and determined the condition for oscillation by linear stability analysis. First, I determined that there are only two possible patterns in transcriptional regulation that realize circadian oscillation. Second, I verified if the determined conditions could explain the cyanobacterial circadian mechanism, comparing the behavior in computer simulation with the experimentally observed phenotypes. It was suggested that transcriptional
oscillation driven by positive feedback of phosphorylated KaiC is suitable for coupling with the KaiC phosphorylation cycle.
Models
I developed a model that describes interactions in continuous time and states between the clock gene products; kaiBC mRNA, KaiA, KaiB, and KaiC. The kaiBC level and KaiC phosphorylation are known to exhibit oscillation in a circadian fashion; thus I used a three-variable model as follows,
dU
dt = F(N,P) " quU dN
dt = pU " Phos N,P( )" qnN
dP
dt = Phos N,P( )" qpP
, (II-1)
, where U, N, and P are the concentrations of kaiBC mRNA, of non-phosphorylated KaiC (NP-KaiC), and of phosphorylated KaiC (P-KaiC), respectively. Since it has been observed that the amount of KaiA in the cytosol of a single cell remains constant at a low level, and that the amount of KaiB is always proportional to that of KaiC (Kitayama et al., 2003), the three-variable model is suitable to consider the oscillatory behavior of the three clock genes.
In the framework used here, I assumed that kaiBC transcription is regulated by NP-KaiC and P-KaiC. The transcription rate of kaiBC is F(N,P), a function depending on the levels of NP-KaiC and P-KaiC (described later in the subsection). NP-KaiC concentration increases with translation from kaiBC. The rate is assumed to be proportional to the level of kaiBC, and the rate constant is p. Phosphorylation of NP-KaiC increases P-KaiC, and dephosphorylation of P-KaiC increases NP-KaiC. The total change by these reactions is denoted by Phos(N,P), the phosphorylation/dephosphorylation function depending on the concentrations
of substrates NP-KaiC and P-KaiC (described later in the subsection). The concentrations of KaiA and KaiB are assumed to enhance and attenuate phosphorylation, respectively, and are also included in Phos(N,P). The degradation rates of kaiBC, NP-KaiC, and P-KaiC are assumed to be proportional to their concentrations, with their rate constants being qu, qn, and qp, respectively.
F(N,P), The Transcription Function
I assumed that the switching behavior of the transcription function F(N,P) takes a high or low value in a NP-KaiC- and P-KaiC-dependent manner.
The function F(N,P) is based on the transcriptional regulation model developed by Mochizuki, a continuous form of a Boolean network (Mochizuki, 2005). For easier understanding, I show the one-dimensional form of the transcriptional regulation function as following,
F= 1
1+ exp " v # T
[
( )]
(II-2), where v is the concentration of the regulatory protein and T is the threshold for v. When λ is positive, F takes a value about 0 at the condition v>T, and one of about 1 at v<T. As v approaches T, F switches from 0 to 1 (or 1 to 0). When λ is negative, the switching pattern is an inverse of the above. λ also determines the steepness of the transition by its absolute value. Here, I improved the function Eq. (II-2) as follows,
F(N,P) = 1
1+ exp " N cos# + Psin# $ T
[
( )]
(II-3)Now F(N,P) switches when the sign of N cos" + Psin" # T changes. Fig. II-2a shows the two-dimensional space of NP-KaiC and P-KaiC, which is divided in two areas by the straight line of N cos"+Psin" # T = 0. Similarly to F in Eq. (II-2), F(N,P) continuously takes different values from 0 to 1 depending on the distance of (N,P) from the line as shown in Fig. II-2b, where (cos",sin") is a normal vector of the threshold line and T is the distance of the line from the origin. By choosing the value (cos",sin") , the relative influences of NP-KaiC and P-KaiC on transcription can be changed.
Phos(N,P), The Phosphorylation/Dephosphorylation Function
KaiA is known to enhance KaiC autophosphorylation activity, which is very low without KaiA in vitro (Williams et al., 2002). I assumed that KaiC phosphorylation is regulated positively by the concentration of KaiA, and that KaiC’s autophosphorylation rate without KaiA is very small and can be ignored. Using these assumptions, the Michaelis-Menten function can be used for KaiC phosphorylation. It was observed that KaiC alone exhibited autophosphatase activity in vitro; thus, I assumed that P-KaiC is dephosphorylated in proportion to just its concentration.
Although KaiB is known to attenuate KaiC autophosphorylation, the precise mechanism has not been examined. To investigate all possible mechanisms of chemical reactions between Kai proteins, four types of the function Phos that specify the different activities of KaiB were used: (a) KaiB inhibits phosphorylation in a competitive manner, (b) KaiB inhibits phosphorylation in a non-competitive manner, (c) KaiB enhances dephosphorylation, (d) KaiB enhances dephosphorylation, but requires KaiA to do so. KaiB is reported to change the equilibrium state of KaiC phosphorylation only when KaiA is present, in vitro as well as in vivo (Kitayama et al., 2003; Williams et al., 2002; Xu et al., 2003). In
this regard, (a) and (b) seem more plausible than (c). Type (d) is an improved function of (c). All types contain KaiA-enhanced phosphorylation and spontaneous dephosphorylation of KaiC. The details and the formulae are shown in Appendix II-A.
Results
Analysis
I investigated the conditions of gene regulation to generate oscillation using linear stability analysis of the model. The equilibria of the model and the condition of the destabilization by Hopf bifurcation were determined numerically (Appendix II-B) changing parameters in the transcription function, the phosphorylation/dephosphorylation function and other parameters in Eq. (II-1). I confirmed that the dynamic trajectory of this model shows oscillation for all the parameter sets satisfying the conditions for Hopf bifurcation.
Fig. II-3 shows the conditions for generating oscillation on the two-dimensional parameter space, where the horizontal axis is the angle of the threshold line of transcriptional switching, and the vertical axis is the phosphorylation rate. I used type (b) Phos in this analysis. The figure shows that the instability causing the cyclic behavior is observed only in very restricted conditions on the two-dimensional space. There are two regions separated along the horizontal axis of the transcriptional pattern, suggesting that there are two distinct mechanisms.
In one region, P-KaiC induces transcription, and in the other, P-KaiC represses transcription. Transcriptions in both the regions slightly depend on the NP-KaiC concentration. Fig. II-4 illustrates the functional schemes of the two distinct regulation patterns derived from the conditions of the parameter sets in the two regions. I call the former picture the Transcriptional Activation Model (TAM) and the latter the Transcriptional Repression Model (TRM). TRM is easy to understand. It follows the principles of self-repression typically used for understanding the circadian clocks of various species (Hardin et al., 1990).
On the other hand, TAM does not include self-repression of transcription and is regulated positively by KaiC. This model may be contrary to intuition. However, the dynamics following this model can generate stable periodic oscillation in computer simulations, and show some rather favorable properties to explain the experimentally observed phenomena than the counterpart model. In fact, it may be possible to understand this model by focusing on the dephosphorylation enhanced by KaiB, which is co-expressed with KaiC, and may act as the regulator of indirect negative feedback. To realize this picture of
"indirect negative feedback", the phosphorylation and dephosphorylation process should be far from equilibrium, and may show strong oscillations in the dynamics of circadian rhythms.
Fig. II-5 shows dynamic changes in the net phosphorylation rate Phos, which includes both the phosphorylation and, its inverse, the dephosphorylation processes. In TAM, the amplitude of Phos is large and the value changes from positive to negative in dynamic oscillation. The large dephosphorylation rate in TAM enables Phos to take a negative value depending on the KaiB level. A positive Phos means that the phosphorylation rate is larger than the inverse process, while a negative Phos means the opposite situation. The alternation of phosphorylation-dominant and dephosphorylation-dominant phases is observed only in TAM. The period of this alternation synchronizes with oscillation of the whole dynamic system. In TRM, Phos takes only a positive value and its amplitude is small. This suggested that big changes in Phos are not necessary in TRM.
Fig. II-3 also shows the difference in phosphorylation rates between the models. The phosphorylation rate in TAM distributes higher values on average than TRM. The same property in the phosphorylation rate was observed even
when I used different types of phosphorylation functions. The exceptions were the case when I used type (a) or (d) (Table II-1), where I did not observe oscillation of TAM.
Fig. II-6 shows examples of the dynamic trajectory of NP-KaiC and P-KaiC and the nullclines of dP/dt and F(N,P) in the space of NP-KaiC and P-KaiC in typical TAM (Fig. II-6a) and TRM (Fig. II-6b). In TRM, anticlockwise-oscillation appears around the region where the nullcline of dP/dt increases with NP-KaiC. In TAM, on the other hand, clockwise-oscillation appears around the region where the effect of substrate density on phosphorylation is saturated and the nullcline of dP/dt decreases with NP-KaiC from the dephosphorylation effect of KaiB (proportional to N+P). The difference in the shape of the Phos nullcline corresponds to the difference in the rate of phosphorylation. The phosphorylation rate in TRM needs to be low to generate oscillation. The phosphorylation rate in TAM needs to be high.
Computer Simulation
I numerically analyzed the models by computer simulation to confirm the results of linear stability analysis. The simple explicit difference method was used for calculations of differential equations Eq. (II-1). Fig. II-7 shows typical dynamic changes of the gene products, where the same parameter values were used as in Fig. II-5. The horizontal axis is time and the vertical axis is the concentrations of kaiBC, NP-KaiC and P-KaiC. The dynamic changes obtained from type (c) Phos exhibited oscillation around the equilibrium shown in Fig. II-5. The kaiBC level, total amount, and the phosphorylation level of KaiC repeatedly rise and fall with periodicity (Fig. II-7), as in cyanobacteria. All the dynamics showed periodic oscillations in the computer simulation when the parameter values
satisfied the condition of instability determined in the previous section. The only exceptional weak result was the case when type (b) Phos was used. In this case, dynamic changes calculated by simulation showed very low amplitude of the P-KaiC oscillation under conditions where oscillation was expected from the concept of TAM. In TRM, similar oscillation patterns were obtained using any type of Phos.
In TAM, the transcription phase is in phase with that of phosphorylation, contrary to the experimental result (Fig. II-7a). On the other hand, TRM generates realistic oscillations in terms of the transcription phase pattern, phosphorylation and the total amount of KaiC protein (Fig. II-7b).
It is known that KaiC phosphorylation is very slow process. In vitro autokinase assay revealed that KaiC is autophosphorylated from 40 % to 80 % after 6 hours of incubation with KaiA (Tomita et al., 2005). This low phosphorylation rate is a characteristic property of a kai oscillator. In the computer simulation, the phosphorylation rate was shown to be low in both models, at least in all the parameter sets I used. To keep the oscillation period to 24 h, both models can generate oscillations with very low phosphorylation rates (data not shown).
Experimental studies such as overexpression and deletion of kai genes have been carried out to investigate their effects on the transcriptional regulation of kaiBC (Ishiura et al., 1998; Iwasaki et al., 2002). Many period mutants showing longer or shorter periods have been observed and their mutated locus and functional differences identified (Xu et al., 2003). I could simulate the metabolic changes of these mutations by controlling variables or parameter values in a computer simulation. I compared behavior in TAM and TRM with these observed phenotypes, and tested which model could better explain the behaviors of mutants (Table II-2). For each model, I used sets of parameter values for which
the model generated typical periodic oscillations.
~KaiC disruption and overexpression~
It is reported that KaiC overexpression repressed kaiBC expression to a trough level of oscillation in an intact cell (Ishiura et al., 1998). The effect of KaiC overexpression was simulated by substituting U+ u for U in dN/dt. The differential equation then becomes;
dN
dt = p(U + u) " Phos N,P( )" qnN (II-4)
, where u is an increase of kaiC by overexpression. I determined the u value so that it increased KaiC (N+P) to 10 ~ 100 times larger than the original in the computer simulation. By overexpression, NP-KaiC greatly increased though P-KaiC increased only a little. This was because the phosphorylation rate that is increasing with KaiC saturates and reaches a finite value, and KaiC’s turnover increases rather linearly with KaiC without saturation. In TAM, the result depended on a small difference in transcription pattern. When NP-KaiC induced transcription, the kaiBC level abolished oscillation and took a minimal value from kaiC overexpression. In this case, the transcriptional threshold at the high NP-KaiC value was very high for P-KaiC, and transcriptional repression lasted continuously. When NP-KaiC did not affect on transcription in TAM, the kaiBC level is kept oscillating in a large amplitude by kaiC overexpression. In TRM, the kaiBC level took a minimal value from kaiC overexpression, regardless of the switching pattern of transcription.
Next, I examined the kaiC- mutant, which can be simulated by fixing N and P to zero in a computer simulation. It is reported that the kaiC- mutant reduces kaiBC
expression to ~20 % of the wildtype strain (Iwasaki et al., 2002). The kaiBC level abolished oscillation and took small and maximal values in TAM and Transcriptional Repression Model, respectively. These results suggested that TAM successfully explains the function of KaiC.
~KaiA inactivation and overexpression~
The kaiA- mutant can be simulated by fixing the KaiA activity rate to zero in numerical calculation. The result of TAM and TRM showed the minimal and the maximal level of kaiBC expression, respectively. KaiA overexpression was simulated by increasing the KaiA activity rate ka during the dynamic change. Both models showed the maximal and minimal kaiBC levels, respectively. These results indicated that KaiA-mediated induction of kaiBC can be explained by TAM, but cannot be explained by TRM. Experimental studies have shown that KaiA-mediated activation of kaiBC is KaiC dependent (Iwasaki et al., 2002). In TAM, KaiA overexpression in the kaiC- mutant did not induce kaiBC expression differently from KaiA overexpression in wildtype, showing that this model explained the KaiA effect depending on KaiC.
KaiA-KaiC cooperation has also been investigated by examining KaiC overexpression in the kaiA- mutant (Iwasaki et al., 2002). The phenotype of kaiA- showed severely repressed kaiBC expression, and KaiC overexpression in this mutant cells showed slow and slight increase of kaiBC expression. This result is consistent with the fact that overexpression of the non-phosphorylatable KaiC mutant transiently represses and gradually increases transcription (Nishiwaki et al., 2004). In the computer simulation of TAM, both wildtype overexpression of the kaiA- strain and KaiC mutant overexpression resulted in a minimal level of transcription, indicating that this model does not perfectly explain cooperative KaiA-KaiC functions. TRM failed to explain transcriptional repression by the
kaiA- mutant.
~KaiB disruption~
The kaiB-disrupted (kaiB-) mutant was simulated by fixing the KaiB activity rate (kb in type (c) Phos and kn in type (b) Phos) to zero. In TRM using type (b) or (c) Phos, KaiB disruption did not cease the oscillations. Using type (a) or (d), the dynamics of kaiBC converged to a static state at an intermediate value when the KaiB activity rate was fixed to zero. These results were inconsistent with the observed phenotype. In TAM, on the other hand, kaiBC oscillation stopped and converged to a static state at the maximum value in the computer simulation of the kaiB- mutant. This seemed e consistent with the actual phenotype of kaiB-, which exhibited a slow increase of kaiBC level. The persistence of oscillation under the kaiB-disrupted condition observed in TRM suggested that KaiB is not essential in this model.
~Period mutants~
I investigated the effect of increases or decreases in parameter values on the oscillating period (Fig. II-8). It is reported that the kaiA2 mutation in kaiA (the A30a strain) shows a 70 % reduction of KaiC phosphorylation (Iwasaki et al., 2002), and causes a longer period, to ~30 h (Ishiura et al., 1998). The kaiB2 mutation in KaiB (the B22a strain) exhibits short period phenotype (Ishiura et al., 1998), by decreasing the negative effect on KaiC phosphorylation (Xu et al., 2003). It is reported that in the C22a (kaiC1 mutation) and C55a strains, NP-KaiC is degraded quickly and slowly, and exhibits 22 h and 55 h period phenotypes, respectively (Ishiura et al., 1998). Half-lives of non-phosphorylated KaiC are 8.8 h, 6.7 h and 13.9 h in wildtype, C22a and C55a, respectively; though P-KaiC stability was at a the similar level in all strains (Xu et al., 2003).
In TRM using type (a) Phos, all these period mutant phenotypes were realized by computer simulation. Fig. II-8b shows the effect of the KaiA activity rate ka that shortens the period as it increases. Decreasing ka from 100 to 70, the period became 1.36 times longer. This result seemed consistent with the A30a phenotype, exhibiting a period 1.25 times longer than the wildtype strain. In this model, a decrease in the KaiA activity rate seemed to lead to a delay in the negative effect from P-KaiC, resulting in a longer period. Fig. II-8d shows the effect of the KaiB activity rate kc that lengthens the period as it increases. This result was consistent with the experimentally observed phenotype of the B22a strain. A similar result was obtained using type (d) Phos, but not when using types (b) or (c), which do not have dynamic regulation by KaiB. Thus changing the KaiB activity rate had no effect on the period (data not shown). Fig. II-8f shows the effect of the NP-KaiC degradation rate qn that shortens the period as it increases. The degradation rate of NP-KaiC in the C22a and C55a strains can be calculated from the half-lives of NP-KaiC in these strains; rates were 131 % and 63 %, respectively, of wildtype KaiC. I examined the period in TRM using qn=0.131 and 0.063, and obtained a period 0.95 and 1.07 times, respectively, longer than in the model using qn=0.1. In TRM, the effect of qn on the period can be explained qualitatively, but not quantitatively.
In TAM, the effect of the activity rates of KaiA and KaiB, and that of the KaiC degradation rate cannot be realized with a wide range of parameter values; though they may be realized in limited parameter conditions. Fig. II-8a shows the effect of ka that lengthens the period as it increases. The period may become shorter as the KaiA activity rate increases, but only in limited conditions (Fig. II-8a). Fig. II-8c shows the effect of the KaiB activity rate kb. When NP-KaiC did not affect on transcription, kb shortened the period as it increases. When the ratio of P-KaiC and NP-KaiC regulates transcription, decreasing the KaiB effect
shortens the period, thus explaining the effect of the KaiB mutation on the period. Fig. II-8e shows the effect of the NP-KaiC degradation rate qn that shortens the period as it increases. I examined the period in TAM using qn=0.262 and 0.126, and obtained periods 0.91 and 1.21, respectively, times as long as the model using qn=0.2 (Fig. II-8e). The effect of qn on the period can be explained better in TAM than in TRM.
~Disruption by cell division or cell elongation~
It has been reported that rapid cell division and chromosome duplication occur within one circadian period in cyanobacteria, breaking the paradigm of biological clocks (Kondo et al., 1997). I investigated if sustained oscillations in my models could continue when the amounts of KaiA, KaiB, and KaiC were reduced during oscillation in a computer simulation. It was observed in TAM that oscillations persisted after the reduction of Kai proteins (Fig. II-9a), shifting the orbit of the cycle within the variable space of the dynamics (Fig. II-9c). When the same parameter set as used in Fig. II-5 was used, even 90 % reduction did not interrupt oscillations in TAM. Moreover, a 50 % reduction barely affected on the oscillating period, resulting in >92 % of the original period, suggesting that TAM was robust against fluctuations of protein concentrations (Fig. II-9b). On the other hand, oscillation in TRM was attenuated by a reduction of Kai >25 %, indicating that this model was less robust than the other model (Fig. II-9d). Furthermore, the oscillation period was vulnerable in this model, which was extended to 113 % by 20 % reduction (Fig. II-9b). Similar results were observed for each model with the other parameter sets I tested (data not shown).
These results can be explained considering the intersection of the line of the transcriptional threshold and that of the nullcline of dP/dt (Fig. II-9c and 9d). The transcriptional threshold is not affected by the change in the concentrations of Kai
proteins. The nullcline of dP/dt changed its shape mainly along the vertical axis with changes in the concentration of KaiA. In TAM, where the transcriptional threshold increased with NP-KaiC concentration, the change in the shape of the dP/dt nullcline altered the position of the intersection. However, the angle of the lines governing the dynamics at the intersection did not change even with a wide range of protein concentrations. In TRM, however, where the transcriptional threshold was parallel to the NP-KaiC concentration, the angle of the nullclines at the intersections changed with changes in protein concentrations. When the reduction of Kai proteins was large enough, the transcriptional threshold and the nullcline of dP/dt did not intersect in this model.
The robustness of TAM against Kai concentrations suggested that this model was more likely to express the actual mechanism of the cyanobacterial circadian clock than TRM.
In conclusion, it was revealed that TAM reproduced most phenotypes in cyanobacteria, suggesting that for the most part KaiA, KaiB, and KaiC work properly. However, TRM reproduced only half of the phenotypes observed in the experimental studies.
Discussion
In this study, I developed a dynamic model of the kai TTO mechanism and numerically examined its behavior. It was demonstrated that there were only two possible transcriptional regulations generating oscillations of the kai genes: TAM and TRM. The former provides a picture of the network generating circadian oscillations, where transcription is induced positively by the gene products and does not include direct negative feedback regulation.
The mathematical framework in this chapter never explained the non-TTO KaiC phosphorylation cycle, which corresponds to the situation where the transcription and degradation rates (F(N,P), qn, and qp) equal zero (data not shown). Meanwhile, under natural conditions, cyanobacteria utilized Kai oscillators both in daylight and after dark, suggesting that the TTO and non-TTO cycles coexist in cyanobacteria. Thus, transcriptional regulation should be compatible to the KaiC phosphorylation cycle in terms of phosphorylation dynamics. Fig. II-5a shows that Phos oscillates in a large amplitude and takes positive and negative values in turn in TAM. The negative value of Phos indicates the dephosphorylation phase. The P-KaiC/NP-KaiC ratio also oscillates in a large amplitude in this model (Fig. II-7a). Accordingly, TAM is more likely to be involved in non-TTO KaiC phosphorylation. In TRM, Phos always takes a positive value (Fig. II-5b) and P-KaiC stays at about the same level (Fig. II-7b).
The inhibitor-activator oscillatory model gives us the simplest concept of oscillatory structures. In TAM, P-KaiC and KaiB can be recognized as activator and inhibitor, respectively. P-KaiC induced kaiBC transcription and consequently
increased KaiB and itself. KaiB attenuated KaiC phosphorylation, resulting in transcriptional repression. TRM can also be compared to the inhibitor-activator model by inversely interpreting the players.
The presence and the function of positive feedback in circadian rhythms have been discussed in experimental studies and mathematical models (Allada, 2003; Preitner et al., 2002). In Drosophila, Pdp-1 is activated by CLK, and PDP-1 in turn activates Clk. This positive feedback loop is suggested to allow for multiple inputs and outputs at different phases (Allada, 2003). In a mammalian circadian oscillator, the heterodimer BMAL1/CLOCK activates transcription of the Per, Cry, and Rev-erbα genes. PER and CRY form a complex with CKIε/δ and inhibit REB-ERBα synthesis repressing Bmal1 transcription. This process contributes to the robustness of the clock (Preitner et al., 2002). In both cases, positive feedback regulation works in combination with some other mechanisms including negative feedbacks, suggesting that positive feedback may act as the supporting mechanism to stabilize periodic behavior. On the other hand, TAM did not include direct negative regulations. This result proved that positive feedback itself can be the responsible mechanism for generating periodic oscillation.
Though type (d) Phos function is an improved version of type (c), there is a large difference in terms of the dephosphorylation dynamics. In type (d), both phosphorylation and dephosphorylation processes require KaiA. As NP-KaiC accumulated, the dephosphorylation rate decreased because NP-KaiC enhanced phosphorylation and depleted KaiA. The oscillation in TAM required a high dephosphorylation rate when NP-KaiC concentration was high, and thus was impossible by type (d), but possible by type (c).
In Neurospora and Drosophila, the stability of the clock proteins, Period and
Frequency, is modulated by their rhythmic phosphorylation to fit circadian rhythms (Young and Kay, 2001). Though the effect of KaiC phosphorylation on its stability remains unclear, there are some reports on the correlation between phosphorylation status and KaiC stability (Imai et al., 2004; Xu et al., 2003). Xu et al. suggested that the stability of P-KaiC is lower than that of NP-KaiC, using a transient KaiC overinducer in the kaiC- strain. On the other hand, Imai et al. reported that KaiC degradation is suppressed during the mid-subjective night, when P-KaiC is highly accumulated. I examined the importance of NP-KaiC and P-KaiC stability separately by determining the qn and qp values that can generate oscillation using type (c) Phos (data not shown). It was revealed that oscillation in TAM depended on the stability of NP-KaiC, which is not important in TRM. As well, the stability of P-KaiC should be lower in TRM than in TAM. In the latter, where P-KaiC-induced KaiB expression indirectly represses transcription, NP-KaiC and P-KaiC should be stable until they induce KaiB expression to generate oscillation. Meanwhile in TRM, where P-KaiC directly repressed transcription, P-KaiC should be degraded quickly to avoid convergence to the attractor. No tendency was observed in qn/qp in both models.
TAM is expected to reflect the actual mechanism generating transcriptional oscillation. At the same time, the limitations of this model were clearly shown. The difference in the phosphorylation level of KaiC was not sufficient to explain circadian oscillation in cyanobacteria; other unknown factors have to be included to explain all the observed behavior of transcriptional regulation.
KaiC KaiC
KaiA
KaiB
kaiBC
P
Fig. II-1
Schematic view of transcription/translation-based autoregulatory loop of the kai oscillator in cyanobacterial circadian rhythms. KaiC has autokinase and autophosphatase activities. The genes of kaiB and kaiC form an operon, and kaiBC mRNA, KaiB and KaiC protein accumulates in a circadian fashion in free-running conditions. KaiA enhances KaiC phosphorylation, while KaiB antagonizes the actions of KaiA. KaiC phosphorylation also shows circadian oscillation. KaiC had been thought as negative regulator of kaiBC transcription. However, it has revealed recently that it may regulate transcription both positively or negatively.
NP-KaiC concentration (N)
switch on
switch off
a
b
Fig. II-2
Examples of transcriptional functions w hen transcription is controlle d by nonphosphorylated KaiC (NP-KaiC) and phosphorylated KaiC (P-KaiC). Transcription is active (On) when NP-KaiC and P-KaiC are less abundant, and inactive (Off) when both are abundant. (a) Threshold of transcriptional switching, which is determined by a line Ncosθ +Psinθ -T=0, is plotted on the two-dimensional space of the NP-KaiC concentration (N), the P-KaiC concentration (P). (b) The transcriptional level F(N,P) is plotted as a function of the two-dimensional space. F(N,P) switches continuously near the threshold.
0 1 2 3
switching pattern NP-KaiC P-KaiC
Fig. II-3
The result of linear stability analysis using type (c) Phos. The horizontal axis is θ, the angle of the threshold line of transcriptional switching, and the vertical axis is ka, the phosphorylation rate. The θ specifies patterns of the transcriptional regulation, which are shown schematically below the horizontal axis. Along the horizontal axis, the regulation changes continuously; effects of NP-KaiC and P-KaiC are positive or negative. Open circles indicate conditions of the transcription and phosphorylation rates where oscillation never occurs, and filled circles indicate where oscillation can occur. In this analysis, we assumed that qn=qp. The result was obtained when λ=5, 0<θ<2π, -15<T<15, qu=1, 0.05<qn<.8, 5<p<80, 1<ka<103, 10-3<kb<1, km=0.1, kmb=0.1, kd=0.
KaiC KaiC
KaiA
KaiB
kaiBC
P
a
b
Fig. II-4
Functional schemes of two models corresponding to the parameter regions producing the cyclic behaviors shown in Fig. II-3. (a) The Transcriptional Activation Model, where P-KaiC induces kaiBC transcription. NP-KaiC does not affect on transcription, or has a small effect of repressing transcription. The phosphorylation rate ka and the non- competitive inhibition rate kn are high. (b) The Transcriptional Repression Model, where P-KaiC represses kaiBC transcription. NP-KaiC induces transcription weakly, or does not affect on transcription. The KaiA activity ka and the non-competitive inhibition rate kn are low.
time 10
5 0 -5 -10 10 5 0 -5 -10
time
Fig. II-5
Example of temporal changes in Phos. The horizontal axis is the time and the vertical axis is the Phos value. (a) The Transcriptional Activation Model. The Phos changes periodically. The amplitude is large and takes positive and negative values. The result was obtained when qu=1, p=20, qn=0.2, qp=0.2, λ=-5, θ=3/4π, T=1, ka=50, km=0.14, kb=1.6, kmb=0.14, kd=0. (b) The Transcriptional Repression Model. The Phos shows periodic oscillation, though the amplitude is small and the value is always positive. The result was obtained when qu=1, p=20, qn=0.2, qp=0.2, λ=5, θ=π/2, T=15, ka=6, km=5, kb=.01, kmb=10, kd=0.
a
b
NP-KaiC concentration (N)
NP-KaiC concentration (N)
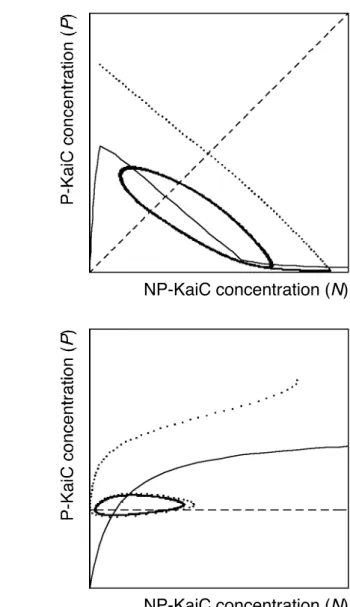
Fig. II-6
Examples of dynamical changes of NP-KaiC and P-KaiC (dotted lines) using type (c) Phos. The horizontal axis is the NP-KaiC concentration (N) and the vertical axis is the P- KaiC concentration (P). Solid curves are the nullclines of dP/dt, dashed straight lines are the transcriptional thresholds. The parameter values are shown in Fig. II-5. (a) In the Transcriptional Activation Model, the dynamical trajectory shows clockwise cycle on the NP-KaiC and P-KaiC space. Transcription is active (on) above the threshold and inactive (off) below the threshold. (b) In the Transcriptional Repression Model, the dynamical trajectory shows anticlockwise cycle on the NP-KaiC and P-KaiC space. Transcription is inactive (off) above the threshold and active (on) below the threshold.
a
b
time
time
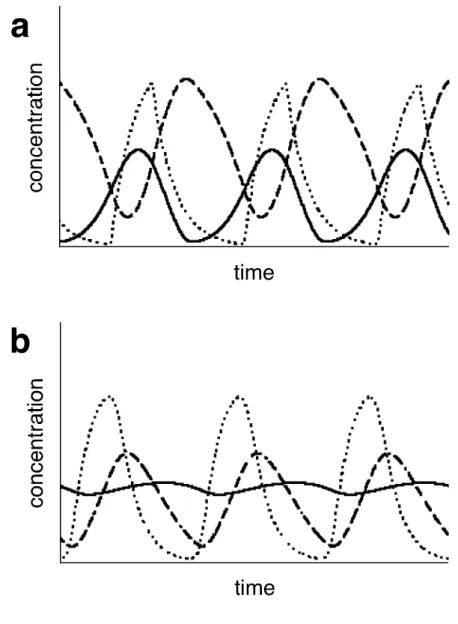
Fig. II-7
Example of temporal changes of kaiBC, NP-KaiC and P-KaiC. The horizontal axis is the time and the vertical axis their concentration. Dotted lines, kaiBC; dashed lines, NP- KaiC; solid lines, P-KaiC. (a) The Transcriptional Activation Model. (b) The Transcriptional Repression Model. The parameter values are shown in Fig. II-5.
a
b
a b
c
200 1000 1500
e
1 2
10 20
Fig. II-8
Effects of parameter values on period. The vertical axis is the relative length of oscillation period compared to wildtype shown in Fig. II-7. The period 0 means that oscillation does not occur using the parameter value. The horizontal axis is the changes in KaiA activity ka ((a) and (b)), KaiB activity kb ((c) and (d)), and the KaiC degradation rate qn ((e) and (f)). (a), (c), (e) The Transcriptional Activation Model of type (c) Phos. Filled circle, parameter values shown in Fig. II-5; open circle, same as filled circle except for θ=π/2, T=2; open triangle, same as filled circle except for λ=-5, θ=π/2, T=18. (b), (d), (f) The Transcriptional Repression Model of type (a) Phos. The result was obtained when qu=1, p=20, qn=0.2, qp=0.1, λ=5, θ=π/2, T=18, ka=100, km=1, kc=10, kd=0.1.
reduction (%) time
NP-KaiC concentration (N) NP-KaiC concentration (N)
c d
a
b
Fig. II-9
Computer simulation of the disruption of protein concentration by cell division or cell elongation in the Transcriptional Activation Model. The original parameter values are the same as shown in Fig. II-5. (a) Example of temporal changes of kaiBC, NP-KaiC and P- KaiC in the Transcription Activation Model. The horizontal axis is the time and the vertical axis their concentration. Dotted lines, kaiBC; dashed lines, NP-KaiC; solid lines, P-KaiC. The KaiA, KaiB and KaiC concentrations were reduced to 50 % (arrows). (b) Effects of reduction of the Kai protein concentrations on period. The vertical axis is the relative length of oscillation period compared to original condition. The period 0 means that oscillation does not occur using the parameter value. The horizontal axis is the reduction of the protein concentrations. Open circle, the Transcriptional Activation Model; filled circle, the Transcriptional Repression Model. (c, d) Examples of dynamical changes of NP-KaiC and P-KaiC (dotted lines). The horizontal axis is the NP-KaiC concentration (N) and the vertical axis the P-KaiC concentration (P). Dashed straight line is the transcriptional threshold and transcription is active (on) above the threshold and inactive (off) below the threshold. The solid curve is the nullclines of dP/dt, and the dashed curve the nullclines of dP/dt after 50 % reduction of the concentrations of the Kai proteins. (c) The Transcriptional Activation Model. The dynamical trajectory shifts to the smaller circle after reduction of the protein concentrations. (d) The Transcriptional Repression Model. The nullclines of dP/dt no longer intersect the transcriptional threshold after the 50 % reduction and the system converges to a steady state at (N,P)=(88.4, 11.5).
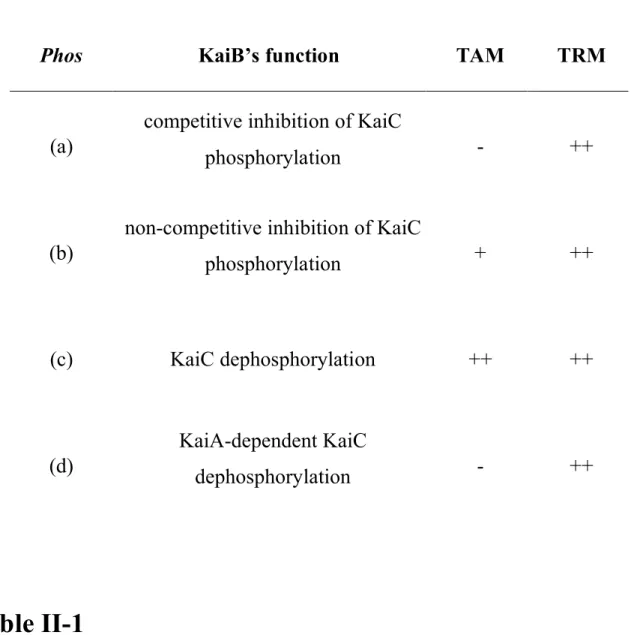
Table II-1
The dependency of periodic oscillations on the formulae of phosphorylation functions. The results were obtained by linear stability analysis. I used four types of Phos depending on the assumptions made for KaiB’s function, and analyzed if oscillations in the Transcriptional Activation Model (TAM) and the Transcriptional Repression Model (TRM) can occur. ++, oscillation can occur; +, oscillation can occur, though the amplitude of P-KaiC is very small in the computer simulation; -, oscillation cannot occur.
Phos KaiB’s function TAM TRM
(a)
competitive inhibition of KaiC
phosphorylation - ++
(b)
non-competitive inhibition of KaiC
phosphorylation + ++
(c) KaiC dephosphorylation ++ ++
(d)
KaiA-dependent KaiC
dephosphorylation - ++
effectors observed effect TAM TRM
kaiA- repress transcription
and abort oscillation ++
−
kaiB- abort oscillation and
induce transcription ++
−
kaiC- repress transcription
and abort oscillation ++
−
OX-kaiA induce transcription
and abort oscillation ++
−
OX-kaiA in kaiC- no effect on kaiC-
phenotype +
−
OX-kaiC repress transcription
and abort oscillation + ++ OX-kaiC in kaiA- slightly induce
transcription
− ND
OX-nonphosphorylatable kaiC mutant
transiently repress and gradually induce
transcription
− −
KaiA activity rate shorten the period − ++
KaiB activity rate lengthen the period + ++
KaiC degradation rate lengthen the period ++ ++
Table II-2
Summary of the experimentally observed phenotypes, and the results of computer simulation of kai mutants, and overexpression studies. kaiA-, kaiA-inactivated mutant; kaiB-, kaiB-disrupted mutant; kaiC-, kaiC-disrupted mutant; OX, overexpression. ++, the phenotype is realized; +, the phenotype is realized depending on the parameter condition; −, the phenotype cannot be realized; ND, not determined; TAM, the Transcriptional Activation Model; TRM, the Transcriptional Repression Model. The effect of OX-kaiC in kaiA- in TRM is not determined, because the phenotype of kaiA- cannot be explained in TRM.
Chapter III:
KaiC Phosphorylation Cycle
Introduction
It has been demonstrated that the KaiC phosphorylation cycle persists even under continuous dark conditions when transcription and translation have almost ceased (Tomita et al., 2005). Since cyanobacteria are photosynthetic bacteria, their metabolic rate under dark conditions appears to be lowered severely. Under such conditions, cyanobacteria maintain their clocks using the transcription-less KaiC phosphorylation cycle. The KaiC phosphorylation cycle was reconstituted in vitro using a minimal cocktail of three recombinant proteins with ATP. The period of the in vitro oscillation is temperature compensated, and the periods observed in vivo in KaiC mutant strains were consistent with those measured in vitro (Nakajima et al., 2005). These results indicated that KaiC phosphorylation is the molecular timer for the circadian rhythms of cyanobacteria. The in vitro oscillator is thus the best available system for providing insight into the molecular mechanisms of the circadian system with chemical resolution.
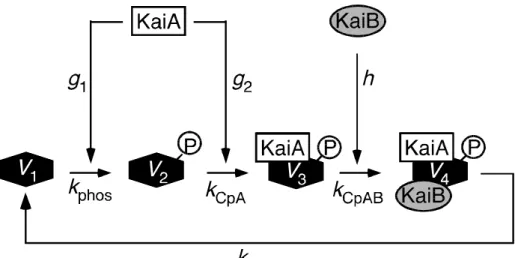
The striking finding of in vitro KaiC phosphorylation cycle confirmed that the interaction between Kai proteins generates the cycle, although the specific mechanism that drives the clock remains unclear. It is reported that KaiC exhibits the periodic interaction with KaiA and KaiB in vivo (Fig. III-1) (Kageyama et al., 2003; Kitayama et al., 2003). After phosphorylation, KaiC associates with KaiA, and subsequently with KaiB to form a larger complex. As time progresses, the KaiA-KaiB-KaiC complex dissociates and KaiC is dephosphorylated. These interactions would relate to the regulation of periodic KaiC phosphorylation.
The aim of this chapter is to elucidate the mechanism of the KaiC phosphorylation cycle, where the total amount of KaiC is conserved; however, its status changes periodically. I first present an observation-based model that I call
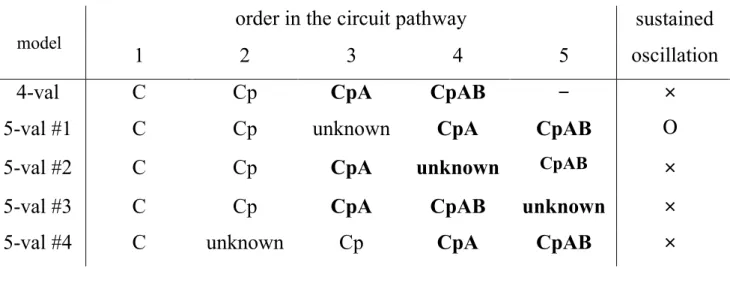
the basic model. As this model did not show oscillations, I analyzed generalized models and determined conditions of the structure for generating oscillations in a closed system. Based on the theoretical results, I improved the basic model and developed five-variable models, one of which successfully explains the KaiC phosphorylation cycle. I realized the observed pattern of the KaiC phosphorylation cycle and predicted an unknown state that lies between KaiC phosphorylation and the formation of the KaiC/KaiA complex.
Models and Results
Basic model
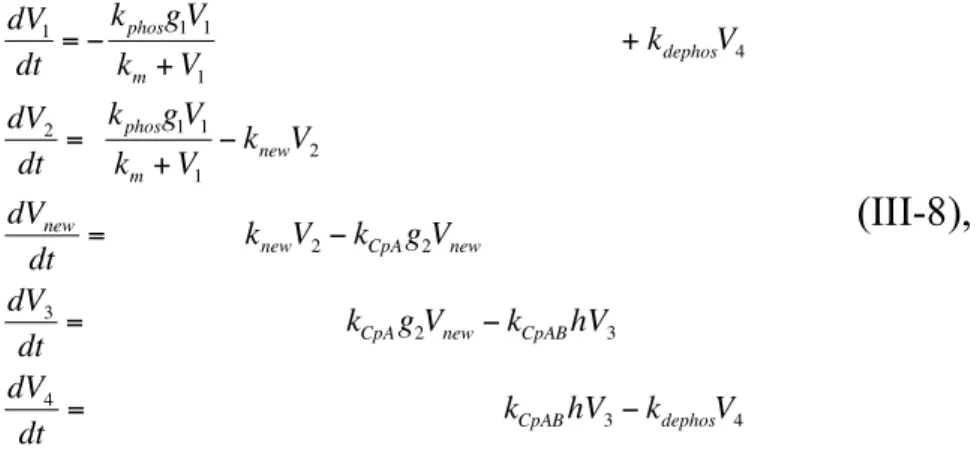
Based on the possible KaiC behavior proposed by Kitayama et al. (Kitayama et al., 2003), I developed a mathematical model for the KaiC phosphorylation cycle in vitro (Fig. III-1). KaiC phosphorylation is regulated by KaiA, which is suggested to form two types of complexes; P-KaiC/KaiA and P-KaiC/KaiA/KaiB. With increases in the concentrations of these complexes, the concentration of free KaiA molecules decreases. Based on this fact, I hypothesized that negative feedback from the complex formations to KaiC phosphorylation, which is mediated by the decrease in free KaiA concentration, is responsible for the KaiC phosphorylation cycle. I developed a four-variable model as follows,
dV1
dt
="
kphosg1V1
km V1
+k
dephosV4
dV2
dt
=
kphosg1V1
km V1
" kCpAg2V2
dV3
dt
= k
CpA g2V2" kCpABhV3
dV4
dt
= k
CpABhV3" kdephosV4
(III–1a),
gi= a " [KaiA - containing complex] " s[P - KaiC/KaiA/KaiB complex] " ai h = b " [P - KaiC/KaiA/KaiB complex]
(III–1b),
where V1, V2, V3, and V4 are the concentrations of non-phosphorylated KaiC (NP-KaiC), phosphorylated KaiC (P-KaiC), the P-KaiC/KaiA complex, and the P-KaiC/KaiA/KaiB complex, respectively. km, kphos, kCpA, kCpAB and kdephos are the
Michaelis constant, the rate for KaiC phosphorylation, the P-KaiC/KaiA complex formation, the P-KaiC/KaiA/KaiB complex formation and dissociation/dephosphorylation, respectively. gi and h denote the effects of free KaiA and KaiB molecules, respectively. g1 represents the negative feedback from complex formation to KaiC phosphorylation via KaiA.
~Details of the model and assumptions~
Based on the observation that the KaiC autophosphorylation rate is very low in the absence of KaiA (Williams et al., 2002), I assumed that KaiC phosphorylation requires KaiA and so used the Michaelis-Menten function for this reaction. I assumed that KaiB does not affect KaiC phosphorylation; however, the effect of KaiB on the phosphorylation rate of KaiC is indirectly included via dephosphorylation. Based on the observation that the KaiC dephosphorylation phase and the formation of P-KaiC/KaiA/KaiB start simultaneously (Kitayama et al., 2003), I ignored the rate for dephosphorylation of free P-KaiC (V2), and assumed that KaiC dephosphorylation occurs simultaneously with the dissociation of the P-KaiC/KaiA/KaiB complex. In this model, an increase of KaiB accelerates the formation of the P-KaiC/KaiA/KaiB complex followed by KaiC dephosphorylation, which negates the phosphorylation rate. At the same time, the effects of KaiA and KaiB on the dephosphorylation rate of KaiC are indirectly included; KaiB does not enhance dephosphorylation in the absence of KaiA in the model. An increase of KaiA decreases KaiC dephosphorylation by accelerating KaiC phosphorylation of NP-KaiC.
To avoid complexity in the model, I did not consider the process of KaiC homohexamer formation and KaiA and KaiB homodimer formations.
The rates of phosphorylation and P-KaiC/KaiA complex formation mediated by free KaiA decreased with the concentration of the KaiA-containing complexes