Measurement of differential cross sections for
top quark pair production in pp collisions at
√ s = 7 TeV with the ATLAS detector
Miho Yamada
Doctor of Philosophy
The Graduate University for Advanced Studies
School of High Energy Accelerator Science
Department of Particle and Nuclear Physics
2012
Abstract
Measurement of differential cross sections for top quark pair production in proton-proton collisions at a center of mass energy of 7 TeV are described. They are measured as a function of the mass and the the rapidity of the top-anti-top (tt) system using lepton (electron and muon)+jets events. The purpose of this study is the verification of the standard model by precise measurement of the production cross section of the heaviest fermion in high center of mass energy and high luminosity collision. In addition top quark has an important part to play in a beyond the standard model. New particles which couple to a top quark pair directly so that we observe signal of new physics on the invariant mass distribution of the tt system. Differential cross section as a function of the mass of the tt system has already measured at Tevatron however there was no evidence of new physics. This analysis based on the data of 4.7 fb-1 luminosity recorded by the ATLAS detector at LHC center of mass energy of 7 TeV of pp collisions in 2011, Measured differential cross sections are consistent with the standard model expectations.
Contents
1 Introduction 1
1.1 Top Quark . . . 1
1.2 Production and Decays of the Top Quark Pair . . . 2
1.2.1 Production Processes and Total Production Cross Section . . . 2
1.2.2 Decay of the Top Quark Pair . . . 3
1.3 New Particle Search and Top Pair Final States . . . 6
2 Experimental Measurement of Top Pair Production Differential Cross Section 8 2.1 Data . . . 8
2.2 Background . . . 11
2.3 Simulation Samples . . . 12
2.4 Event Selection . . . 15
2.5 tt event Reconstruction . . . 15
3 Accelerator and Detector 17 3.1 The ATLAS Detector . . . 17
3.2 Inner Detector . . . 20
3.2.1 PIXEL detector (PIXEL) . . . 20
3.2.2 Semiconductor Tracker (SCT) . . . 21
3.2.3 Transition Radiation Tracker (TRT) . . . 21
3.2.4 Tracking . . . 21
3.3 Calorimeters . . . 22
3.3.1 Electromagnetic Calorimeter . . . 23
3.3.2 Hadronic Calorimeter . . . 23
3.4 Muon Spectrometer . . . 23
3.4.1 Monitored Drift Tube Chambers (MDT) . . . 24
3.4.2 Cathode Strip Chambers (CSC) . . . 24
3.4.3 Resistive Plate Chamber (RPC) . . . 24
3.4.4 Thin gap chamber (TGC) . . . 24
3.5 Magnet System . . . 25
3.6 Trigger and data-acquisition system . . . 25
3.6.1 Level-1 . . . 25
3.6.2 Level-2 . . . 25
3.6.3 Event Filter . . . 27
4 Analysis Objects Reconstruction and Identification 28 4.1 Signal of Physics Objects . . . 28
4.2 Electron . . . 28
4.2.1 Electron Reconstruction . . . 28
4.2.1.1 Reconstruction Efficiency . . . 30
4.2.2 Electron Identification . . . 30
4.2.2.1 Electron Identification Efficiency . . . 32
4.2.3 Electron Energy Resolution and Scale . . . 32
4.3 Muon . . . 34
4.3.1 Muon Reconstruction . . . 34
4.3.1.1 Muon Reconstruction Efficiency . . . 34
4.3.2 Muon Identification . . . 34
4.3.2.1 Muon Identification Efficiency . . . 35
4.3.3 Muon Momentum Resolution and Scale . . . 35
4.4 Jet . . . 37
4.4.1 Jet Reconstruction . . . 37
4.4.2 Jet Identification . . . 38
4.4.3 Jet Energy Scale and Resolution . . . 39
4.5 Missing Transverse Energy . . . 41
4.6 Bottom Quark Tagging . . . 42
4.6.1 Impact parameter based algorithms (IP3D) . . . 43
4.6.1.1 Transverse impact parameter . . . 43
4.6.1.2 IP3D . . . 43
4.6.2 Secondary vertex based algorithms (SV1) . . . 44
4.6.2.1 SV1 . . . 44
4.6.3 Decay chain reconstruction algorithm — JetFitter . . . 45
4.6.3.1 JetFitter . . . 45
4.6.4 MV1 . . . 46
4.7 Offline Data Processing . . . 49
5 Trigger and Event Selection 50 5.1 Trigger . . . 50
5.1.1 Electron Trigger . . . 50
5.1.1.1 Level-1 Trigger . . . 50
5.1.1.2 Level-2 and Event Filter . . . 51
5.1.1.3 Trigger Efficiency . . . 51
5.1.2 Muon Trigger . . . 52
5.1.2.1 Level-1 Trigger . . . 52
5.1.2.2 Level-2 and Event Filter . . . 52
5.1.2.3 Muon Trigger Efficiency . . . 53
5.2 Event Selections . . . 55
5.2.1 Trigger condition . . . 55
5.2.2 Primary vertex . . . 55
5.2.3 High pT isolated lepton . . . 56
5.2.4 Lepton and trigger coincidence . . . 56
5.2.5 Jet and calorimeter energy deposition . . . 56
5.2.6 Number of jets . . . 56
5.2.7 Large missing transverse energy . . . 56
5.2.8 Transverse mass of lepton and missing transverse energy . . . 56
5.2.9 Number of tagged b-jet . . . 59
6 Top Quark Pair Reconstruction 61 6.1 Kinematic Likelihood Fit . . . 61
6.2 Breit-Wigner distribution . . . 62
6.3 Transfer Function . . . 63
6.4 Likelihood Cut . . . 64
7 Background Estimation 69 7.1 W +jets . . . 69
7.1.1 W +jets normalization . . . 69
7.1.2 W +heavy flavor normalization . . . 70
7.2 QCD Multi-Jet Background Event . . . 71
7.2.1 Tight Selection Efficiencies for Electrons . . . 73
7.2.1.1 Signal Electron Efficiency . . . 73
7.2.1.2 Background Electron Efficiency . . . 75
7.2.2 Tight Selection Efficiencies for Muons . . . 76
7.2.2.1 Signal Muon Efficiency by Matrix Method A . . . 76
7.2.2.2 Background Muon Efficiency Estimated by Matrix Method A . . . 77
7.2.2.3 Signal Muon Efficiency by Matrix Method B . . . 77
7.2.2.4 Background Muon Efficiency by Matrix Method B . . . 78
7.3 Background from Z+jets, di-boson, single top and other decay of tt . . . 79
7.4 Combined Background Estimations in the Background Control Region . . . 80
8 Kinematic Distributions and Event Yields 82 8.1 Event Yields . . . 82
8.2 Kinematic Distributions . . . 82
9 Differential Cross Section and Unfolding 87 9.1 Differential Cross Section . . . 87
9.2 Binning . . . 88
9.3 Unfolding procedure . . . 89
9.4 Unfolding Technique . . . 90
9.4.1 Simple Matrix Inversion . . . 90
9.4.2 Singular Value Decomposition . . . 90
9.5 Self Consistency Test . . . 93
9.6 Combination of Analysis Channels . . . 93
10 Systematic Uncertainties 96
10.1 Estimation of Systematic Uncertainty . . . 96
10.2 Signal and Background Modeling . . . 96
10.2.1 Signal Modeling . . . 96
10.2.2 Parton Shower Modeling . . . 96
10.2.3 Initial and Final State Radiation . . . 97
10.2.4 QCD Multi-jet . . . 97
10.2.5 W +jets Process . . . 97
10.2.6 Single top and Di-boson Production Cross Sections . . . 97
10.3 Detector Modeling . . . 97
10.3.1 Lepton Trigger, Reconstruction and Identification Efficiency . . . 97
10.3.2 Lepton Momentum/Energy Scale and Resolution . . . 97
10.3.3 Jet Energy Scale . . . 98
10.3.4 Jet Energy Resolution . . . 98
10.3.5 Jet Reconstruction Efficiency . . . 98
10.3.6 Missing Transverse Energy . . . 98
10.3.7 b-tagging Efficiency . . . .100
10.3.8 Luminosity . . . .100
11 Results and Discussion 101 11.1 Results . . . .101
11.2 Discussion . . . .101
12 Summary 109
A Results of using signal sample MC@NLO 111
List of Figures
1.1 The top diagram shows the top quark production process via quark-anti-quark
collision and the bottom three show that via gluon-gluon processes. . . 3
1.2 tt cross section as a function of the center of mass energy. . . 4
1.3 Parton distribution function fi(xi, µ2F) for scale of Q2= µ2F= 172.5 GeV obtained by the CTEQ collaboration (CT10 [8]). . . 4
1.4 Top pair branching fractions . . . 5
1.5 The mass of the tt system at √s = 7 TeV in pp collisions and normalized to 4.7 fb-1 that corresponds to the collision data for this analysis. The mass of the new particles (color singlet and octet), renormalization scale µR and factorization scale µF assume 2 TeV and generate the events at LO with MadGraph [18]. . . 7
2.1 LHC integrated luminosity in 2011 . . . 9
2.2 LHC peak luminosity in 2011 . . . 9
2.3 High pileup event with 20 reconstructed vertices. For this display the track trans- verse momentum threshold is 0.4 GeV. . . 10
2.4 The luminosity-weighted hµi distribution of collision data in 2011. β∗ is a char- acteristic of beam squeeze at the interaction point. Low β∗ beam is narrower squeezed and increase the number of collisions. . . 10
2.5 Offset in jet transverse energy ET,jet in data as a function of the distance from the last empty bunch (DFE) in the current bunch train . . . 11
2.6 The background events for tt lepton+jets channel. . . 13
3.1 LHC accelerator complex . . . 18
3.2 ATLAS detector . . . 19
3.3 Inner Detector . . . 20
3.4 Calorimeters layout . . . 22
3.5 Muon Spectrometer layout . . . 23
3.6 Block diagram of the Trigger/DAQ system . . . 26
4.1 How the particles interacts in the ATLAS detector. . . 29
4.2 Longitudinal and transverse segmentation of the LAr EM calorimeter in the central region. . . 29
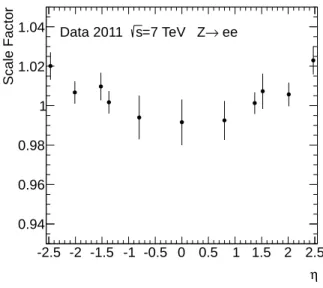
4.3 Reconstruction efficiency SF measured from Z → ee Tag & Probe method. . . 30
4.4 Electron identification (tight) efficiency SF. . . 32
4.5 Electron isolation cut (for tight) efficiency as a function of ET and η. . . 33
4.6 Calibrated Z → ee invariant mass for all pairs. . . 33
4.7 Combined muon reconstruction efficiency with respect to the inner tracking effi- ciency as a function of the pseudorapidity of the muon for muons with pT > 20 GeV. The panel at the bottom shows the ratio between the measured and predicted ef- ficiencies. . . 36
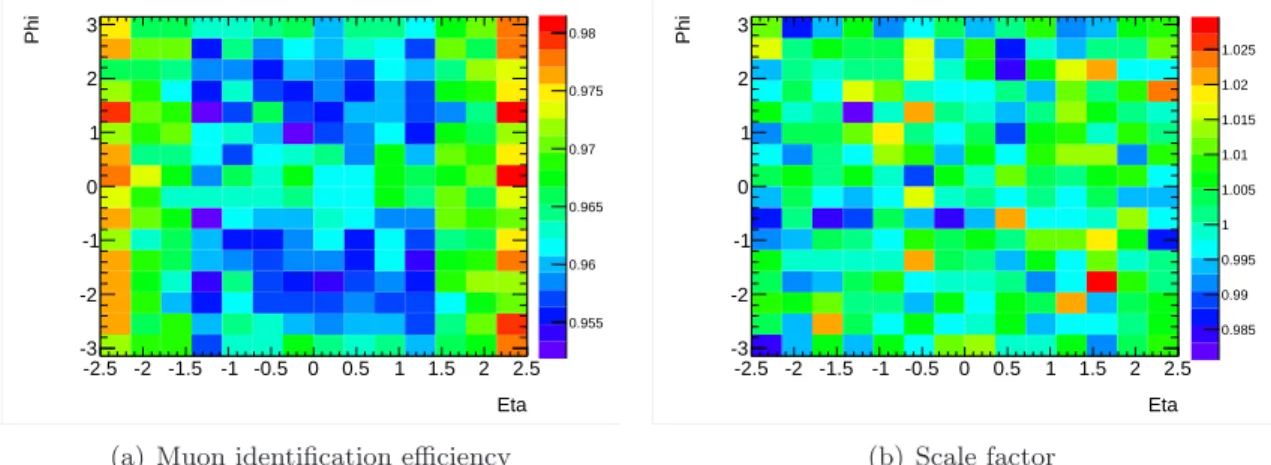
4.8 Muon identification efficiency and its scale factor on η − φ plane. . . 36
4.9 Di-muon invariant mass distribution for oppositely charged muon pairs with pT> 20 GeV. The muon pT is reconstructed both muon spectrometer and Inner Detec- tor (i.e. combined muon). The muons are required Calorimeter isolation of sum of calorimeter cell energies < 2 GeV in a cone of ∆R = 0.3 and |η| < 2.5. Invari- ant mass derived from data is compared to Monte Carlo prediction of Z → µµ generated by Pythia. . . 37
4.10 Jet reconstruction efficiency relative to track jet [35]. . . 39
4.11 Conceptual illustration of Jet Vertex Fraction (JVF) and JVF distribution of se- lected jet with pT > 25 GeV and |η| < 2.5. JVF = 1: little or no contributions from pileup to jets, JVF < 1: some additional tracks originate from primary inter- action, JVF = 0: all charged tracks originate from pileup, JVF = −1 jets without matched tracks. . . 40
4.12 Average jet energy response at each calorimeter region as a function of recon- structed jet pseudorapidity [36]. The inverse of this response value is corresponding to the average jet energy scale correction. . . 40
4.13 Fractional jet energy resolution as a function of the average jet transverse momenta for the di-jet balance techniques [37]. . . 41
4.14 The resolution of missing energy on x and y axis [38]. . . 43
4.15 The signed impact parameter and its significance [39]. . . 44
4.16 IP3D weight [40] . . . 45
4.17 The invariant mass of all tracks associated to the vertex 4.17(a), the ratio of the sum of the energies of the tracks in the vertex to the sum of the energies of all tracks in the jet 4.17(b), and the number of two-track vertices 4.17(c). . . 46
4.18 Category of the decay topology [42]. (1) the number of vertices with at least two tracks, (2) number of total tracks at vertices with at least two tracks and (3) number of additional single tracks. . . 47
4.19 The vertex information of b-jet for likelihood discriminant variable [42]. Here vertices have at least two tracks. Single tracks are considered if there is no vertex with at least two tracks. . . 47
4.20 Comparison of all tt based scale factors with the combined scale factor based on QCD multi-jet event [44]. . . 48
4.21 MV1 weight and light jet rejection [42]. For this analysis, 70% efficiency point of MV1 weight > 0.601713 is required to jets. Light jet rejection is 134 at this point. 49 5.1 Elements for the electron trigger algorithm. . . 50
5.2 Electron trigger efficiency measured with the Tag & Probe method for data with respect to e20 medium, e22 medium and e22vh medium as a function of electron η
and pT. . . 52
5.3 Quarter-section of the muon sub-systems. . . 53
5.4 Efficiencies of the mu18 medium trigger chains in terms of the offline reconstructed muon pT. (a) and (b) show efficiencies of the triggers with the muon spectrometer track based algorithm (outside-in) in the barrel and endcap regions. (c) and (d) show the trigger efficiencies using the inner detector track based algorithm (inside- out) in the barrel and endcap regions. The efficiencies includes the geometric acceptance of the L1 trigger chambers [45]. . . 54
5.5 The η −φ dependence of the mu18 medium trigger efficiency scale factor with inner detector track based algorithm at EF (inside-out) [45]. . . 55
5.6 The basic kinematic variables that are used in the event selection based on dis- crimination between tt and background (W +jets and Fake lepton). . . 57
5.7 The basic kinematic variables that are used in the event selection based on dis- crimination between tt and background (W +jets and Fake lepton). . . 58
5.8 Missing ET . . . 59
5.9 W transverse mass . . . 60
5.10 Number of b-tagged jets . . . 60
6.1 Breit-Wigner probability density function used in eq. (6.1). . . 63
6.2 Relative difference of b-jet energy obtained from tt Monte Carlo sample. The en- ergy region is 86 < Ebtruth < 114 GeV and the pseudorapidity region is 0.0 < |η| < 0.8. The deviation of relative energy difference is evaluated with two components of Gaussian shown in eq. (6.3). The global fit result is taken as Transfer Function. 64 6.3 The parametrized transfer function for light jet. The truth energy of Etrue=20, 40, 80, 150, 250 and 350 GeV are shown respectively. The η region is 0.0 < |η| < 0.80. 65 6.4 Log Likelihood value (ln L). They are filled only maximum likelihood value. . . 65
6.5 The correlation between the reconstructed tt invariant mass and the maximized log likelihood for events of the electron channel. Figure 6.5(a) shows the plot for events with |rtt| < 0.5 and Figure 6.5(b) shows that for events with |rtt| > 0.5 . . . 66
6.6 The correlation of the displacement of directions, ∆Rreco,truebetween true particles (electron, neutrino, light quarks) and their reconstructed objects and (ln L)max. Permutation of jets obtained from kinematic fitting which correspond to maximum likelihood value. . . 67
6.7 The correlation of the displacement of energies, ∆Ereco,true, between true particles (electron, neutrino, light quarks) and their corresponding reconstructed objects. Energy of each object and permutation of jets obtained from kinematic fitting which correspond to maximum likelihood value. . . 68
7.1 Invariant mass distribution of opposite-sign charge electron pairs for loose selection and tight selection level after the fitting (blue dashed line) with the signal (red dashed line) and the background components (green dashed line). These plots are including whole η and ET events. . . 74
7.2 The signal electron efficiency ²signalas a function of η and ET. The error bar shows
the total of statistical and systematic uncertainty. . . 74
7.3 Photon conversion radius R in the barrel region for loose selection electrons with a conversion vertex. . . 75
7.4 The combined background electron rate, ²bg, as a function of electron η and ET. The error bar shows the total of statistical and systematic uncertainty. . . 76
7.5 The signal muon efficiencies, ²signal, as function of leading jet transverse momentum pT,j1 and η. . . 77
7.6 The background muon rates, ²bg, for b-tagged sample as function of leading jet transverse momentum pT,j1 and η. . . 78
7.7 The background muon efficiencies, ²bg, measured using (a) the Monte Carlo prompt muon samples and QCD multi-jet sample (full MC sample) and (b) the collision data based on impact parameter d0 threshold. . . 79
7.8 W transverse mass. electron+jets and muon+jets channel. . . 81
8.1 The number of selected jets for both electron channel 8.1(a), and muon channel 8.1(b) after the event selection. . . 83
8.2 Basic kinematic distributions after applying the event selection for electron channel 4 jets inclusive sample, Figure 8.2(a) number of b-tagged jets, 8.2(b) electron trans- verse energy ET, 8.2(c) electron eta η, 8.2(d) the W transverse mass of electron and missing transverse energy mT, 8.2(e) first leading jet pT and 8.2(f) missing transverse energy EmissT . . . 84
8.3 Basic kinematic distributions after applying the event selection for muon channel 4 jets inclusive sample. Figure 8.3(a) number of b-tagged jets, 8.3(b) muon transverse energy pT, 8.3(c) muon η, 8.3(d) the W transverse mass of muon and missing transverse energy mT, 8.3(e) first leading jet pT, 8.3(f) missing transverse energy ETmiss. . . 85
8.4 The reconstructed mttand yttafter the kinematic fitting and likelihood cut log L > −52. . . 86
9.1 Resolution of mtt . . . 88
9.2 Resolution curve for mtt . . . 89
9.3 Migration Matrices for mtt and ytt. . . 91
9.4 Efficiencies for mtt and ytt. . . 92
9.5 Self consistency test of SVD for mtt and ytt. . . 94
10.1 Fractional jet energy scale uncertainty as a function of jet pT [36, 53]. The un- certainty shown in Figure 10.1(a) and 10.1(b) applies to tt lepton+jets channel to take into account the quark/gluon composition and response. The |η| region of jets are |η| = 0.5 and |η| = 2.0 respectively. The fractional uncertainty on the jet energy scale of b-jets (|η| < 2.5) is shown in Figure10.1(c). . . 99
11.1 Unfolded differential cross section as a function of mtt compared to MCFM NLO and Approximate NNLO theoretical predictions. . . .102
11.2 Unfolded differential cross section as a function of ytt compared to MCFM NLO and Approximate NNLO theoretical predictions. . . .102 A.1 migration matrices for mtt(A.1(a) and A.1(b)) and ytt(A.1(c) and A.1(b)) derived
from simulated tt events of MC@NLO passing all selection criteria and likelihood cut. The unit of the matrix elements is the probability for an event generated at a given value to be reconstructed at another value. . . .112 A.2 Efficiencies for mtt(Figure A.2(a) and A.2(b) ) and ytt(Figure A.2(c) and A.2(d)).
The efficiency is defined according to Equation 9.3 and includes the branching ratio of BR(tt→ ℓ+jets = 0.438) for tt lepton+jets channel. . . .113 A.3 Unfolded relative differential cross section using unfolding techniques of SVD and
Matrix Inversion as a function of mttcomparing to MCFM NLO and approximate NNLO theoretical predictions. The measured uncertainty which is 68% confidence level of pseudo-experiment result including statistical and systematic uncertainties is indicated by error bar in upper graph of each plot. The bands in the graph of relative differential cross section represent theory uncertainties. The graph bottom of relative differential cross section represents the ratio between theory prediction and observed result. . . .114 A.4 Unfolded relative differential cross section using unfolding techniques of SVD and
Matrix Inversion as a function of ytt comparing to MCFM NLO prediction. The measured uncertainty which is 68% confidence level of pseudo-experiment result including statistical and systematic uncertainties is indicated by error bar in upper graph of each plot. The band in the graph of relative differential cross section represent theory uncertainty. The graph bottom of relative differential cross section represents the ratio between theory prediction and observed result. . . .115
List of Tables
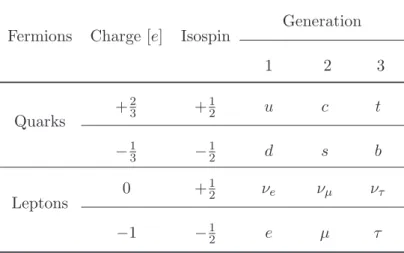
1.1 Fermions of the standard model. Their masses, charges and spins are shown. . . . 2
1.2 Gauge bosons. . . 2
2.1 Monte Carlo simulation samples . . . 14
3.1 LHC beam parameters for design and in 2011. . . 18
3.2 Parameters of Inner Detector . . . 21
4.1 Definition for loose, medium and tight electron identification cuts. The cut values are given explicitly only when they are independent of η and pT. . . 31
4.2 Kinematical conditions to select the tag and probe pairs of Z → µ+µ− decays. . . 35
5.1 Electron trigger menu summary used for this analysis. . . 51
5.2 Summary of the muon trigger menu. The L1 MU10 trigger consists of the two (three) station coincidence trigger in the barrel (endcap) region, and the L1 MU11 trigger composed of coincidences of hits from three stations in both barrel and end- cap regions. The L1 MU10 trigger was prescaled while instantaneous luminosity was above 1.9 × 1033 cm−2s−1. The EF rates show only mu18 medium. . . 53
6.1 Parameters of Transfer Functions for electron and light jets. The η region is 0.0 < |η| < 0.80 for both. . . 64
7.1 The scale factors of the W +jets normalization . . . 70
7.2 W +jets flavor fraction scale factor for events of W + bb, W + c and W +light jet. . 71
7.3 The signal muon efficiencies, ²signal, according to jet multiplicity. In this Table, “5-jets in.” means for the event of 5-jets inclusive. . . 78
7.4 The background muon efficiencies, ²bg, according to muon η and jet multiplicity for after b-tagging. In this Table, “5-jets in.” means for the event of 5-jets inclusive. 80 8.1 Event yields of tt signal and background processes in the signal region compared to the observed events for lepton+jets channel after the event selection and likelihood cut. . . 83
9.1 Bin widths for reconstructed mtt and ytt distributions. . . 89 9.2 Obtained cross sections of mtt from the simulated signal sample with the SVD
unfolding approach for e+jets and µ+jets channels and generated true cross sections. 93
9.3 Obtained cross sections of ytt from the simulated signal sample with the SVD unfolding approach for e+jets and µ+jets channels and generated true cross sections. 95 11.1 Obtained relative differential cross sections for mt¯tused SVD and Matrix Inversion
unfolding technique and theoretical predictions at NLO and approximate NNLO assuming the standard model. . . .103 11.2 Obtained relative differential cross sections for yt¯tused SVD and matrix inversion
unfolding technique and theoretical prediction at NLO assuming the standard model.104 11.3 Uncertainties for relative differential cross section for mt¯t combined result. SVD
unfolding technique is used. . . .105 11.4 Uncertainties for relative differential cross section for mt¯t combined result. matrix
inversion unfading technique is used. . . .106 11.5 Uncertainties for relative differential cross section for yt¯t combined result. SVD
unfolding technique is used. . . .107 11.6 Uncertainties for relative differential cross section for yt¯t combined result. matrix
inversion unfading technique is used. . . .108 A.1 Relative differential cross section for mt¯tused SVD and matrix inversion unfolding
technique. . . .116 A.2 Relative differential cross section for yt¯tused SVD and matrix inversion unfolding
technique. . . .116
Chapter 1
Introduction
1.1 Top Quark
The standard model of elementary particle physics [1] is the theory which gives an account of the interactions (mediated by gauge bosons) between matter elementary particles (fermions). It includes 12 flavors of fermions (spin-1/2), 6 flavors of quarks and 6 flavors of leptons, 4 gauge bosons (spin-1) which mediate forces between fermions and one scalar elementary particle (Higgs boson). The standard model well describes many current experimental results of the particle physics. In the summer of 2012, two experiments of the Large Hadron Collider at CERN, the ATLAS experiment observed a Higgs boson, which was the last undiscovered member of the standard model, with the significance of 5.9 σ [2]. All fermions in the standard model, six quarks and six leptons, are shown in Table 1.1 [3], which form three weak-isospin doublets. They interact with each other by exchanging gauge bosons which are shown in Table 1.2. The six leptons consist of neutrinos and charged leptons. Neutrinos interact only weakly with other fermions via exchange of massive gauge bosons (Z and W ) and charged leptons take part both in weak and electromagnetic interactions mediated by photons. The six flavors of quarks are classified into two prototypes of first generation, up-type and down-type. Quarks interact with other quarks via strong interaction mediated by gluons as well as weak and electromagnetic interactions. The top quark is the third generation up-type quark.
The top quark was discovered directly by the CDF and DØ experiments at the Tevatron [4, 5,6] a proton-antiproton collider at a center of mass energy √s = 1.8 TeV at Fermilab in 1995. The properties of the top quark are studied by experiments of the Tevatron and also of the LHC, and the average of published top mass measurements from Tevatron Run-I (1992–1996), Run-II (2001–2011) and the LHC (2008–) is 173.5 ± 0.6 ± 0.8 GeV.
The top quark interacts by the strong interaction but decays only through the weak interac- tion. It decays into a W boson and a bottom quark almost in 100%.
Table 1.1: Fermions of the standard model. Their masses, charges and spins are shown.
Fermions Charge [e] Isospin Generation
1 2 3
Quarks +
2
3 +12 u c t
−13 −12 d s b
Leptons 0 +
1
2 νe νµ ντ
−1 −12 e µ τ
Table 1.2: Gauge bosons.
Gauge bosons Mass [GeV] Charge [e] Interactions
Photon (γ) 0 0 electromagnetic
Gluon (g) 0 0 strong
Z boson (Z0) 91.1876 0 weak
W boson (W±) 80.385 ±1 weak
1.2 Production and Decays of the Top Quark Pair
1.2.1 Production Processes and Total Production Cross Section
The top quark pair production at high energy hadron collisions is well described by the Standard Model. The Feynman diagrams of the top quark pair production in the hadron collisions at the leading-order (LO) are shown in Figure 1.1. The total top quark pair production cross section for hard scattering processes at a center of mass energy √s can be expressed by the following formula:
σtt(√s, mt) = X
i,j=q,¯q,g
Z
dxidxjfi(xi, µ2) ¯fj(xj, µ2) × ˆσij→tt(ˆs) (1.1)
where i and j are parton flavors, q, q and g, in the initial hadron, respectively, and xi(j) is their energy fraction with respect to their parent hadron. The total cross section is separated into two pieces, a short distance and a long distance ones. In eq. (1.1) the short distance part is expressed
g
g
g
t
¯ t
g
g
t
¯t g
g
t
¯ t g
q¯
g
t
¯t
Figure 1.1: The top diagram shows the top quark production process via quark-anti-quark colli- sion and the bottom three show that via gluon-gluon processes.
as ˆσij→tt(ˆs) which is a cross section of the tt production via a hard collisions of partons (i and j) at the collision energy of √ˆs. The long distance part comes from the soft parton emissions from the initial partons (SR). In eq. (1.1) the probability to find a parton of flavor i with an energy fraction of x (PDF) is expressed as fi(xi, µ2F) where µ2F is a energy scale of the separation between the short and the long distance parts. In Figure 1.3 [7] PDFs with the example parametrization obtained by the CTEQ [8] collaboration are shown. Since the typical energy fraction for the tt production is small (2mt/√s ≈ 0.05) at the LHC energy, the contribution of gluon collisions to the total cross section becomes very large due to the large PDF value. On the other hand that of qq collisions is small because the PDF value of q is small. At √s = 7 TeV the cross section of gluon-gluon collisions becomes about 90% of the total cross section and that of quark-antiquark annihilation is about 10%.
In Figure 1.2 the total production cross section of the top quark pair production is shown as a function of collision energies for hadron colliders (pp and pp). The measured cross sections at Tevatron [9, 10] and LHC [11, 12, 13, 14] are compared to theoretical calculations in NLO (next-to-leading-order) by lines (solid and dot-dashed) and also approximate NNLO (next-to- next-to-leading) [15] with colored bands. At the LHC energy of √s = 7 TeV, the theoretical prediction of the tt production cross section by the approximate NNLO calculation with mt = 172.5 GeV becomes σtt= 166.8+16.5−17.8pb, whereas the combined cross section of the latest ATLAS measurement is 177+11−10 pb.
1.2.2 Decay of the Top Quark Pair
The final state of the top quark pair production process is categorized according to the combina- tion of decay modes of two W bosons in the final state. The W boson decays a charged lepton (e, µ and τ ) and neutrino (νe, νµand ντ) with a branching fraction 11%. They are observed as an isolated lepton with high transverse momentum and a missing transverse energy in a detector.
[TeV] s
1 2 3 4 5 6 7 8
[pb] ttσ
1 10 102
ATLAS Preliminary
NLO QCD (pp) Approx. NNLO (pp)
) p NLO QCD (p
) p Approx. NNLO (p CDF
D0
32 pb
± Single Lepton (8 TeV) 241
12 pb
± Single Lepton (7 TeV) 179
-14 pb Dilepton 173 +17
81 pb
± All-hadronic 167
-10 pb Combined 177 +11
7 8
150 200 250
Figure 1.2: tt cross section as a function of the center of mass energy.
Figure 1.3: Parton distribution function fi(xi, µ2F) for scale of Q2 = µ2F = 172.5 GeV obtained by the CTEQ collaboration (CT10 [8]).
The W boson also decays into a pair of quarks (W → q¯q′) with a branching fraction of 67% and these quarks are observed as jets in a detector.
τ+τ 1% τ+µ 2%
τ+e 2% µ+µ 1%
µ+e+ee 2% 1%
e+jets 15%
µ+jets 15% τ+jets 15%
"alljets" 46%
"lepton+jets"
"dileptons"
Top Pair Branching Fractions
Figure 1.4: Top pair branching fractions
The following list shows the possible combination of decays of two W bosons in the final state of the top quark pair production.
A: All hadronic channel t¯t → (W+b)(W−¯b) → (q¯q)b (q¯q)¯b
Both W bosons decay into a quark pair, resulting six hadronic jets (2 b-jets + 4 light quark jets) in its final state. This channel has a large branching ratio of 46% as shown in Figure 1.4, but suffers from the large amount of irreducible QCD background.
B: Lepton+jets channel t¯t → (W+b)(W−¯b) → (q¯q′)b (ℓνℓ)¯b + (ℓνℓ)b (q ¯q′)¯b
One of the W boson decays into a quark pair, another one decays into a charged lepton and a neutrino. This channel has also a large branching fraction of 15% for each lepton flavor, e, µ and τ . This channel has a high transverse momentum charged lepton, a missing transverse energy of the neutrino, two light quark jets and two b-jets in the final state. We consider only e and µ channel as a signal in this analysis due to a complexity of τ decay patterns. In the lepton+jets channel the W boson which decays into a charged lepton and neutrino can be reconstructed from a single lepton and missing transverse energy without any combinatorial backgrounds.
C: Di-lepton channel t¯t → (W+b)(W−¯b) → (ℓνℓ)b (ℓνℓ)¯b
Both W bosons decay into a lepton and a neutrino. In the final state of this channel, there are two high transverse momentum charged lepton, a large missing transverse energy from two neutrino and two b-quark jets. The signal to background ratio is much better than lepton+jets channel due to two high transverse momentum charged leptons. However, its branching fraction is only 7% for e and µ. Since two neutrinos are missing in the final state, it is difficult to reconstruct the tt system.
The signal process of this study is the “lepton+jets” decay channel because it has a good S/N ratio and a large branching fraction, and the kinematics of the final state can be reconstructed.
The total production cross section of top quark pair has been already measured precisely with a large amount of tt events and this enables to investigate the detail of properties of top quark pair production in terms of characteristic variables of the tt system. At first, the purpose of this analysis is verification of the standard model. To compare the differential cross sections as a function of kinematic variables of tt system to theoretical predictions directly, we can know the consistency of the standard model. Currently accurate theoretical predictions for the tt invariant mass distribution (mtt) at NLO and next-to-next-to-leading logarithm (NNLL) are available [16], [17]. The tt invariant mass is sensitive to physics beyond the standard model such as s-channel resonances that can change the shape of the differential cross section and will show details at Section 1.3. The shape of the rapidity of the tt system will be also changed and can be seen excess at central region at the region of s-channel resonances on mtt. The theoretical prediction for the tt system rapidity at NLO is available [16].
1.3 New Particle Search and Top Pair Final States
In some models of new physics beyond the Standard Model, gauge couplings to the third gen- eration are enhanced. These include Kaluza-Klein excitations of graviton and the weak and the strong gauge bosons which couple to top quarks. Such particles can be seen as resonances in the pp → X → tt production and not in other channels like di-jets or di-leptons due to their small couplings to light fermions in this section. We consider the possible effects on the observed invariant mass distribution of the top quark pair system induced by new heavy resonances. We use MadGraph [18] with “topBSM” model which describes top quark pair resonance productions by new physics beyond the Standard Model.
As an example, we discuss a spin-1 resonance production by q ¯q annihilations that can be a color singlet or color octet. An s-channel color singlet vector boson, such as Z′, in the tt production process gives a simple peak in the invariant mass spectrum of the top quark pair. The precise width and height of the peak depends on model parameter of new physics. Assuming the mZ′ = 2 TeV and the same coupling strength to fermions as the Standard Model Z boson, the mass distribution of the Z′ signal as well as the Standard model background are shown in Figure 1.5 with a blue histogram at√s = 7 TeV with 4.7 fb-1. If the Standard Model coupling is assumed, we find that expected signal of Z′ in the top quark pair resonance search is very small. In Figure 1.5 the signal of a color octet spin-1 particle is also shown as a red histogram at the same energy and integrated luminosity as the color singlet case. We assume that the coupling strength to fermions of a color acted vector particle is equal to the strong coupling constant. Due to the larger coupling to fermions than color singlet case, the larger signal production is expected. We estimate the signal strength for above examples in the highest tt mass bin, 950-2700 GeV of our analysis. For the color singlet case, the signal to noise ratio is only ∼2, and that becomes about for ∼8 the color octet case. We find that the new physics signal produced with the strength of the standard model electro-weak coupling is rather small in our analysis.
invariant mass (GeV) t
t
1200 1400 1600 1800 2000 2200 2400
Events/20GeV
10-1
1 10 102
103
104
MadGraph V4 = 2TeV
Z’/g* F = m µ
R = µ
LO, CTEQ6L1 = 7 TeV s LHC,
Nomalized to 4.7 fb-1
Z’ color singlet g* color octet
Figure 1.5: The mass of the tt system at √s = 7 TeV in pp collisions and normalized to 4.7 fb-1 that corresponds to the collision data for this analysis. The mass of the new particles (color singlet and octet), renormalization scale µR and factorization scale µF assume 2 TeV and generate the events at LO with MadGraph [18].
Chapter 2
Experimental Measurement of Top
Pair Production Differential Cross
Section
In this analysis, we measure the differential cross sections of kinematic variables of the tt system, mtt and ytt. These variables are obtained by reconstructing the top and anti-top decays from detected objects in selected event samples. Event selection criteria are optimized to select the top quark pair production with subsequent decays into the lepton+hadron channel. Contamination from background processes such as other physics processes and other decay channels of the top quark production are estimated by using real data as well as simulated samples. From observed distributions of the reconstructed variables, mtt and ytt, their differential cross sections are finally obtained by correcting for detector effects using the unfolding technique. In this chapter experimental procedure to measure the differential cross sections is summarized.
2.1 Data
Data used in this analysis was collected by the ATLAS detector at the LHC with √s = 7 TeV in 2011. The corresponding integrated luminosity is 4.7 fb-1 2.1. The instantaneous luminosity gradually increased during the data taking in 2011 and reached ∼ 3.65 × 1033cm−2s−1 at the end of the year. Figure 2.2 shows the history of the peak luminosity per beam fill during the year of 2011. As shown in this plot, the data taking in 2011 can be divided into several periods and the beam condition of each period is extremely different from each other.
In the high luminosity collisions, events produced by other interactions than hard collisions in the same bunch-crossing are also recorded as a signal event. These events are called ”pile-up events”. Figure 2.3 shows an example of an event with the high number of multiple interactions. This event has 20 reconstructed vertices. In Figure 2.4 the luminosity-weighted distribution of the mean number of interactions per crossing for 2011 is plotted. During the technical stop of LHC in September of 2011, the β∗ has been reduced from 1.5m to 1.0 m. Blue curve shows the distribution before the technical stop, β∗ = 1.5 m, and red curve shows that for β∗ = 1.0 m. Clearly seen from the plot, the mean number of interactions per crossing is increased as the beam
Date in 2011
21/02 25/04 27/06 29/08 31/10
]-1 Total Integrated Luminosity [fb
0 1 2 3 4 5 6
7 ATLAS Online Luminosity s = 7 TeV
LHC Delivered ATLAS Recorded Total Delivered: 5.61 fb-1
Total Recorded: 5.25 fb-1
Figure 2.1: LHC integrated luminosity in 2011
Day in 2011 28/02 02/04 05/05 08/06 11/07 14/08 16/09 20/10 22/11 ]-1 s-2 cm33 Peak Luminosity per Fill [10
0 0.5 1 1.5
2 2.5 3 3.5 4
4.5 ATLAS Online Luminosity s = 7 TeV
LHC Stable Beams s-1
cm-2
1033
× Peak Lumi: 3.65
Figure 2.2: LHC peak luminosity in 2011
is squeezed more and the luminosity is increased. As the instantaneous luminosity increased, the number of interactions within the same bunch-crossing also increased.
Figure 2.3: High pileup event with 20 reconstructed vertices. For this display the track transverse momentum threshold is 0.4 GeV.
Mean Number of Interactions per Crossing
0 2 4 6 8 10 12 14 16 18 20 22 24
]-1 Recorded Luminosity [pb
10-3
10-2
10-1
1 10 102
103
104 ATLAS Online 2011, s=7 TeV
∫
Ldt=5.2 fb-1> = 11.6 µ * = 1.0 m, < β
> = 6.3 µ * = 1.5 m, < β
Figure 2.4: The luminosity-weighted hµi distribution of collision data in 2011. β∗ is a character- istic of beam squeeze at the interaction point. Low β∗ beam is narrower squeezed and increase the number of collisions.
The performance of the detectors are affected by such soft collision events overlapped on the triggered hard collision event. Especially, due to the relatively long integration time of the calorimeter data, the response of the calorimeter is affected not only by the same bunch crossing but also by several preceding and some following bunch crossing. The effect of such pile-up effect from out-of-time bunch crossing can be seen in Figure 2.5 indirectly. The plot shows the offset in jet transverse energy as a function of the distance from the last empty bunch crossing in the current bunch train, which measures the distance of the bunch crossing from the edge of the current bunch train. The effects of the positive in-time pile-up is canceled by the out-of-time pile-up which has an overall negative effect by signal shaping in the calorimeter data taking.
However, if the bunch crossing is near to the edge of the bunch train, there is insufficient out- of-time pile-up to cancel the in-time pile-up. The plot shows the calorimeter response becomes systematically higher near the edge of the bunch train and the effect becomes larger as the mean number of interactions increases.
Distance from last empty bunch [ns]
0 500 1000 1500
Jet Offset [GeV]
-1 -0.5
0 0.5 1 1.5 2 2.5 3 3.5 4
ATLAS Preliminary
L dt = 1.02 fb-1
∫
6 EM topo cluster jets, 2011 Data Anti-kT
| < 1.9 ηjet
< 20 GeV, |
track jet
15 < pT
< 4.5 µ 3.5 <
< 5.5 µ 4.5 <
< 6.5 µ 5.5 <
< 7.5 µ 6.5 <
Figure 2.5: Offset in jet transverse energy ET,jet in data as a function of the distance from the last empty bunch (DFE) in the current bunch train
Since we analyze the lepton+jet decay channel of the top quark pair production in this analysis, the isolated high transverse momentum lepton in the final state of this channel fulfills single lepton (electron and muon) trigger conditions of the ATLAS data taking. The trigger conditions also depend on the beam conditions. While the threshold on transverse momentum of µ is constant at 18GeV during 2011, that of electron changes from 20 GeV to 22 GeV as the instantaneous luminosity increases.
2.2 Background
Selected events are contaminated with events from background processes. Figure 2.6 shows diagrams of such processes.
W +jets
The process of single W boson production with jets is one of the major background to the signal with lepton+jets decay channel. Leptonic decay of the W boson of this process
produces the same isolated high transverse momentum lepton and missing transverse mo- mentum as the signal process. Background contamination from this process is estimated with the simulation sample. However, because the multi-jet production associated to W boson is not well modeled, the overall normalization of the background is determined from the measurement of the charge asymmetry of W production processes. W +jets events are estimated by using Monte Carlo simulation sample for kinematic shape and collision data for overall normalization since multi-jet production associated to W boson is not well modeled in the Monte Carlo simulation.
QCD or non-W background
Leptons from other than the leptonic decay of W boson is another source of background. Since QCD multi-jet production processes have a large cross section, electrons and positrons from pair productions by photons in jets and a charged lepton from semi-leptonic decaying b-quark become a large background. Additionally mis-reconstruction of the energy balance leads apparent missing transverse energy in fake lepton events. As the precise modeling is difficult for this background, the fraction of this type of background in the signal sample is estimated by using real data.
Z+jets, di-boson and single top productions
Other backgrounds from electroweak processes such as Z+jets, di-boson and single top production processes are estimated by simulations. Their contamination to the signal are smaller than above two background sources due to the existence of two or more isolated lepton, small missing transverse energy and low jet multiplicities.
Other decay channels of tt
In this analysis the di-lepton decay channel of the tt production is a background to the signal and the lepton+jet decay channel with a W boson decaying into τ lepton is also a background too. Contamination from these background sources are estimated by simula- tions.
Details of the estimation of background contamination are described in Chapter 7.
2.3 Simulation Samples
In order to estimate the signal efficiency and the background contamination to the signal some simulation samples are prepared for signal and background processes. All simulation samples which are used for this analysis are summarized in Table 2.1.
For the signal process, the top quark pair production process, we use two samples for the anal- ysis. Hard collision process of one sample is generated by MC@NLO (v4.01) [19] with CT10 [8] parton distribution function (PDF). MC@NLO generates hard scattering events according to the next-to-leading-order calculation. The other sample is generated by ALPGEN [20] with CTEQ6L1 PDF [21] with top quark mass of 172.5 GeV for both samples. ALPGEN is based on the leading order matrix element calculations with emphasis on configurations with high jet multiplicities. Parton showers subsequent to the hard scattering process generated by the above
g
q
q
W
ν ℓ
(a) W +jets
g
g
g
g
g
g
(b) QCD multi-jet
g
q
q
Z
ℓ+
ℓ− (c) Z+jets
q
q
W/Z
W/Z
(d) Di-boson g
b
t
W
ℓ
ν (e) Single top
Figure 2.6: The background events for tt lepton+jets channel.
Table 2.1: Monte Carlo simulation samples
Process Generator PS and UL PDF
tt MC@NLO HERWIG and Jimmy CT10
tt ALPGEN HERWIG and Jimmy CTEQ6L1
W/Z+jets ALPGEN HERWIG and Jimmy CTEQ6L1
Single top (s-ch and W t) MC@NLO HERWIG and Jimmy CTEQ6.6
Single top (t-ch) AcerMC PYTHIA MRST
Di-boson HERWIG HERWIG MRST
two generators are simulated via the interface to the general-purpose generator, HERWIG [22]. For the ALPGEN sample partons after the shower simulation are matched to the partons gen- erated by the matrix element calculations (MLM matching). ALPGEN sample offers the better modeling of the top quark pair production accompanied by multiple jets than that by MC@NLO. Hadronization of partons and particle decays are also taken care by HERWIG.
The underlying event including pile-up event under the high luminosity collisions of LHC is simulated with Jimmy (v4.31) [23] with the parameters tuned by ATLAS, AUET2 [24].
Among the background processes single top events with s-channel and W t-channel production processes are also generated by MC@NLO with HERWIG and Jimmy. On the other hand those produced via t-channel process are generated by AcerMC [25] (LO generator) with PYTHIA [26] for parton shower, hadronization and decays. AcerMC is another generator based on the LO calculations developed for the generation of the SM background processes based on the matrix element by MadGraph/HELAS.
Background event samples for a single vector boson productions associated with multiple jet, W/Z+jets, are generated by ALPGEN interfaced to HERWIG and Jimmy with CTEL6L1 PDF functions. Background from di-boson productions (W W, W Z, ZZ) are generated by HERWIG with MRST PDFs [27]. HERWIG itself can generate various hard processes of Standard Model and some processes for new physics and generated events are interfaced to its own parton shower, hadronization and decay programs.
All Monte Carlo samples are processed with GEANT4 [28] for simulation of the ATLAS detector responses [29].
In order for the realistic simulation of pile-up events generated simulation events with pile-up are re-weighted to reproduce the hµi distribution of real data.
Several efficiencies for physics objects such as trigger, reconstruction and identification are derived from both collision data and Monte Carlo simulation to compare the performance between them. Correction factors so-called “scale factor (SF)” apply to Monte Carlo simulation (MC) to reproduce the efficiencies. SFs are determined:
SF (x) = ²(x)DATA
²(x)MC
(2.1) where x is the kinematic variables of physics objects especially η, φ or pT, to take account of the dependency of the efficiency on η, φ and pT.
2.4 Event Selection
Signal events of the lepton+jets decay channel of the tt pair production are selected from data according to the following procedure.
Trigger condition
In order to select events with an isolated charged lepton from a W boson decay efficiently, events are required to be triggered by a single charged lepton trigger at the beginning. Trigger threshold for the transverse momentum of the lepton changes depending on the beam condition. Details of triggers are described in Chapter 5.
Physics objects such as electron, muon, jet and missing transverse energy are obtained by reconstructing event data of detectors and applying identification criteria. Detailed definitions of physics objects are described in Section 4.
The following selection criteria are applied to select the signal events. In order to select events with an isolated high transverse momentum lepton from W -boson decays, they are required to have:
an exactly one isolated charged lepton (e and µ) with high transverse momentum,
high missing transverse energy, and
transverse mass calculated with charged lepton and missing transverse energy that satisfies the decay condition of W -boson.
These conditions enhances events with leptonically decaying W boson and suppresses events with fake leptons. Also events with di-leptons such as Z+jets, di-boson productions and di-lepton decay channel of tt productions are suppressed.
In order to improve the S/N ratio of the signal, events are required to have:
at least four jets, and
at least one b-tagged jet.
These conditions suppress background events from W +jets and single top productions. Details of the selection conditions are described in Chapter 5.
2.5 tt event Reconstruction
In order to obtain the kinematic variables of the tt system, such as mtt and ytt the likelihood fit is applied to the objects in the final state of the selected events. In the likelihood the probabilities of produced particles, a charged lepton, a neutrino and quarks, having observed energies of a lepton, missing transverse energy and jets, are included as a transfer function of the energy of produced particles and that of observed objects. The invariant masses of decay products of top, anti-top and W bosons are also taken into account as a shape of Breit-Wigner functions to the likelihood. By maximizing the likelihood value, the kinematics of the tt system is reconstructed
from observed objects and the variables, mtt and ytt for which we measure the differential cross sections, are calculated.
Differential cross sections, σi, are calculated by the following formula:
σj = ΣiM
−1 ij [N
signal
i − NiBG]
²jL (2.2)
where Nisignal is the number of observed signal events in the i-th bin of the variable, Nisignal is the number of estimated background events in the same bin, ²j is the efficiency for the event of which truth variable falls in the j-th bin, L is the integrated luminosity and Mij−1 is the inverted migration matrix. The migration matrix, which expresses the relation between true and measured values of the variable, is estimated by comparing truth information with measured value using simulated events. In order to obtain the inverted matrix the “Unfolding” technique is adopted. By correcting with the detector efficiencies and the integrated luminosity, the differential cross sections are obtained.
The details of the reconstruction of the kinematics is described in Chapter 6, and that of the method of obtaining the differential cross section is described in Chapter 9.
However to extract true level differential cross section to compare the theoretical predictions and other experimental results, reconstructed mttand yttare transformed to parton level distribu- tion by “Unfolding Technique”. The details of this conceptual eq. (2.2) and unfolding technique are explained at Chapter 9.
From the distributions of these variables, the differential cross sections are calculated using the “Unfolding” technique. The distributions of reconstructed variables are corrected with an reversed migration matrix via “Unfolding” technique and are transformed to those of generated variables.
Chapter 3
Accelerator and Detector
The Large Hadron Collider (LHC) is the largest and highest-energy hadron collider among the facilities for high energy physics that are currently in operation. The LHC beam parameters are summarized in Table 3.1. It is a two-ring, superconducting accelerator located at CERN (Geneva, Switzerland), and installed in the 27 km long former LEP tunnel, aiming the discovery of the Higgs boson and the search for new physics beyond the standard model. The LHC was operated at center of mass energy of 7 TeV in 2011, 8 TeV in 2012 with 50 nsec beam crossing and will be operated at 14 TeV with 25 nsec beam crossing. This analysis used the data of the LHC in 2011 The designed value of the peak luminosity is 1034cm−2s−1 and the highest peak luminosity in the 2011 operation was 3.65 × 1033 cm−2s−1 as shown in Figure 2.2. The delivered integrated luminosity to the ATLAS detector was 5.61 fb-1 in 2011 (Figure 2.1). The accelerator complex is shown in Figure 3.1. Protons are supplied to Large Hadron Collider(LHC) from the injector chain: Linac2 (50 MeV) - Proton Synchrotron Booster (PSB, 1.4 GeV) - Proton Synchrotron (PS, 25 GeV) - Super Proton Synchrotron (SPS, 450 GeV). The Linac2 duoplasmatron is the source of protons for the CERN accelerator complex. For the ionization of hydrogen, i.e. production of protons, the electron bombardment ionization is a simple process [30]:
H2+ e ⇒ H2++ 2e H2++ e ⇒ H++ H + e
H + e ⇒ H++ 2e H2++ H2 ⇒ H3++ H
H3++ e ⇒ H++ H2+ e
(3.1) The last two processes are important for the efficient protons production.
3.1 The ATLAS Detector
The ATLAS detector is a general purpose particle detector and consists of the following four major parts: the Inner Detector, the calorimeters, the Muon Spectrometer and the magnet systems as shown in Figure 3.2.
Table 3.1: LHC beam parameters for design and in 2011.
Parameters Design 2011
Ring circumference 26658.883 m
Proton energy 7000 GeV 3500 GeV
Peak luminosity 1.0×1034 3.65×1033
Bunch spacing 25 ns 50 ns
Number of bunches 2808 1380
Number of protons per bunch 1.15×10¹¹ 1.25×10¹¹
Beam emittance 3.75 µm 2.9 µm
Number of main bends 1232
Length of main bends 14.3 m
Field of main bends 8.33 T 4.16 T
RMS bunch length 7.55 cm 8.7 cm
RMS beam size 16.7 µm 34 µm
Half crossing angle ±142.5 µrad 120 µrad Plane of crossing vertical (ATLAS)
Figure 3.1: LHC accelerator complex
Figure 3.2: ATLAS detector
3.2 Inner Detector
Inner Detector is located at the innermost part of the ATLAS detector. It is designed to detect tracks of charged particles and measure momenta, impact parameters and vertex positions. The Inner Detector system is consists of three sub-detector systems. They are pixel detector (PIXEL) , semiconductor tracker (SCT) and transition radiation tracker (TRT) from the inside of the de- tector to the outside. Inner two sub-systems: PIXEL and SCT utilize, are semiconductor tracking detectors and provide high-precision measurements of track momenta and vertex with their fine- granularity. On the other hand TRT offers a large number of tracking points with higher average radius. The combination of two types of sub-detector systems gives robust pattern recognition and high precision in both φ and z coordinates. The layout of the Inner Detector system is shown in Figure 3.3. It offers full tracking coverage over |η| < 2.5. All detectors contained in the central solenoid system which provides a nominal magnetic field of 2 T. Parameters of the Inner Detector are also shown in Table 3.2 [31].
Figure 3.3: Inner Detector
3.2.1 PIXEL detector (PIXEL)
The pixel detector consists of three barrel layers at radii of 4 cm, 10 cm and 13 cm, and five disks perpendicular to the beam axis on each side between radii of 11 and 20 cm. It provides three precision measurements over the full acceptance and contains 140 million detector elements, each 50 µm in r − φ and 300 µm in z. The pixel modules for the barrel and the end-cap disks are designed to be identical. Each module is 62.4 mm long and 21.4 mm wide with 46080 pixels of 50 × 400 µm. Thickness of each layer is 280 µm and about 1.7% of a radiation length at normal incidence.
Table 3.2: Parameters of Inner Detector
Resolution η coverage
System Position σ (µm) (106)
Pixels 1 removable barrel layer Rφ = 12, z = 66 ±2.5 2 barrel layers Rφ = 12, z = 66 ±1.7 5 end-cap disks Rφ = 12, R = 77 1.7-2.5 on each side
Silicon strips 4 barrel layers Rφ = 16, z = 580 ±1.4 9 end-cap wheels Rφ = 16, R = 580 1.4-2.5 on each side
TRT Axial barrel straws 170 (per straw) ±0.7
Radial end-cap straws 170 (per straw) 0.7-2.5 36 straws per track
3.2.2 Semiconductor Tracker (SCT)
The SCT detector is located outside of the PIXEL and offers high-precision measurements in the intermediate radial range and designed to provide eight precision measurements per track. The barrel part has eight layers of silicon microstrip detectors. One silicon detector module consists of four silicon microstrip detectors. Each silicon detector is 6.36×6.40 cm2 with 768 readout strips of 80 µm pitch two detectors are wire-bonded together to form a pair and two pairs are glued back to back at 40 mrad angle. The end-cap modules are similar but use tapered strips, with one set aligned radially. The barrel modules form four layers at radii of 30.0, 37.3, 44.7 and 52.0 cm and the end-cap modules are mounted in up to three rings onto nine wheels. The radial range of each end-cap disk is adopted to the η coverage to |η| < 2.5.
3.2.3 Transition Radiation Tracker (TRT)
The TRT consists of straw detectors with small diameter, which can operate under the very high collision rate of the LHC. Electron identification can be possible due to transition radiation photons created in a radiator between the straws. Each straw is 4 mm in diameter and 144 cm length at maximum in the barrel. The barrel consists of about 50000 straws and the end-caps consists of 320000 radial straws. The spacial resolution per straw is 17 µm. In order to detect transition radiation photons signal of straws can be read with two independent thresholds. The barrel section covers pseudo rapidity region |η| < 0.7 and the radial range from 56 to 107 cm, and the two end-caps cover |η| < 2.5 and the radial range from 64 to 103 cm.
3.2.4 Tracking
The ATLAS inner detector tracking is performed following three stages.
1. The hits of the PIXEL and the SCT detectors are converted into clusters. After that space- points on the SCT are formed from the cluster information of behind SCT module using stereo angle. the TRT raw timing information is translated into calibrated drift circles. 2. The track seeds are formed using space-points of the three PIXEL and the first SCT layer.
These seeds are extended throughout the SCT to form track candidates. The candidates tracks are then extended into the TRT to associate drift-circle in a road around the ex- trapolation. Finally the extended tracks are refitted with the full information of all inner detectors.
3. After this track fitting the primary vertices are reconstructed followed by the reconstruction of photon conversions and of secondary vertices.
The momentum resolution of Inner Detector is σpT/p ∼ 0.05%pT⊕ 1%.
3.3 Calorimeters
A view of the ATLAS calorimeters is shown in Figure 3.4 [32]. The calorimetry consists of an electromagnetic (EM) calorimeter covering the pseudo rapidity region |η| < 3.2, a hadronic barrel calorimeter covering |η| < 1.7, hadronic end-cap calorimeters covering 1.5 < |η| < 3.2, and forward calorimeters covering 3.1 < |η| < 4.9.
Figure 3.4: Calorimeters layout


![Figure 4.13: Fractional jet energy resolution as a function of the average jet transverse momenta for the di-jet balance techniques [ 37 ].](https://thumb-ap.123doks.com/thumbv2/123deta/6147438.102162/54.892.246.683.569.845/figure-fractional-resolution-function-average-transverse-momenta-techniques.webp)

![Figure 4.20: Comparison of all tt based scale factors with the combined scale factor based on QCD multi-jet event [ 44 ].](https://thumb-ap.123doks.com/thumbv2/123deta/6147438.102162/61.892.208.709.642.894/figure-comparison-based-scale-factors-combined-scale-factor.webp)
![Figure 5.5: The η − φ dependence of the mu18 medium trigger efficiency scale factor with inner detector track based algorithm at EF (inside-out) [ 45 ].](https://thumb-ap.123doks.com/thumbv2/123deta/6147438.102162/68.892.269.662.198.478/figure-dependence-trigger-efficiency-factor-detector-algorithm-inside.webp)
