1
Structural Fluctuations of the Escherichia coli Co-
chaperonin GroES Studied by the Hydrogen/Deuterium-
Exchange Methods
Mahesh Shantilalji Chandak
Department of Functional Molecular Science,
School of Physical Sciences,
The Graduate University for Advanced Studies (Sokendai)
A dissertation submitted for the degree of Doctor of Philosophy
2 Abstract
The thesis consists of four chapters, Chapter 1. "General introduction,” Chapter 2. "The use of spin desalting columns in DMSO-quenched H/D-exchange NMR experiments," Chapter 3.
"The H/D-exchange kinetics of the Escherichia coli (E. coli) co-chaperonin GroES studied by 2D NMR and DMSO-quenched exchange methods," and Chapter 4. "Summary and future perspectives."
In Chapter 1, I describe general introduction about protein folding, molecular chaperones and hydrogen-exchange techniques. For proper biological functions of proteins, they have to fold into the native three-dimensional (3D) structures. How a protein folds from its primary structure into the native 3D structure has been a major research interest in the field of biophysical, biochemical and biomedical sciences. As the interior of biological cell is very much crowded, the cytoplasm does not serve as an ideal place for protein folding, and there exist machineries which assist protein to fold into the native state in vivo, and such machineries are called “molecular chaperones.” Among all chaperones, the GroEL/GroES complex, found in E. coli, is one of the extensively studied molecular chaperones. The GroEL/GroES chaperonin complex is very huge with the co-chaperonin GroES of a molecular weight of 73 kDa (7 subunits) and GroEL of a molecular weight of 800 kDa (14 subunits), resulting in the megadalton chaperonin machinery. There are a number of studies on the GroEL/GroES complex, but the structural flexibility and fluctuations of the chaperonin complex remains to be understood. For free heptameric GroES and the GroES portion of the GroEL/GroES complex, however, it is quite feasible to characterize the structural fluctuations by the hydrogen/deuterium (H/D)-exchange methods combined with two-dimensional (2D) nuclear magnetic resonance (NMR) spectroscopy, although we still need sophisticated new techniques to overcome low quality of the GroES spectra taken by the conventional NMR techniques. The use of the H/D-exchange methods can shed light on the
3
structural flexibilities and dynamic behavior of the GroEL/GroES complex. In the H/D-exchange methods, the peptide amide protons are exchanged with solvent deuterons at every amino-acid residue, and the H/D-exchange reactions can be monitored as time-dependent changes in the amide-proton signals by NMR spectroscopy. With the help of observed H/D-exchange rate constants and predicted theoretical H/D-exchange rate constants, we can easily evaluate protection factors for the individual amino-acid residues, which ultimately gives us crucial information about the structural fluctuations and dynamics of the chaperonin complex. Hence, the general introduction of Chapter 1 gives brief descriptions of these aspects.
In Chapter 2, I describe a new method, which I developed for measurement of H/D-exchange kinetics, i.e., the use of spin desalting columns in dimethylsulfoxide (DMSO)-quenched H/D- exchange NMR experiments. The DMSO-quenched H/D-exchange (DMSO-QHX) method is a powerful method to characterize the H/D-exchange behaviors of proteins and protein assemblies, and it is potentially useful for investigating non-protected fast-exchanging amide protons in the unfolded state. However, this method has not been used for studies on fully unfolded proteins in a concentrated denaturant or protein solutions at high salt concentrations. In all of the current DMSO-QHX studies of proteins so far reported, lyophilization was used to remove D2O from the protein solution, and the lyophilized protein was dissolved in the DMSO solution to quench the H/D-exchange reactions and to measure the amide proton signals by 2D NMR spectra. The denaturants or salts remaining after lyophilization thus prevent the measurement of good NMR spectra. In this new method, I found that the use of spin desalting columns is a very effective alternative to lyophilization for the medium exchange from the D2O buffer to the DMSO solution. In this method, the medium exchange by a spin desalting column took only about 10 min in contrast to an overnight length of time required for lyophilization, and the use of spin desalting columns has made it possible to monitor the H/D-exchange behavior of a fully
4
unfolded protein in a concentrated denaturant. I analyzed H/D-exchange kinetics of the unfolded ubiquitin in 6.0 M guanidinium chloride and related results are discussed in Chapter 2.
In Chapter 3, I studied H/D-exchange reactions of peptide amide protons of free heptameric GroES complex. To map H/D-exchange kinetics, I used two different techniques: (1) 2D 1H–15N transverse-optimized NMR spectroscopy and (2) the DMSO-QHX method combined with conventional 1H–15N heteronuclear single quantum coherence (HSQC) spectroscopy. By using these techniques together with direct HSQC experiments, I quantitatively evaluated the exchange rates for 33 out of the 94 peptide amide protons of GroES and their protection factors, and for the remaining 61 residues, I obtained the lower limits of the exchange rates. The protection factors of the most highly protected amide protons were on the order of 106–107, and the values were comparable in magnitude to those observed in typical small globular proteins, but the number of the highly protected amide protons with a protection factor larger than 106 were only 10, significantly smaller than the numbers reported for small globular proteins, indicating that the significant portions of free heptameric GroES are flexible and natively unfolded. The highly protected amino-acid residues with a protection factor larger than 105 were mainly located in three β-strands that form the hydrophobic core of GroES, while the residues in a mobile loop (residues 17–34) were not highly protected. The protection factors of the most highly protected amide protons were orders of magnitude larger than the value expected from the equilibrium unfolding parameters previously reported, strongly suggesting that the equilibrium unfolding of GroES is more complicated than a simple two-state or three-state mechanism and may involve more than a single intermediate.
In Chapter 4, I summarize the present study and discuss future perspectives. Development of the spin-column technique was very useful to follow the H/D-exchange kinetics of free GroES and the GroEL/GroES complex, whose solutions contained certain amounts of salts, as well as to study fully unfolded ubiquitin in 6.0 M guanidinium chloride. The H/D-exchange protections
5
were mostly observed in strands B, C and D of free heptameric GroES, but the mobile loop region formed by residues 17–34 and the reverse turn formed by residues 49–52 were not highly protected against the H/D-exchange. Hence, these results of Chapters 2 and 3 are summarized in this chapter. In addition, I also describe preliminary results of the H/D-exchange kinetics of the GroES complexed with a single ring mutant (SR1) of GroEL in the presence of ADP. In this preliminary study of the SR1/GroES complex, I observed significant protections (protection factors of 105–106) for the amide protons in the mobile loop region (residues 17–34), indicating that the mobile loop is highly organized and plays a significant role when the co-chaperonin GroES forms a complex with SR1. Thus, the study in my thesis has overall clarified detailed changes in the dynamic behaviors of the GroES portion of the GroEL/GroES chaperonin complex.
6 Abbreviations:
DMSO : Dimethylsulfoxide
H/D : Hydrogen/deuterium
NMR : Nuclear magnetic resonance 1D : One-dimensional
2D : Two-dimensional 3D : Three-dimensional
HSQC : Hetero-nuclear single quantum coherence GdmCl : Guanidinium chloride
DCA : Dichloroacetic acid E. coli : Escherichia coli
TROSY : Transverse relaxation-optimized spectroscopy
RF : Radio-frequency FID : Free induction decay
T2 : Transverse-relaxation time DD : Dipole-dipole interactions CSA : Chemical shift anisotrophy
Cyt c : Cytochrome c PDB : Protein data bank
7
HPLC : High-performance liquid chromatography N7 : Native heptameric GroES
U : Unfolded monomeric GroES M : Folded monomeric GroES.
Tris : Tris (hydroxymethyl) aminomethane
DMSO-QHX : DMSO-quenched H/D-exchange
Pf : Protection factor
kopen : The rate constant for structural opening kclose : The rate constant for structural closing
SR1 : A single ring mutant of GroEL
Geff : The effective Gibbs free-energy change of unfolding
kint : The intrinsic exchange rate constant
KU : The equilibrium constant of unfolding
Kd :The equilibrium dissociation constant
GU : The Gibbs free-energy change of unfolding of GroES per monomer unit
EDTA : Ethylenediaminetetraacetic acid
8
Thesis contents
Abstract
2Abbreviations
6Contents
8Chapter 1. General introduction
111.1. Protein folding
121.2. Chaperonin — folding machinery
14 1.2.1. GroEL/GroES complex 15 1.2.2. The GroEL/GroES reaction cycle 191.3. Hydrogen-exchange techniques
221.3.1. The mechanisms of the H/D exchange 23 1.3.2. The H/D exchange and structural fluctuations 26
1.4. 2D NMR Spectroscopy
301.4.1. 2D HSQC 30
1.4.2. TROSY 32
1.5. Scope of this study
359
Chapter 2. The use of spin desalting columns in DMSO-quenched
H/D-exchange NMR experiments
372.1. Introduction
382.2. Results and discussion
392.3. Materials and methods
452.3.1. Chemicals 45
2.3.2.15N-labeled ubiquitin 45
2.3.3. DMSO-QHX experiments 46
2.3.4. NMR measurements 47
2.3.5. Data analysis 47
Chapter 3. The H/D-exchange kinetics of the Escherichia coli co-
chaperonin GroES studied by 2D NMR and DMSO-quenched
exchange methods
493.1. Introduction
503.2. Results
523.2.1. NMR spectra of GroES 52
3.2.2. H/D-exchange kinetics of GroES 56
3.2.3. Kinetic progress curves of H/D-exchange 59
10
3.2.4. H/D-exchange progress curves of unidentified amide protons 64
3.2.5. Protection profile 66
3.3. Discussion
673.3.1. The H/D-exchange behaviors 69
3.3.2. Effective thermodynamic stability of GroES 73
3.3.3. Global unfolding of GroES 74
3.3.4. A possible molecular mechanism of the GroES unfolding 78
3.4. Materials and methods
793.4.1. Materials 79
3.4.2. H/D-exchange measurements 80
3.4.3. Data analysis 83
Chapter 4. Summary and future perspective
87Acknowledgements
92References
9411
Chapter 1. General introduction
12
1.1. Protein folding
For proper functions of proteins, they have to fold into the correct native 3D structures. From decades ago, the protein folding problem has been evolved as a key area of research interest in molecular biology, biochemistry and biophysics. How a protein folds from the primary structure into its functionally active native 3D conformation is still a most important question in biological sciences.
In early 1960s, Anfinsen and his co-workers[1] worked on ribonuclease A, and they have shown that the native structure of the protein is thermodynamically most stable (thermodynamic hypothesis) and that it is attained only by the primary structure (genetic information), i.e., no additional information is required for attaining the native structure. The thermodynamic hypothesis thus states that the 3D structure of a native protein in its normal physiological milieu (solvent, pH, ionic strength, presence of other components such as metal ions or prosthetic groups, temperature, and other) is the one in which the Gibbs free energy of the whole system is lowest, that is, the native conformations are determined by the totality of interactions and hence by the amino-acid sequence, in a given environment.
However, the thermodynamic hypothesis alone is not enough to elucidate the molecular mechanisms of protein folding. For example, a protein of 100 residues will have 99 peptide bonds, which means that it will have 198 backbone dihedral angles (99 and 99 angles). If every dihedral angle takes one out of three possible conformations, then there are 3198 (= 3.0×1094) possible conformations for the whole molecule. So, if the protein has to experience all these possible conformations by random search before it reaches to the unique native state (this does not violate the thermodynamic hypothesis), the time required for folding will be much longer than the time of the universe, i.e., the protein can never fold. In 1968, Cyrus Levinthal[2] proposed this paradox (Levinthal's paradox), which states that although a protein generally has a
13
vast size of the conformational space, the protein can search and attain the native state very quickly; sometimes the time required for folding is as short as microseconds. Therefore, the protein takes only a very limited number of its possible conformations during folding. Levinthal thus proposed that there is a specific pathway of folding and that this specific pathway is also encoded in the amino-acid sequence.
If there is the specific pathway of folding, there must be specific folding intermediates along the folding pathway. Major objectives of experimental studies of protein folding are to detect and characterize such folding intermediates. However, the folding intermediates lives for a very short period of time often less than 1 s, so that it is very difficult to isolate and study them by conventional biophysical techniques. To detect and characterize the transient folding intermediates, we thus use a variety of kinetic techniques, including stopped-flow circular dichroism, stopped-flow fluorescence, stopped-flow X-ray scattering, and H/D-exchange labeling 2D NMR techniques. Until now, several different models of protein folding have been proposed on the basis of the experimental results so far reported, and these models may include a framework model, a hydrophobic-collapse model, and a nucleation-condensation model.[3]
Another view that also resolves the Levinthal's paradox is a funnel theory, which was first proposed by Onuchic and Wolynes in early 1990s.[4] In the funnel theory, the protein folding is represented as a trajectory in a conformation-energy hyperspace that represents the energy landscape of protein conformations. In the funnel theory, a protein can fold into the native conformation, because there is always an energy bias toward the native conformation everywhere in the conformation-energy hyperspace. The funnel theory is quite popular in the theoretical and computational studies of protein folding, but it is difficult to determine a real shape of the folding funnel by experiments.
14
1.2. Chaperonin — folding machinery
The interior of biological cell is very much crowded, and the effective concentration of a proteins in E. coli cells has been estimated as high as ~300 mg/ml.[5] Because of such high concentrations of proteins and several other biomolecules, the cytoplasm does not serve as an ideal place for protein folding. Protein folding at such a high concentration results in irreversible aggregation between protein molecules that have not yet fully folded. Therefore, there exist proteinous molecular machineries that assist other proteins to fold into the native state by preventing the irreversible aggregations. Such machineries are called as “molecular chaperones”, and the molecular chaperones are also required for degradation, translocations and repair of various proteins in vivo.[6, 7] Among various molecular chaperones, the chaperonin is quite unique and specialized for assisting protein folding. It has a ring-like structure, consisting of the tetradecameric or hexadecameric protein supermolecular complex with a central cavity. A primary role of the chaperonin is thus to bind non-native proteins and trap them inside the cavity to assist the folding by segregating immature folding intermediates from crowded external environment. Protein folding, maintenance of proteome integrity, and protein homeostasis (proteostasis) critically depend on a complex network of molecular chaperones.[8]
There are two types of the chaperonin, the group I and the group II chaperonins. They have similar double-ring structures with each ring consisting of seven subunits for the group I and eight or nine subunits for the group II chaperonin, but they are different in the amino-acid sequence. The group I chaperonins (chaperonin 60s) are found in eubacteria such as E. coli and in the mitochondria and the chloroplast of eukaryotic cells, and the best-characterized group I chaperonin is GroEL of E. coli. The group I chaperonin has its partner protein (chaperonin 10), which act as a lid when it binds to chaperonin 60. Chaperonin 10 is also called co-chaperonin, and the co-chaperonin of GroEL is GroES. The group II chaperonins are found in the cytosol of
15
the Eukarya and the Archaea, and they are hetero-oligomeric. The group II chaperonin does not have the co-chaperonin, but it has a helical protrusion in the apical domain of the chaperonin subunit itself, and the helical protrusions of the chaperonin ring function like a lid to encapsulate a substrate protein.[9,10] The eukaroytic chaperonin, TRiC or CCT, contains eight different subunits per ring with each subunit having molecular weight of 50 to 60 kDa, whereas the archeal thermosome consists of one to three different subunits, which are arranged in eight- or nine-member symmetrical rings.[9,11] They also assists protein folding in vivo in an ATP- dependent manner, and the folding-assisting mechanism of the group II chaperonins are less understood than that of the group I chaperonins.
1.2.1. GroEL/GroES complex
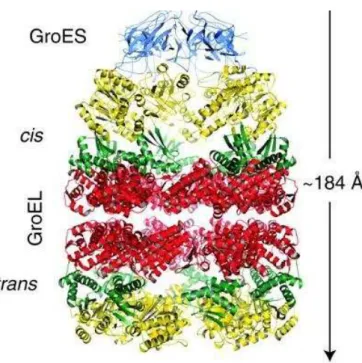
Figure 1-1 shows the overall architecture of GroEL/GroES complex. The E. coli chaperonin complex, GroEL/GroES, is a widely studied chaperonin, consisting of 14 subunits of GroEL (Mw = 58 kDa for a subunit) and 7 subunits of GroES (Mw = 10.4 kDa), adding up to the total molecular weight of 882 kDa.[12] The chaperonin GroEL/GroES assists at least 250 different cytosolic proteins to fold into the native state in E. coli.[13] In the presence of ADP or ATP, the GroEL/GroES complex is formed, and the GroES ring acts as a lid in the complex. ATP binds tightly and is hydrolyzed on only one heptameric ring of the GroEL at a time, thus inducing allosteric transition in the GroEL oligomer even in the absence of GroES.[14] In addition, allosteric transitions are induced by metal fluoride-ADP complex, an analogue of ATP.[15] A non-native protein is encapsulated within the central cavity of the GroEL/GroES complex, and then it is released. This process takes a half time of about 10 to 30 s.[16]
16
Figure 1-1. Overall architecture and dimensions of GroEL and GroEL-GroES-(ADP)7. Van der Waals space-filling models (6 Å spheres around C) of GroEL (left) and GroEL-GroES-(ADP)7 (right). The left panel shows the outside view, showing outer dimensions, and the right panel shows the insides of the assembly and was generated by slicing off the front half with a vertical plane that contains the cylindrical axis. Various colors are used to distinguish the subunits of GroEL in the upper ring. The domains are indicated by shading: equatorial, dark hue; apical, medium hue; intermediate, light hue. The lower GroEL ring is uniformly yellow. The figure was taken from Sigler et al. with permission.[17]
GroES
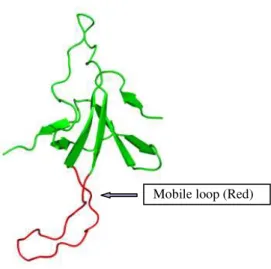
GroES is a heptameric (seven-member ring) complex, having each subunit with a molecular weight of 10.4 kDa. The GroES crystal structure was determined at 2.8 Å, and it has a dome-like structure, approximately 75 Å in diameter and 30 Å in height, with an 8 Å orifice in the center of its roof.[19] GroES contains two loop regions, a flexible mobile loop of residues 17–34, which is involved in the binding to GroEL,[19-21] and a roof hairpin loop of residues 44–58.[19] Electron- micrographic studies have shown that GroES is placed at the top of one polypeptide binding chamber of GroEL to form a stable GroES7-GroEL14-ADP7 complex.[12, 22] Figure 1-2 shows schematic representation of the monomeric subunit of GroES.
17
The binding of GroES triggers conformational changes both in the GroES adjacent end and at the opposite end of the GroEL cylinder, which prohibits the association of a second GroES oligomer. A substrate polypeptide and GroES bind to the same ring of GroEL and released after ATP hydrolysis.[23, 24]
Figure 1-2. Ribbons drawing of one subunit in the GroES ring .
GroEL
GroEL is a thick-walled cylinder of 140 Å in a height and of 135 Å in an outer diameter, and it is thus hollow with the central cavity.[18] The monomer subunit of GroEL consists of 547 amino acids arranged in three different domains: (1) The apical domain, which is locally more flexible than the other domains, has binding sites for substrate proteins and GroES, and is considerably less well ordered; (2) the intermediate domain, which connects the apical and equatorial domains; and (3) a well-ordered, highly α-helical, “equatorial” domain, which provides residues for the inter- and intra-ring interactions of the protein complex, and it also contributes most of the residues that constitute the binding site for ADP and ATP. [17]
Mobile loop (Red)
18 Formation of the GroEL/GroES Complex
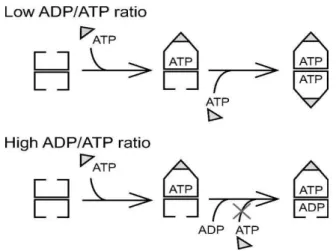
As shown in Figure 1-3, in the presence of ADP or ATP, the GroEL/GroES complex is formed. There are two kinds of the GroEL/GroES complex, one is the asymmetric GroEL14- GroES7 complex called a “bullet-type” complex, whereas the other is the symmetric GroES7-
GroEL14-GroES7 complex called a “football-type” complex. The football-type complex is formed when both rings of GroEL are occupied by ATP. Schematic model for football and bullet type GroEL/GroES complex is shown in Figure 1-4.
Figure 1-3. The crystal structure of the asymmetric GroEL/GroES complex (PDB code: 1AON). Cis, the GroES- bound chamber of GroEL, and trans, the opposite GroEL ring. The figure was taken from Hartl et al. with permission.[27]
19
Figure 1-4. A schematic model for the reaction mechanism of GroEL and GroES. The figure was taken from Sameshima et al. with permission.[39]
However, the hydrolysis of ATP to ADP inhibits the binding of another ATP with the trans- ring of the bullet-type complex, and as a result, the second GroES does not bind to the trans-ring of GroEL.[25] Protein folding in chaperonin is based on successive rounds of binding and release, and partitioning between committed and kinetically trapped intermediates.[26]
1.2.2. The GroEL/GroES reaction cycle
Figure 1-5 indicates overall GroEL/GroES reaction cycle, the reaction cycle of GroEL/GroES association is highly dynamic. The binding of ATP to GroEL is the primary requirement for binding of GroES to GroEL, and the binding and hydrolysis of ATP leads to the series of conformational changes in the apical domain of GroEL. At a physiological concentration of ATP (~1 mM), GroEL binds to ATP cooperatively within the seven sites of one ring. Upon binding of ATP, the apical domains tilt together with the intermediate domains, begin to elevate themselves, then detach from each other, expand radially, and finally elevate further
20
for the binding of a substrate protein.[28] The substrate protein binds to the tilting and elevating domains of GroEL, and the simultaneous binding of the nonnative substrate protein by the C- terminal tails and the lower segments of the cis apical domains provides a mechanism for retaining the bound nonnative substrate protein while the GroEL ring shifts into another state to permit loading of GroES.[22] As the binding of GroES is dependent on ATP, the GroES will rapidly bind to the same ring of GroEL, where ATP is bound, whereas the other end of GroEL remains accessible to the substrate polypeptide.[23, 29] The GroES binding to GroEL leads to a doubling in volume of the central cavity in the bound GroEL ring, and as a result, major conformational changes in the apical domains of GroEL occur. The apical domains then rotate upward to make contact with the mobile loops of the GroES ring. After docking of GroES, the apical domains of GroEL elevate, and the massive twist provides a power stroke of the chaperonin movement, which ejects the substrate protein to collapse inside the final folding chamber.[28]
The surface residues of GroEL are highly mobile, so that it can accommodate various non- native folding intermediates or unfolded proteins and a wide variety of substrates that expose hydrophobic surfaces.[30, 31] The interaction between GroEL and the substrate has been proposed to be largely hydrophobic because GroEL interacts with proteins in non-native conformations but not in native forms.[32] It has been found that mutations from hydrophobic to hydrophilic residues in the surface region lead to unfunctional GroEL, i.e., it doesn’t assist protein folding.[33]
The interior surface of the trans ring of GroEL consists of hydrophobic amino acids, but the conformational transitions of GroEL induced by the GroES binding change the inner surface of the central cavity from hydrophobic to hydrophilic residues. Therefore, the non-native protein inside the cavity of the GroEL/GroES complex then gets surrounded by the hydrophilic environment, and this opens up a chance for the substrate protein to fold into the native state.[12]
21
The folding of the substrate protein takes place in the cis cavity of the GroEL/GroES/ATP complex, and there is ATP hydrolysis in the cis ring, weakening the affinity of GroEL for GroES. Then, the binding of ATP at the trans ring of the GroEL/GroES/ADP complex takes place, further weakening the interaction between GroEL and GroES, and this gives a signal for substrate-polypeptide (ligand) release and the release of GroES and ADP.[26, 34]
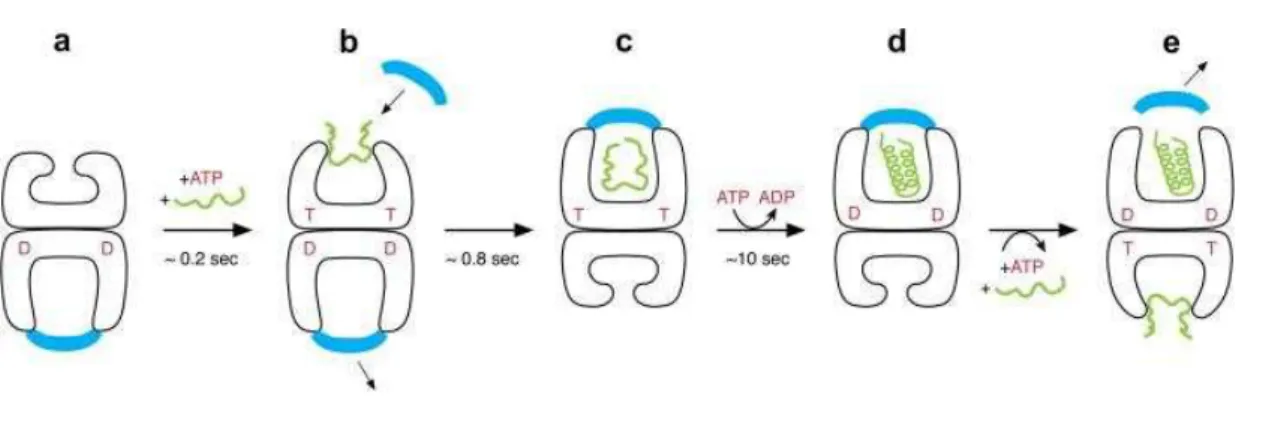
Figure 1-5. The chaperonin reaction cycle- An asymmetric GroEL/GroES/ADP complex (a) is the normal
acceptor state for ATP (red; also indicated as T) and a non-native polypeptide (green), and they bind to the open ring opposite the one bound by GroES (blue) and ADP (red D) (b). ATP binding produces small rigid- body domain movements of the apical domains in the bound ring (b), enabling GroES binding, attended by large rigid body movements that produce the stable folding-active cis complex end-state (c). This folding- active state is the longest-lived state of the reaction cycle, ∼10 s, followed by ATP hydrolysis (c → d), which then gates the entry of ATP and polypeptide into the opposite trans ring, rapidly discharging the cis ligands (e) and initiating a new folding-active cycle on the ATP/polypeptide-bound ring. The figure was taken from Horwich et al. with permission.[37]
An inward tilt of the cis equatorial domain causes an outward tilt in the trans ring, and the ATP binding is thus cooperative within one ring and anti-cooperative between the two rings,
22
which allows alternative folding in the two chambers, i.e., the substrate enclosure in one ring leads to the substrate release in the other ring Thus, the two rings of GroEL acts in an anti- cooperative manner, favoring binding of ATP and GroES at only one ring at one time.[12, 35, 36]
Upon ATP binding to the trans ring of the complex, GroES leaves first, followed by the ligand release in any of the three conformational states: the native state, a conformational state that is highly committed to reach at the native state, and a non-native state. All non-native polypeptides again bind to GroEL for the next trial to fold into the native state.[23, 26, 37]
The binding of ATP at the trans ring also triggers binding of non-native substrate protein and GroES, thus converting it into the new cis ring, and this chaperonin cycle continues until the non-native protein is fully folded into the native state.[38]
1.3. Hydrogen-exchange techniques
Structural fluctuations and dynamics of proteins are important factors to control proper biological functions of proteins, and alterations in these properties may result in malfunctions of proteins. The H/D-exchange technique is a unique experimental technique by which we can detect protein’s small structural fluctuations, which cannot be observed by conventional spectroscopic and other biophysical techniques.
In addition, this technique is also useful to study chemically or physically denatured states, and equilibrium or kinetic folding intermediates, in which direct determination of 3D structure is not possible. In the hydrogen-exchange method, we measure exchange reactions of peptide amide protons of a protein with protons of solvent water. When we use heavy water (deuterium oxide, D2O) as a solvent, the H/D-exchange reaction can be monitored by 1H NMR spectroscopy as time-dependent changes in the amide-proton signals. Uniformly 15N-labeled proteins and 1H–
23
15N HSQC- NMR spectra are often used for this purpose. The H/D-exchange reaction of the peptide amide proton thus takes place at every amino acid position except proline residues which do not have the amide group. Along with the peptide amide groups, the protons in polar side chains are also exchanged with solvent deuterons, but they are often exchanged too rapidly to monitor by the HSQC spectra.
1.3.1. The mechanisms of the H/D exchange
The H/D-exchange reaction of a freely exposed amide proton in D2O is expressed by
2 int
N-H + D O k N-D + DOH (1-1)
where kint is the intrinsic rate constant for the chemical H/D-exchange process of the amide group. The exchange reaction of a particular amide group can be sterically blocked by neighboring bulky side chains or induced by neighboring polar side chains; therefore, the exchange rates of individual amides vary with the amino acid sequence.[40] The kint value is affected by various factors, including pH, temperature, and inductive and steric effects of side chains.[41, 42] If all these factors are taken into consideration, we can calculate the intrinsic exchange rates of individual amide protons of a protein from its amino-acid sequence. The methods of Bai et al.[43] and Connelly et al.[44] are usually used for calculating the kint values from the amino-acid sequence of a protein. The actual observed exchange rate, kex, of a folded native protein is also affected by the 3D protein structure and structural fluctuations, and at neutral pH and room temperature, the half time of the H/D-exchange ranges from milliseconds to months.
The H/D-exchange kinetics of a native protein is interpreted by a three–state model, in which we assume the presence of three states, (1) a non-exchangeable state (NHclosed), in which the amide proton is protected from the H/D-exchange, (2) an exchangeable state (NHopen), in which
24
the amide proton is freely exposed to solvent and exchanged with solvent deuteron with an intrinsic exchange rate constant kint, and (3) an exchanged state (NDexchanged), in which the amide proton is already exchanged with solvent deuteron, this model is represented as
open int
close
closed open exchanged
NH k NH k ND
k
(1-2)
where, kopen is the rate constant for structural opening, which makes the amide proton fully accessible to solvent, and kclose is the rate constant for structural closing, which fully protects the amide proton from the H/D-exchange. Therefore, in this model, there are opening-closing equilibria for individual amide protons in a protein, and the equilibrium constant for the opening reaction (Kopen) is given by
open open / close
K k k (1-3)
The opening reaction of a native protein is brought about by local structural fluctuations, by partial unfolding, and sometimes also by global unfolding of the protein. By assuming the steady state in Equation (1-2), the observed exchange rate constant kex is represented by
ex open int / ( open close int)
k k k k k k (1-4)
Becausekclose kopen, it follows that
ex open int / ( close int)
k k k k k (1-5)
There are two limiting mechanisms (EX2 and EX1 mechanisms) for the three-state model of the H/D-exchange. In the EX2 mechanism, kclose is much larger than kint, the opening and closing occurs repeatedly before the H/D exchange step, so that
close int close
(k k )k (1-6)
25 Therefore, from Equation (1-5), we have
ex open int / close ( open / close) int open int
k k k k k k k K k (1-7)
The observed exchange rate constant kex is thus given by the intrinsic exchange rate (kint) multiplied by the fraction of time that the amide proton is accessible for H/D-exchange (Kopen). The opening equilibrium constant Kopen is thus given by a ratio of the observed and intrinsic exchange rate constants as,
open ex/ int
K k k (1-8)
The protection factor (Pf) of the amide proton against the H/D-exchange is defined as the inverse of Kopen, and hence given by
f int/ ex
P k k (1-9)
However, when kclose kint the H/D-exchange takes place in every opening step with kint (EX1 mechanism), so that
close int int
(k k )k (1-10)
The observed exchange rate constant kex is thus given by
ex open. int / int open
k k k k k (1-11)
In the EX1 mechanism, the overall exchange reaction is thus rate-limited by the structural opening step of the protein. The EX1 mechanism is usually observed at a highly alkaline pH, where kint is very large, and at neutral and acidic pH region, the EX2 mechanism prevails in most globular proteins.
26 1.3.2. The H/D exchange and structural fluctuations
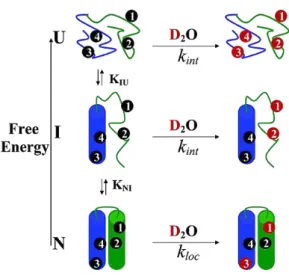
It has been widely studied and accepted that the H/D-exchange behavior of proteins depends on fluctuations in their structure. The exchangeable protons of proteins are distributed over the entire region, and they form structurally crucial hydrogen bonds in the -helices, -strands, and bends. Their exchange with solvent protons is known to respond to the binding of small and large molecules, to allosteric and other alterations, and to solution and environmental variables. Thus the H/D-exchange analysis provides useful information about the structural fluctuations at many sites along the polypeptide chains, their dependence on local structure and structural changes, and their interplay with biological functions.[45] As shown in Figure 1-6, the H/D- exchange reactions of a protein in the native state take place through (1) local fluctuation (2) partial unfolding, and (3) global unfolding of the protein molecule.[46, 47]
Local Fluctuations
There are many proteins which have local fluctuations in the solution. The most important factors for protection against the H/D-exchange are hydrogen bonding of amide protons and protection from solvent penetration in the interior of protein. The hydrogen exchange is mainly affected by protein mobility and structural flexibility, which break hydrogen bonds of amide groups that are exposed on the protein surface. Sometimes, amide protons that are highly buried or hydrogen bonded can be exchanged through structural fluctuations that allow transient exposure of the amide groups or transient solvent penetration. The small amplitude fluctuations which change solvent protected hydrogen to a solvent exposed hydrogen are completely reversible, these motions are described as the local fluctuations. A local unfolding can involve one or many amide groups of a protein and is result in simultaneous exposure of the amides to the solvent.[45]
27
Maity et al.[48] replaced a surface lysine residue (Lys8) in recombinant cytochrome c (cyt c) with glycine. The lysine to glycine mutation has no effect on the native protein structure, but it induced a large change on the protein stability, which allowed them to study the effect of local fluctuations on the protein H/D-exchange pattern.
In general, the amide protons which are on the surface of proteins are highly accessible to the solvent and are easy to exchange with the solvent deuterons, whereas the amide protons which are deeply buried in a core region of a protein are inaccessible and are slow to exchange. The observed exchange rate constant kex values of the amide protons exchanged by local fluctuations generally do not show any significant dependence on the concentration of a denaturant (urea or guanidinium chloride (GdmCl)).
Partial unfolding
In the partial unfolding, one or more domains of a protein remain folded, whereas the other domains are unfolded. By measuring the H/D-exchange kinetics of the peptide amide protons, which are identified by 2D NMR spectra and also by studying the dependence of the exchange kinetics of these amide protons on denaturant concentration, it is often possible to characterize the amide protons that are exchanged by partial unfolding, and to determine which portion of the protein exhibits transient partial unfolding under the native condition. The kex values of the amide protons exchanged by partial unfolding show significant dependence on denaturant concentration, but the slope of the ln kex vs. denaturant concentration plot is smaller than that for the amide protons exchanged by global unfolding. Over the years, amide H/D-exchange techniques have been developed which have allowed the characterization of a number of different partially folded states: heterogeneous equilibrium molten globule states; rare, partially
28
folded conformations in equilibrium with the native conformation; and transient intermediates in the kinetic folding process.
Wani et al.[49] studied folding of an SH3 domain by H/D-exchange techniques in the absence and in the presence of a denaturant (GdmCl). In the absence of the denaturant, unfolding occurs in two steps. In the first step, amide protons protected against the H/D-exchange lose their protection, and an intermediate is formed. In the second step, all amide hydrogen sites become unprotected during transient formation of the unfolded SH3 domain. In the presence of a 1.8 M of the denaturant, the unfolding reaction also occurs in the two steps, formation of the intermediate followed by unfolding of the SH3 domain with the same structural transition studied in the absence of the denaturant. Thus, the initial unfolding intermediate has the same structure in both conditions.
Arai et al.[50] studied formation of a molten globule intermediate in refolding of α- lactalbumin. In this study, they found that the burst-phase intermediate is characterized as a state that has substantial, hydrogen-bonded secondary structure and a hydrophobic surface highly exposed to solvent, but has no rigid side chain packing. Furthermore, the stability of the secondary structure in the burst-phase intermediate is identical with that in the equilibrium molten globule state. H/D-exchange studies on apomyoglobin also predict the formation of partly folded intermediate species.[51]
Global unfolding
If a protein is subjected to global unfolding, highly protected amide protons, which are stabilized by hydrogen bonding or deeply buried inside the protein becomes easily accessible to solvent for H/D-exchange. Even under a strongly native condition, proteins undergo transient
29
global unfolding, which can be detected by the H/D-exchange techniques, although the fraction of the globally unfolded species should be extremely small, often much less than a millionth. Under the EX2 condition, there are amide protons that exchange on a timescale ranging from days to months, and these protons exchange only when the protein is fully unfolded. From the kex value of the amide protons that are exchanged by global unfolding, we can estimate the effective thermodynamic stability (Geff), of the protein, and the Geff is related to Kopen and Pf,[45] obtained by the H/D-exchange experiment, as
open
f f
ef RTlnK lnP
G RT
(1-12)
Figure 1-6. Illustration of three processes of hydrogen exchange for a protein with a partially unfolded intermediate: local fluctuation process (bottom); partial unfolding process (middle); and global unfolding (up). The figure was taken from Bai et al with permission.[47]
30
It is now well established that this relationship exists in many globular proteins that shows the H/D-exchange by global unfolding and that the Geff values are reasonably coincident with the Gibbs free-energy changes of equilibrium unfolding.
The relative importance of local, sub-global and global unfolding depends on experimental conditions, and at a physiological pH and temperature in the absence of denaturant, local unfolding may prevail, whereas at a high concentration of denaturant, the global unfolding becomes predominant. The kex values for the amide protons that are exchanged by global unfolding shows the strongest dependence on denaturant concentration, and as the denaturant concentration increases, the amides that are exchanged by local unfolding shift towards global unfolding. H/D-exchange experiments with cyt c have shown that some hydrogens in cyt c exchange with solvent by transient global unfolding, some through sub-global unfolding, and some through local fluctuations.[46, 52]
1.4. 2D NMR Spectroscopy
1.4.1. 2D HSQC
1D NMR spectra are plots of intensity vs. frequency, and in 2D NMR spectra, the intensity is plotted as a function of two frequencies, F1 and F2. 2D NMR spectroscopy allows data collection in two different time domains (t1 and t2); a successively incremented delay (t1), called evolution period, elapses after an initial radio-frequency (RF) pulse before detection, and then the free- induction decay (FID) caused by another pulse (detection pulse) is acquired during t2. In the HSQC spectroscopy, proton magnetization is transferred to other nuclei like those of 15N and 13C, and after the evolution period, the t1 magnetization is returned back to the proton for observation. The 2D-HSQC spectrum provides correlations between amide protons and 15N or 13C nuclei
31
which are connected with the amide protons. Figure 1-7 shows typical two-dimensional [15N,1H]- correlation experiment; there are four steps for this experiment, i.e., preparation, evolution, mixing and detection. The preparation usually consists of a 90° pulse which excites sample nuclei. During the preparation period, protons thus get excited, creating magnetizations in the x-y plane. During the evolution period, the magnetizations produced by the preparation pulse show time evolutions with frequencies of individual protons with different chemical shifts. The mixing is a combination of RF pulses and/or pulse delay periods, leading to the transfer of magnetization from protons to 15N or 13C nuclei, and this process occurs via direct spin-spin couplings or spin- spin couplings occurring through space. The detection step involves recording the FID produced by the detection pulse and finding the frequency components of 15N or 13C nuclei by Fourier transformation. As a protein has the backbone amide groups, each amide group produces one peak in the spectra except prolines which lack an amide proton. HSQC can also be used in a triple resonance experiment, where each proton is correlated with 15N and 13C, leading to a clear non-overlapped spectra, and this has been used for assignment of individual amide proton peaks.[53, 54]
The recording of 2D NMR data set involves repeating a pulse sequence for increasing values of t1 and recording of the FID as a function of t2 for each value of t1. The 2D NMR signal is thus recorded in the following way. First, with the t1 value set to zero, the FID is recorded after executing the pulse sequence, and then the nuclear spins are allowed to return to equilibrium. Next, t1 is set to ∆t1, the sampling interval in t1, the pulse sequence is executed, and the FID is recorded and stored separately from the first FID. Again the spins are allowed to set at equilibrium, t1 is set to 2∆t1, the pulse sequence is repeated, FID is recorded and stored separately. The whole procedure is repeated again for 3∆t1, 4∆t1, 5∆t1 and so on until sufficient data is recorded.
32
Figure 1-7. In a two-dimensional [15N,1H]-correlation experiment, one first creates proton magnetization. This is then transferred to 15N via a polarization transfer element. After ‘frequency labeling’ of the 15N magnetization during the evolution period, t1, magnetization is transferred back to 1H via a reverse polarization transfer element and then detected on 1H during the acquisition period, t2. The figure was taken from Riek et al. with permission.[55]
1.4.2. TROSY
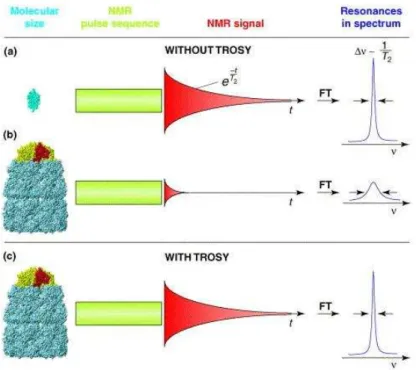
The major problem for studies of biomolecules with a molecular weight larger than 10 kDa is the fast decay of NMR signal due to relaxation. There are two main reasons for the size limit of less than 10 kDa: (1) Spectral crowding due to a large number of overlapping signals, which affects spectral resolution, and (2) NMR signals of a large molecule relax faster due to the fast transverse relaxation rates (1/T2) of nuclei, which ultimately results in the poor resolution and loss of signals due to line broadening. The line width in NMR spectra is inversely proportional to the relaxation rate, which depends on the size of the molecule; therefore, for a large protein with
33
a molecular weight larger than 10 kDa, the relaxation time T2 is very short, and the signal to noise ratio is very poor, leading to collapse of spectral recording.
Two major factors contributing line broadening of proton signals in the 1H–15N HSQC spectra are (1) dipole-dipole (DD) interactions between proton and 15N spins and (2) chemical shift anisotrophy (CSA) of protons. Any magnetic nucleus in a molecule generates an instantaneous magnetic dipolar field that is proportional to the magnetic moment of the nucleus. As the molecules tumble in solution, this field fluctuates and constitutes a mechanism for relaxation of nearby spins. For proteins, the main source of the relaxation by the DD interactions is nearby protons and protons attached to 15N. In TROSY, a protein sample used is thus perdeuterated to suppress these DD interactions. The CSA of protons depends on the orientation of the molecule, as nuclei can have a different magnetic field, depending on the orientations with respect to the applied bulk magnetic field. The CSA increases with increasing the external magnetic field, whereas the DD interactions are independent of the static magnetic field. Chemical shifts reflect the electronic environments that modify the local magnetic fields experienced by different nuclei, and these local fields are anisotrophic. Therefore, the components of local fields vary as the molecule reorients due to molecular motion, contributing as a source of relaxation. TROSY reduces the line broadening and hence the fast decay of the magnetization by recording only the smallest relaxation component of splitted multiplet signals of a nucleus.
TROSY thus exploits constructive interference between the DD-coupling and the CSA and reduce the transverse relaxation rates during the frequency labeling period and acquisition. In 1H-
15N- HSQC, the NMR signals of each nucleus have spin up and spin down positions relative to the external magnetic field, and it splits into two components due to spin-spin coupling, leading to the formation of four peaks. These four peaks are collapsed into a single centrally located peak
34
using decoupling, and such a single peak has an average chemical shift of the four components. However, these four individual peaks have different transverse relaxation rates, leading to the different line-width lines, which are mixed by decoupling, and in case of a large molecular structure studied at high magnetic fields, the line broadening of the individual multiplet components is very much pronounced, resulting in deterioration of the average central peak signal.
Figure 1-8. NMR spectroscopy with small and large molecules in solution. (a) The NMR signal obtained from small
molecules in solution relaxes slowly; it has a long transverse relaxation time (T2). A large T2 value translates into narrow line widths (Δν) in the NMR spectrum after Fourier transformation (FT) of the NMR signal. (b) By contrast, for larger molecules, the decay of the NMR signal is faster (T2 is smaller). This results both in a weaker signal measured after the NMR pulse sequence and in broad lines in the spectra. (c) Using TROSY, the transverse relaxation can be substantially reduced, which results in improved spectral resolution and improved sensitivity for large molecules. The figure was taken from Fernandez et al. with permission.[56]
35
In TROSY, these multiplet peaks are not decoupled, it records only the narrowest, most slowly relaxing component of each multiplet, which is independent of the transverse relaxation rate.[55,56] Figure 1-8 shows the NMR spectroscopy with small and large molecules in solution and the benefits of using TROSY for large molecules.
1.5. Scope of this study
To study the H/D-exchange mechanisms of protein supermolecular complexes, GroES and the GroES portion of the GroEL/GroES complexs, the direct H/D-exchange measurements by conventional 2D NMR spectra are not effective, and I used DMSO-QHX technique. Therefore, I first developed a new technique to carry out the DMSO-QHX analysis. Earlier studies since the inception of the DMSO-QHX methods, lyophilization has been used to remove D2O from the protein solution, and later H/D-exchange reaction was quenched by using a DMSO solution as a solvent. As there is possibility of salt contamination after lyophilization, the amide H/D- exchange measurement may suffer from effective error. I thus developed a new technique for the medium exchange from D2O to the DMSO solution by using Zeba spin desalting columns.[57] The medium exchange by using a Zeba spin column took only about ten minutes as compared with the overnight duration of lyophilization. I successfully mapped amide exchange kinetics of
15N labeled ubiquitin by this technique. The results are described and discussed in Chapter 2.
After this small study, I started my new project in which I studied H/D-exchange kinetics of a large protein complex, i.e., free heptameric GroES. To fully understand biological functions of the chaperonin GroEL/GroES complex, it is necessary to study structural fluctuations of free GroES and the GroES portion of the GroEL/GroES complexes under different nucleotide conditions. Thus, in the present thesis, I further applied the H/D-exchange and 2D NMR
36
techniques to study free heptameric GroES. However, as the molecular weight of the GroES complex is 73 kDa, I couldn’t obtain good NMR spectra. Therefore, I used TROSY for direct H/D-exchange measurements of perdeuterated GroES and also the DMSO-QHX technique with spin desalting columns. The results of these H/D-exchange measurements are described and discussed in Chapter 3.
In Chapter 4, I summarize the present study and discuss future perspectives. I also describe preliminary results of the H/D-exchange kinetics of the GroES portion of the SR1/GroES complex in the presence of ADP; SR1 is a single-ring mutant of GroEL.
Thus, the study in my thesis overall solves the mystery of dynamic fluctuations of the GroES part from the GroES-GroEL chaperonin complex.
37
Chapter 2. The use of spin desalting columns in DMSO-quenched
H/D-exchange NMR experiments
This chapter is adapted and modified from Mahesh S. Chandak, Takashi Nakamura, Toshio Takenaka, Tapan K. Chaudhuri, Maho Yagi-Utsumi, Jin Chen, Koichi Kato and Kunihiro Kuwajima, The use of spin desalting columns in DMSO-quenched H/D-exchange NMR experiments. Protein Sci. 2013, 22(4):486-91
38
2.1. Introduction
The DMSO-QHX method, first introduced by Zhang et al., [58] is a very versatile method to characterize the H/D-exchange behaviors of proteins and protein assemblies, and the advantage of this method is two-fold. First, DMSO is a strong protein denaturant that can be used as a solubilizer of water-insoluble protein aggregates. Second, the chemical exchange rates of peptide amide protons are substantially reduced in a DMSO solution (most typically 95% DMSO-d6/5% D2O, pH* 5.0), making it possible in principle to observe the H/D-exchange of non-protected fast-exchanging amide protons by 2D NMR spectroscopy; pH* indicates the pH-meter reading. The DMSO-QHX method has thus been used widely for studying the H/D-exchange behaviors of various amyloid fibrils[40, 59-65] and other protein supermolecular assemblies.[66, 67] The method has also been used for studying the H/D-exchange of non-protected fast-exchanging amide protons in the intermediate and the unfolded states of proteins.[58, 68-70]
In the DMSO-QHX experiments, the H/D-exchange reactions are first carried out in a D2O buffer solution under a condition used to investigate the exchange behavior of a protein. After a pre-determined exchange time, the exchange reaction is quenched in liquid nitrogen, and the medium is changed from D2O to the DMSO solution, in which amyloid fibrils or other insoluble protein aggregates are dissolved into monomers. When protein is 15N-labeled, we can use 2D
1H–15N HSQC spectra to monitor the individual amide-proton signals of the protein with different exchange times, because further exchange is effectively quenched in the DMSO solution.
However, in all of the previous DMSO-QHX studies of proteins so far reported, lyophilization was used to remove D2O from the protein solution, and the lyophilized protein was dissolved in the DMSO solution.[40, 58-70] Therefore, the current DMSO-QHX method has not
39
been used for studies on fully unfolded proteins in a concentrated denaturant (6 M GdmCl or 8 M urea) or protein solutions at high salt concentrations because the denaturants or salts remain after lyophilization, although the DMSO-QHX method is potentially useful for investigating non-protected fast-exchanging amide protons in the unfolded state.
In this chapter, I report that the use of spin desalting column is a very effective alternative to lyophilization for the medium exchange from the D2O buffer to the DMSO solution in the DMSO-QHX experiments. I thus, report that the medium exchange by a spin desalting column takes only about 10 min in contrast to an overnight length of time required for lyophilization, and that the use of spin desalting columns has made it possible to monitor the H/D-exchange behavior of a fully unfolded protein in a concentrated denaturant. In this chapter, I report the results of unfolded ubiquitin in 6.0 M GdmCl.
2.2. Results and discussion
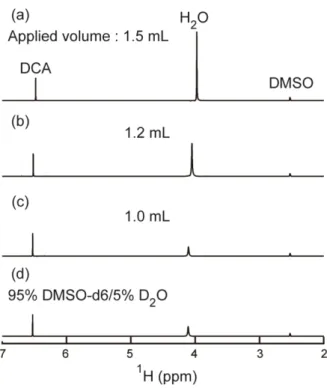
I used ZebaTM Spin Desalting Columns (Thermo Scientific, Rockford, IL, USA) for the medium exchange and 95% DMSO-d6/5% D2O (pH* 5.0) as the DMSO solution to quench the H/D-exchange. When I used the spin desalting column for the medium exchange, the column was first filled with the DMSO solution, and an appropriate volume of a sample protein solution in the D2O buffer was applied to the column. To investigate the most appropriate volume of the sample, I applied different volumes of 50 mM phosphate buffer in H2O (pH 7.0) to a column filled with the DMSO solution, and measured 1D 1H-NMR spectra of the eluates. For a 5-mL spin desalting column, the manufacturer's recommended applied volume is 0.5–2.0 mL.
40
Figure 2-1. The 1D 1H-NMR spectra of the elutes from the DMSO solution-filled spin columns when different volumes of 50 mM phosphate buffer in H2O (pH 7.0) were applied to the column. The applied volumes were (a) 1.5 mL, (b) 1.2 mL, and (c) 1.0 mL. The 1D 1H-NMR spectrum of the DMSO solution (95% DMSO-d6/5% D2O, pH 5.0) is also shown in (d). NMR peaks for H2O, DCA, and DMSO are shown in the figure.
As shown in Figure 2-1, however, I observed a significant water contamination when I applied more than 1.0 mL of solution, and hence I determined the best application volume to be 1.0 mL. For a 2-mL spin desalting column, the best application volume was found to be 0.35 mL.
I used 15N-labeled ubiquitin as a model protein to examine the application of spin desalting columns in the DMSO-QHX 2D NMR (1H–15N HSQC) studies; the ubiquitin used in the present study contained an extra 34 residues at the N-terminus (see Materials and Methods) as compared to wild type ubiqutin. The H/D-exchange reaction of unfolded ubiquitin was started by 10-fold
41
dilution of 3 mM 15N-labeled ubiquitin unfolded in 6.0 M GdmCl (H2O) at pH 2.6 into 6.0 M deuterated GdmCl in D2O at pH* 2.6 and 20.0°C. At each pre-determined exchange time, 1.0 mL of the reaction mixture pre-dispensed in a microtube was taken, the reaction was quenched in liquid nitrogen, and the frozen mixture was kept in a freezer at −85°C until the medium exchange and the subsequent NMR measurement. For the NMR measurement, the frozen sample was thawed at room temperature, the medium containing 6.0 M GdmCl was exchanged for the DMSO solution by using a spin desalting column, and the 1H–15N HSQC spectrum of the protein was measured. The medium exchange by the spin desalting column took only about 10 minutes, which is thus a big advantage over the overnight lyophilization that has been used in the conventional DMSO-QHX method.
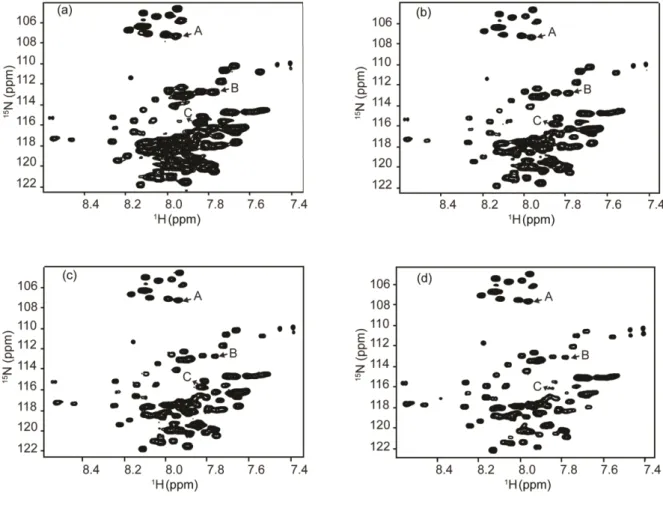
Figure 2-2 shows the HSQC spectra of ubiquitin obtained using different exchange times of 0, 10, and 60 min (panels (a), (b), and (c)), and the spectrum after complete H/D-exchange by heating at 55°C for 30 min ((d)); the exchange times shown are the exchange times under the H/D-exchange condition, not including the time required for the medium exchange, and the heating was done in 6.0 M GdmCl at pH* 2.6 (90% D2O/10% H2O).
The amide proton signals were well resolved, and the quality of the spectra was identical to that of the spectrum of the sample solution obtained by direct dissolution of lyophilized ubiquitin in the DMSO solution. In recent DMSO-QHX NMR studies, pure DMSO-d6 (or 99% DMSO- d6/1% trifluoroacetic acid) was used as a quenching medium instead of the DMSO solution (95% DMSO-d6/5% D2O, pH* 5.0).[61, 66, 67] The spin desalting column could also be used for the medium exchange for pure DMSO, and hence I prepared the ubiquitin sample in pure DMSO-d6 and measured its HSQC spectrum (data not shown). However, the spectrum was collapsed, and its quality was worse than the spectral quality in the DMSO solution in the case of ubiquitin.

![Figure 1-7. In a two-dimensional [ 15 N, 1 H]-correlation experiment, one first creates proton magnetization](https://thumb-ap.123doks.com/thumbv2/123deta/6165642.104814/32.892.174.749.167.457/figure-dimensional-n-correlation-experiment-creates-proton-magnetization.webp)