The Conduction Mechanism of Aquaporin
Channels Studied by the Statistical
Mechanics of Liquids
Saree Phongphanphanee
Department of Functional Molecular Science
School of Physical Sciences
The Graduate University for Advanced Studies
2008
Acknowledgments
My profound gratitude goes to Professor Fumio Hirata, my advisor, and Assistant Professor Norio Yoshida, who both contributed significantly to the work described in this thesis. Foremost, I would like to thank my advisors Prof. Fumio Hirata for providing me with the opportunity to complete my PhD thesis at the Graduate University for Advance Studies (Sokendai), and his supports and guidance made my thesis work possible. He has always been available to advise me. I am very grateful for his patience, motivation, enthusiasm, and immense knowledge in 3D-RISM theory. My very special thanks go to Yumi Yamazaki who keeps helping me in details of my life in Japan. Throughout this research, a number of people have contributed key ideas and criticisms. I would like to thank all members in Professor Hirata’s group for all of those supports. I am deeply grateful to Aizawa Foundation for the financial support that they gave me in my second and third year of PhD course.
Contents
1 Introductoin 1
2 Statistical mechanical integral equation theory 13
3 Gating mechanism of AQPs 21
4 Proton transport in AQPs 31
5 Ions transport in AQPs 41
6 Carbon dioxide and ammonia transport in AQP1 47
7 Conclusions 57
1. Introduction
The transportation of water across cell membrane is fundamental process to maintain life. It is known for a long time that water passes in and out of a cell by osmotic pressure. A cell shrinks or swells when it is in hypertonic or hypotonic solution, respectively. The early explanation to the phenomena was that water simply diffuses across the cell membrane. But the controversy was evoked when the phospholipid-bilayer structure of cell membrane was found, and the higher fluxes of water across the membrane than that estimated from simple diffusion mechanism were detected. The result was suggesting the existence of another mechanism of water permeation through the membrane. Agre and coworkers have shown that a protein in red blood cell functions as a channel for water. [1] The protein was named as “aquaporin1 (AQP1).” By the discovery of water channel, Agre was awarded the Nobel Prize in chemistry in 2003.
The AQPs are not only permeable to water, but also have high selectivity to water, while a proton is repelled from the channel. AQPs function not only as a water channel, but also several members in the aquaporin family are also permeable by glycerol, urea, ammonia and other molecules. [2] From these properties, AQPs are classified into two subfamilies, those which are permeable by only water and the others which are permeable by water, urea and glycerol. The former is simply called “aquaporin,” and the latter
"aquaglyceroporin".
a) b)
Figure 1.1 a) Structure of monomer of AQP and b) channel structure at NPA and Ar/R regions of AQP1
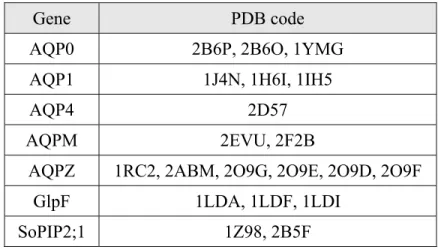
The molecular weight of AQPs is about 30 kDa. They are homotetramers each comprising four subunits of water channels. The subunit consists of six α-helix transmembrane domains. Two of NPA (asparagine-proline-alanine) motifs are conserved at the center of channel and the arginine is conserved at the narrowest region of the channel, which is sometimes called selective filter (SF) or aromatic arginine (Ar/R), [3] as shown in Figure 1.1. Until now the structures of seven AQPs have been resolved by experiments, as shown in Table 1.1.
Table 1.1 AQPs with known atomic structures and their codes in PDB.
Gene PDB code
AQP0 2B6P, 2B6O, 1YMG
AQP1 1J4N, 1H6I, 1IH5
AQP4 2D57
AQPM 2EVU, 2F2B
AQPZ 1RC2, 2ABM, 2O9G, 2O9E, 2O9D, 2O9F
GlpF 1LDA, 1LDF, 1LDI
SoPIP2;1 1Z98, 2B5F
After the discovery of water channel, the studies of AQPs have been widely spread to many areas of research fields. The main interests of the researches could be grouped as:
1) The new member of AQPs
After the first discovery of AQP, at least 13 aquaporins (AQPs) have been found in human recently, and much more in plants. Totally, several hundreds homologous genes of AQPs have been found. The evolutionary relationships of some AQP genes are shown as a phylogenetic tree in Figure 1.2. Until present, a number of AQPs are still gradually increased. [4]
2) The channel functions
It is becoming more and more clear that AQPs promote the transport of many small molecules such as urea, CO2, NH3, H2O2, NO, CO2, Sb(OH)3, As(OH)3, B(OH)3, Si(OH)3, Cl-, and NO3-. [5] Electrophysiological and optical techniques are extensively used to study the properties and the transport mechanisms of AQPs which were expressed as both wild type and mutant on artificial membranes and several cell types. Some small
molecules have been proposed or detected to pass through the water channel of each subunit, whereas others have been hypothesized to permeate through the central channel of the tetrameric structure.
Figure 1.2 Phylogenetic tree of human (Hs), plant (Ath) and bacteria (AQP and GlpF) (Kruse et al., 2006) [4]
3) Other functions than membrane permeation
Recently, the new functional roles of AQPs have been explored such as membrane-membrane adhesion, cell migration and cell proliferation. These functions are more complicated than the channel function because they are not only concerned with
AQPs. For example, ion channels, AQPs and actin polymerization/depolymerization are necessary to work together in the cell migration process. [6]
4) Regulation mechanisms
Activities of AQPs can be changed in various conditions depending on protein phosphorylation, pH, concentration of divalent cation (Ca2+) and protein-protein interaction. However, it is still not clear about the mechanisms of these changes in the molecular level. [7]
5) Roles of AQPs in pathological conditions and diseases.
AQPs exhibit the fundamental function for maintaining life and widely distribute in many organs (Table 1.2). Therefore, the dysfunctions of AQPs can cause the various types of symptoms and diseases such as dry skin, dry eye, dry mouth, obesity, sensation disturbances, brain edema, epilepsy and kidney cyst formation. [2]
The theoretical studies in the molecular level of AQPs are focused on only channel functions. The molecular dynamics simulation is the most popular method to study the water channel. During the last decade, a lot of simulation works has been performed to investigate the functions of AQPs. Many of them have studied the proton exclusion, while a less number of works have examined glycerol, ions and gases transportations, and evaluated the water permeability. The main emphasizing of molecular simulation studies of function of AQPs is the free energy profile or potential of means force (PMF) of a molecule inside the channel. The height of barriers in the PMF of a molecule is used to clarify weather the molecule can permeate through the channel or not. In the case of proton exclusion in AQPs, the cause of the prevention can also be analyzed by comparing PMF between wild type and mutant. However, the PMF of water
Table 1.2 Functional classification and distribution of AQPs in life organism. Gene AQP/GLP Functional Permeability Cellular localization Aquaporin in human
AQP0 AQP Water Lens of the eye
AQP1 AQP Water (NH3, CO2, NO?) Kidney, ethrocyte, lung brain, eye and vascular endothelium
AQP2 AQP Water Kidney
AQP3 GLP Urea and glycerol; water Skin, kidney, lung, eye and gastrointestinal tract
AQP4 AQP Water Kidney, brain, lung,
gastrointestinal tract and muscle AQP6 AQP Anion (NO3- and Cl-); water Kidney
AQP7 GLP Urea and glycerol; water, arsenite
Adipose tissue, kidney and testis AQP8 AQP Urea and NH3; water Kidney, liver, pancreas,
gastrointestinal tract and testis AQP9 GLP Urea and glycerol; water,
arsenite
Liver, leukocytes, brain and testis
AQP10 AQP Water Gastrointestinal tract
Aquaporin in bacteria
AQPZ AQP Water E.coli
GlpF GLP Urea and glycerol; water E.coli AQP-aquaporin GLP-aquaglyceroporin
in the AQPs obtained from the simulations is in contradictory with the experimental results. The works of de Groot and Grubmüller show the positive of PMF of water throughout the channel of AQP1 and GlpF; the maximum is approximately 6 kJ/mol. [8] Likewise, PMF of water in AQP1 from Ko et al. shows also the similar tendency. [9] In contrast, Hub and de Groot reported the higher maximum of PMF, 14 and 13.5 kJ/mol in
AQP1 and GlpF, respectively. [10] The positive PMFs of water in the channel obtained from simulations is inconsistent with the experimental results. The X-ray crystallography can detect the oxygen of water inside the channel. [11-15] It means that water can stay for some elongated time inside the channel, and it is more stable than that in the bulk. The observation clearly indicates that the PMF of water should be negative in the channel. One of the most important problems concerning AQPs, which has been focused by many experimentalists, is the mechanisms of selectivity and control of the AQPs. For example, AQP6 can conduct anion, Cl- and NO3-, while others AQPs are not permeable by those anions. Some AQPs have selectivity to some specific molecules: in case of arsenite, only some plant AQPs and human AQP7 and AQP9 can permeate the molecules. Arsenic, an acute toxic substance and potent carcinogen, is widespread in the earth crust and easily taken up and accumulated in crops. Arsenic poisoning from accumulation in rice has a potential to become the new disaster for the people in Southeast Asia.[16] The mechanism of arsenic accumulation in rice, which is resulted from its transportation into rice roots through AQPs, is therefore crucial for protection of arsenic poisoning. Recently, the transport of arsenite in rice by NIP subfamily of AQPs has been determined in order to enhance food safety. [17] Furthermore, the selectivity of AQPs is a basis knowledge that can be applied in many research fields such as plant cultivation and drug discovery.
The main aim of this thesis is to contribute to clarify the mechanism underlying the selectivity and the role of gating of AQPs by means of the statistical mechanics of liquids, or the RISM/3DRISM theory. Unfortunately, the available atomic structures that are crucial for the method of 3D-RISM have limited to seven AQPs (Table 1.1). Therefore, I should have limited the scope of my thesis in the AQPs of which structures
are known. Among the available structures of AQPs, only AQPZ (2ABM) has the open and closed states of channel in the same tetramer. Therefore, I use this aquaporin to explore the gating mechanism. As I have mentioned before, the selectivity of AQPs are crucial for their functions. I have intensively studied the selectivity of AQPs within the limitation of the structural data. My studies are devoted to three topics:
1) Proton exclusion in AQPs.
This is the most fundamental topic to understand the selectivity of water by aquaporin. Although many authors have investigated previously the selectivity of water by means of molecular simulations, the problem -what really prevents proton from transportation?- is still controversial.
2) Ions exclusion in AQPs.
Ions play important roles within our body; they are mainly involved in regulating fluid balance, participate in acid-base homeostasis, contribute to enzyme reactions, and play a crucial role in excitable tissue such as neuromuscular activity. Many of AQPs are reported to be impermeable to ions, both cation and anion. From its structure, AQP channel has the positive environment. Therefore it is readily presumed that cations are excluded from the channel due to the positive electrostatic potential. However, this hypothesis can not explain why the AQPs are impermeable to anion.
3) Permeation of small molecules other than water through AQP1.
An assumption widely accepted in biology is that all gases rapidly penetrate across the cell membrane by simply dissolving in the membrane lipid. This dogma has been challenged by the finding that the expression of AQP1 can increase the flux of some gases, CO2 and NH3. Both gases play an important role to our body: CO2 transport is
crucial for cellular respiration and acid-base homeostasis; NH3/NH4+ transport also affect to the acid-base balance. However, the findings are still controversial, because some works have reported the negative results that AQP1 is impermeable to CO2 and NH3. (see details in Chapter 6)
In order to clarify the mechanism of selectivity and gating of AQPs the 3D-RISM theory has been used in this study. The RISM and 3D-RISM theories are the statistical mechanical integral equation theories of molecular liquids which have been developed by Hirata’s group. [18] The theories enable one to calculate the three dimensional distribution of water as well as other solute molecules around and inside a protein in solution. The distribution functions determined by the theory have the same physical meaning with those obtained from the diffraction measurement such as the X-ray and neutron crystallography, but have some advantages over the experiments. For example, the theory can resolve the position of hydrogen-atom of water inside the channels quite easily, while it is very difficult for the experiments: the scattering power of X-ray by hydrogen atoms is virtually zero, while the resolution of the current neutron-diffraction is too low. The situation of the experiment is even worse for ions as well as polar and non- polar solutes, because they are usually minor components in the channel, thereby the signal from those solutes can be hided in the noise. Therefore, the information from the theory is impeccable to understand the molecular mechanism of aquaporin channels. Recently, the 3D-RISM is success to apply with the complex biological system; such as recognition of water and ion by lysozyme protein. The theoretical works show the good agreement with experimental results.[19,20]
The organization of this thesis is as follows. The material contained chapter 2 is the detail of the 3D-RISM theory. The next four chapters are devoted to clarify the mechanism of gating and selectivity of AQPs. The chapter 3 that concern the gating mechanism of AQPZ supports the role of conformation change of R189 side chain. The mechanism of proton exclusion in AQP1 and GlpF are explained in chapter 4. The transportation ions and other solute molecules, CO2 and NH3, are described in chapter 5 and 6, respectively. Concluding remarks are given in chapter 7.
References
[1] G. M. Preston, T. P. Carroll, W. B. Guggino, and P.Agre, Science 256 (1992), 385. [2] P. Agre, Angew. Chem. Int. Ed. 43 (2004), 4278.
[3] Y. Fujiyoshi, K. Mitsuoka, B. L. de Groot, A. Philippsen, H. Grumüller, P. Agre, and A. Engel, Curr. Opin. Struct. Biol. 12 (2002), 509.
[4] E. Kruse, N. Uehlien and R. Kaldenhoff, Genome Biol. 7 (2006), 206. [5] B. Wu and E. Beitz, Cell. Mol. Life Sci. 64 (2007), 2413.
[6] A.S. Verkman, J. Cell. Sci. 118 (2005), 3225.
[7] F. Chaumont, M. Moshelion and M. J. Daniels, Bio. Cell 97 (2005), 749. [8] B. L. de Groot, and H. Grubmüller, Science 294 (2001), 2353.
[9] Y. J. Ko, J. Huh, and W. H. Jo, Protein 70 (2008), 1442. [10] J. S. Hub, and B. L. de Groot, PNAS 105 (2008), 1198.
[11] H. Sui, B. Han, J. K. Lee, P. Wallan and B. K. Jap, Nature 414 (2001), 872. [12] J. Jiang, B. V. Daniels and D. Fu, J. Biol. Chem. 28 (2006), 454.
[13] T. Walz, T. Hirai, K. Murata, J. B. Heymann, K. Mitsuoka, Y. Fujiyoshi, P. Agre and A. Engel, Nature 387 (1997), 624.
[14] E. Maruta, K. Mitsuoka, T. Hirai, T. Walz, P. Agre, J. B. Heymann, A. Engel, and Y. Fujiyoshi, Nature 407 (2000), 599.
[15] E. Tajkhorshid, P. Nollert, M. Ø. Jensen, L. J. W. Miercke, J. O’Connell, R. M. Stroud and K. Schulten, Science 296 (2002), 525.
[16] A. A. Meharg, Trends Plants Sci. 9 (2004), 415.
[17] J. F. Ma, N. Yamaji, N. Mitani, X. Xu, Y. Su, S. P. McGrath, and F. Zhao, PNAS 22 (2008), 9931.
[18] A. Kovalenko, F. Hirata (Eds.), Molecular Theory of Solvation. Kluwer Dordrecht, 2003, 169.
[19] N. Yoshida, S. Phongphanphanee, Y. Maruyama, T. Imai and F. Hirata, J. Am. Chem. Soc., communication 128 (2006), 12042
[20] N. Yoshida, S. Phongphanphanee and F. Hirata, J. Phys. Chem. B 111 (2007), 4588
2. Statistical mechanical
integral equation theory
In 1972 Chandler and Andersen proposed the theory of molecular liquids called reference interaction site model (RISM), [1] which is the extended Ornstein-Zernike (OZ) equation to examine the molecular liquid problems. This theory can be used to calculate the radial site-site correlation functions. In Contrast to the RISM (1D-RISM) theory, the three dimensional RISM (3D-RISM) theory takes orientational average of the OZ equation for solvent molecule only, keeping full description of the orientation of the solute molecule. [2] The theory has been successful to study the complex biomolecules, such as protein and DNA. In this chapter, we will outline the method of 3D-RISM from the fundamental concept of the OZ equation.
Ornstein and Zernike proposed that the correlation between a pair of molecules comprises two parts, direct and indirect part, which is called the Ornstein-Zernike (OZ) equation. [3] This equation is written as
( ) ( )
12 =c12 +∫
c( ) ( ) ( )
13h 32d 3h ρ , (2.1)
where h and c denote the total and direct correlation function, respectively. This relation shows that the total correlation, h, is contributed by the direct correlation between molecule 1 and 2, and the indirect correlation resulting from the influence of the third
molecule, 3, and averaged over all positions of molecule 3 that directly correlates with molecule 1. Equation (2.1) is just the way to define the direct correlation function; therefore equation (2.1) itself cannot completely solve the problem. Then, another approximation, closure relation such as HNC, PY, MSA and KH, is needed.
In the interaction site model, the interaction potential between molecule 1 and 2 can be written in the summation of terms of site-site potential,
∑ ( )
=
ab
ab ab r
u
u(1,2) (2.2)
where indices a and b indicate site a and site b on molecule1 and 2, respectively.
1 2
Figure 2.1 The interaction site model.
When applying the interaction site model, the system can be described by the site-site correlation function. The site-site total correlation functions are given by averaging the function over fixing distance between the interaction sites:
( )
r = Ω12∫
d( ) ( )
1d 2(
1+ 1) (
2 + 2 −)
h(
1,2hab δ R la δ R lb r
)
(2.3)where and are the position of molecule 1 in the laboratory frame and position of site a of molecule 1 in the molecular frame, respectively. The crucial approximation of
R1 l1a
RISM theory is the assumption that molecular direct correlation function, , is the summation of site-site direct correlation function,
(
1,2c
)
( )
abab r
c , [1]
( )
=∑ ( )
ab ab ab r
c
c 21, . (2.4)
The RISM equation is derived from equation (2.2b), (2.3) and (2.4). We obtain the equation
∑
∑
∗ ∗ + ∗ ∗=
d c
db cd ac d
c
db cd ac
ab c c h
h
, ,
ϖ ρ ϖ
ϖ , (2.5)
where asterisk denotes the convolution integrals and ϖabin the equation (2.5) is the intramolecular correlation function. This function is defined as
( ) ( ) ( ) (
ab abab ab ab
ab r L
r L
r = + − δ −
)
πδ δ
δ
ϖ 2
4
1 , (2.6)
where is the bond length between the site a and b of the same molecule. As mentioned above, the RISM equation should be complement by another equation that is closure equation. In this work, we choose KH closure, [2] because it dramatically improves numerical convergence. The KH closure is written as
Lab
( ) ( ( ) ( ) ) ( ) ( )
⎩⎨
⎧ + >
= ≤
0 for
1
0 for
exp
r d r
d
r d r
r d g
ab ab
ab ab
ab (2.7a)
( )
r u( )
r h( )
r c( )
rdab =−β ab + ab − ab (2.7b)
where gabis the site-site radial distribution function, which is define as,
−1
= ab
ab h
g . (2.8)
In order to consider the solvation problem at infinite dilutions, the RISM equation can be reduced into two sets of equations, solute-solvent part and solvent-solvent part. These two sets of equations can be written as follow:
∑ ∑
∑
′∈∈ ′′
′
′′
′′
′
∈ ∗ ∗ + ∗ ∗
=
species
Solvent , on Site, ,
on Site ,
s
s d c
s s db s cd ac s
s d
c
s db s cd ac s
ab c c h
h
α
α α α
α α
α ϖ ϖ ρ ϖ (2.9a)
∑ ∑
∑
′∈∈ ′
′′
′
′
′
∈ ′′
′′
′′
′′ = ∗ ∗ + ∗ ∗
species
Solvent
, on
Site , ,
on Site ,
s
s s d c
s s db s s cd s ac s
s s d c
s db s s cd s ac s
s
ab c c h
h ϖ ϖ ρ ϖ (2.9b)
where the superscript α denotes the solute specie, superscript s and denote the solvent species, and is site-site total correlation function between site a of solute
s′′
s
habα α
and site b of solvent s. Equation (2.9a) and (2.9b) are the RISM equation for solute- solvent and solvent-solvent system, respectively.
To examine the 3D-correlation function of solvent molecules, the 3D-RISM is applied to the solute-solvent system. The 3D-RISM averages out only the solvent molecular orientations, so it keeps the orientational description of the solute molecule. By contrast, the RISM theory average out the solute and solvent molecular orientation. The 3D-total correlation function of solvent interaction site a is define as [2]
( )
1a = Ω1∫
Ω2 s(
1a− 2aΩ1Ω2s
a d h
h r r r
)
(2.10)where and denote the molecular orientation coordinate of molecule 1 and 2, respectively, is the intermolecular vector form the solute molecule origin 1 to solvent site a, and is the intramolecular vector in a solvent molecule from its origin 2 to site a with solvent molecule orientation
Ω1 Ω2
1
1 r r
ra = a −
2
2 r r
ra = a −
Ω2 to be averaged over. In the 3D-
RISM, the direct correlation is approximated by the summation of the 3D-direct correlation function of site a of solvent molecule 2, [2]
( )
=∑ ( )
a a s a
s c
c 1,2 r1 (2.11)
The 3D-RISM equation is derived from applying the definition of 3D-total correlation function, equation (2.10), and the equation (2,11) in the molecular OZ equation; it can be written as
( ) ∑ ∑ ( ) ( )
′∈ ∈ ′
′
′
′∗ +
=
species
Solvent on Site
s c s
s s ca s s ca s c s
a c h
h r ϖ ρ r . (2.12)
Similar to RISM, we adopt the 3D KH-closure to complete the 3D-RISM equation. The 3D-KH closure equation can be written as, [2]
( ) ( ) ( ) ( ) ( ) ( )
⎩⎨
⎧
> +
= ≤
0 for
1
0 for
exp
r r
r
r r s
a s
a
s a s
s a
a d d
d
g d , (2.13a)
( )
r as( ) ( ) ( )
r as r as rs
a u h c
d =−β + − , (2.13b)
where , similar define as (2.8), and are three dimensional distribution function and interaction potential between the solute molecule and the site s of solution species. In this work, the interaction potential is described as the sum of the electrostatic interaction and the Lennard-Jones potential,
s
ga uas
( ) ∑ ∑
∈
∈ ⎪⎭
⎪⎬
⎫
⎪⎩
⎪⎨
⎧
⎟⎟
⎠
⎞
⎜⎜
⎝
⎛
− −
⎟⎟
⎠
⎞
⎜⎜
⎝
⎛ + −
= −
solute
b bu
ab u
b ab ab
solute
b bu
s a u s b
a
q u q
6 12
4 r
r r r
r r
r
σ
ε σ , (2.14)
where denotes the partial charge on site a, and σ and ε are the Lennard-Jones parameters with usual meaning. is the position of the solute site b. To obtaining the distribution function of solvent around and inside the solute molecule, we begin with the calculation of the site-site pair correlation functions of solvent-solvent system by solving the RISM equation. These correlation functions between the solvent species are used for solving the 3D-RISM equation to obtain the three dimensional distribution functions.
qa
u
rb
In order to examine the solution around and inside AQPs channel, we consider AQPs as a solute, and a solution around AQPs as a solvent. There are two steps to solve the 3D-RISM; first, calculation of the site-site correlation function of solvent-solvent system by using RISM theory and second, application of the results from RISM to solve the 3D-RISM equation. Then, the 3D distribution function of solvent (water or electrolyte solution) around the solute (AQPs) is calculated.
The densities profile, 1D distribution function along the channel axis in a monomer which is the same direction as the four-fold symmetry axis of X-ray structure, are calculated by integrating of g(r) over the area of normalization that is defined by the area inside the channel perpendicular to the axis (z axis) and g>10-4,
( )
( )( )
( )
∫
∫
−
−
>
= >
4 4
10 area
10 area
r g r g
dxdy dxdy g
z g
r
. (2.14)
The PMF along the channel axis is given by
( )
z kT g( )
zU =− ln , (2.15) where k and T are Boltzmann factor and temperature, respectively.
To examine how the solvent distribute of a distance from a fixed point, we have to calculate the radial distribution function (RDF). The RDFs can be obtained by averaging the 3D-distribution function over the direction around a specified center:
( )
,r0 = 41∫ (
r0+r)
rˆD
1 r g d
ga a
π , (2.16)
where r is a direction of vector r , and ˆ r0 indicates a center for the averaging.
References
[1] D. Chandler, and H. C. Andersen, J. Chem. Phys. 57 (1972), 1930.
[2] A. Kovalenko, F. Hirata (Eds.), Molecular Theory of Solvation. Kluwer Dordrecht, 2003, 169.
[3] J. P. Hansen and I. R. McDonald, Theory of Simple Liquids. Academic Press, 1986.
3. Gating mechanism of AQPs
Related article:
S. Phongphanphanee, N Yoshida, and F. Hirata
“The statistical-mechanics study for the distribution of water molecules in aquaporin”
Chemical Physical Letter 449 (2007), 196-201.
The water permeability of AQPs is regulated by various mechanisms, which are distinct in each member [1-4]. Recently, the tetrameric structure of AQPZ was revealed the open and close state in the same tetramer. [5] Then I used this structure to clarify the mechanism of gating of AQPs. The current consensus with respect to the mechanism of the channel gating of AQPZ, deduced from the water distribution obtained by the experimental and molecular dynamics (MD) simulation studies, attribute it to the difference in conformations of side chain, R189 [5]. Namely, water distributes continuously throughout the channel with the open structure in which the R189 side chain turns away from the channel pore, while the distribution is interrupted in the closed form in which the side chain turns toward inside pore. It is therefore important to reproduce
such water distribution inside the channel in order for a theory to be applicable to the conduction mechanism.
As described in the chapter 2, the distribution of water around and inside AQPZ has been calculated by applying the 3D-RISM theory. The discussions of these results are divided in three sections below.
3.1. Water distribution in aquaporin
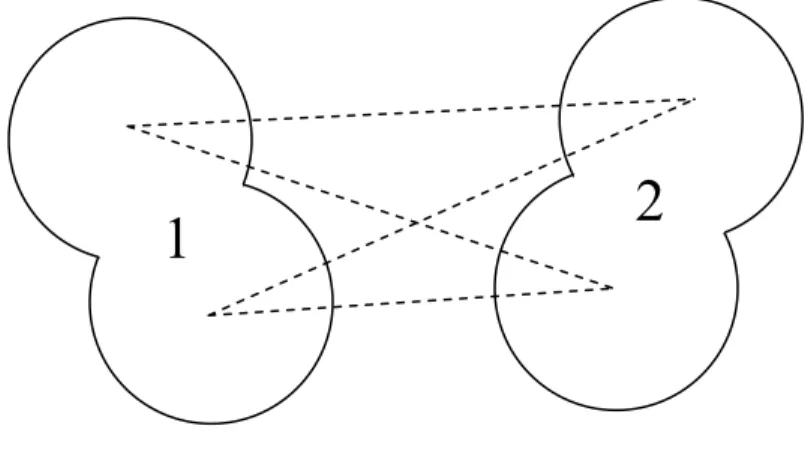
AQPZ is a homotetramer of four water-conducting channels. Each monomer of the channels forms opened and/or closed structure. The four monomers make a pore at the center. In Figure 3.1, the water distribution around the AQPZ tetramer immersed in water solvent at infinite dilution is depicted. The largest water distribution at center, which corresponds to the central pore, is disconnected by a large gap. The gap of water distribution in the central pore indicates that the pore has no permeability for water. The other four distributions of water in the left and right hand sides of the central pore correspond to the water channel of each monomer. Water distributes continuously in the channels except for the second one from the left, in which a gap is seen. The red spheres depicted in the figure are the positions of oxygen atoms of water molecules identified by the X-ray crystallography [5]. My results are consistent with those detected by the experiment except for the water distribution in the places other than the channel area. Our method detected many fragments of water distribution at the places outside the channel in the aquaporin. Such water distributions have never been reported by the molecular simulations. Although there are many peaks indicating water containing cavities, I focus
three conspicuous ones in the monomer A, which apparently exhibit high probability of containing water. In Table 3.1, the positions of the cavities and numbers of water in the cavities are summarized. Although the function of those water molecules is not known at present, I believe they play a role on stability of the protein. Recently Schulten and his coworkers reported that they removed the water buried inside the protein on their simulation, otherwise it will made the protein unstable. [6]
Figure 3.1 The side view of distribution of water molecules around AQPZ tetramer (left) and the section line from top view (right). The arrows indicate the position of large cavities. The region g > 2 is colored blue, while red spheres depict the positions of water determined by X-ray.
Table 3.1 The position of cavities in terms of the surrounding amino-acid residues, and the number of water molecules in the cavities
Cavity Surrounded by Number of
water W1 Ala65, Thr185, Asn63, Pro212, Ser142, Leu146 0.9
W2 Ser177, Gly138, Thr184, Leu141 0.9
W3 Val193, Ala194, Asn119, Ala201, Leu205, Ser190 1.6
3.2. Gating mechanism of AQPZ
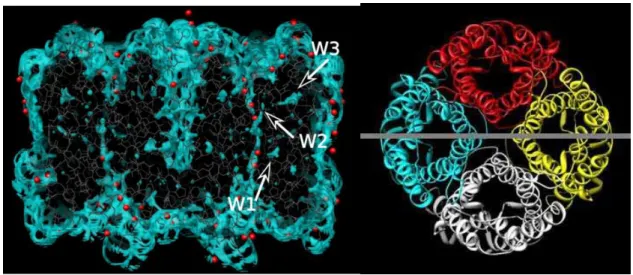
In order to discuss the gating mechanism of the aquaporin, I consider each monomer independently immersed in water solvent at infinite dilution. The distributions of water along the channels of A–D monomers of AQPZ are shown in Figure 3.2 using the iso- surface representation, in which the region with g > 1 is colored blue. As is obvious from the figures, the monomers from B to D have a large gap nearby the R189 residue, while the monomer A has a continuous distribution. The channel surfaces are representing by the dot surface, which is drawn by using the HOLE program [7]. The distributions of water in the other regions of channels are not much different. The main difference in the protein structures between A and the other three monomers is in the orientation of the R189 side chain. In the monomer A, the guanidino group of R189 turns outward from the channel surface, whereas it turns inward into the channel surface in the other monomers. These results suggest us two important points with respect to the mechanism of the water conduction through the aquaporin. Firstly, the structure A is identified as the open structure which allows water transport through the channel, while the structures B, C and D are considered as the closed structures which prohibit water permeation. Secondly, it is the residue R189 that controls the switching of structure from the open to closed forms; the conformational change of R189 regulates the gating of the water channel.
Figure 3.2. The distribution of water molecules in (a) monomer A (open), (b) B (close), (c) C (close) and (d) D (close). The region with g > 1 is colored blue, the dot surfaces are surface of the channel drawn by HOLE [7].
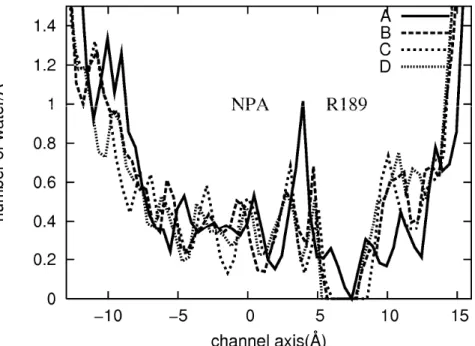
In order to make closer comparison of my results with the experiment, I have calculated a profile of the coordination number of water along the channel axis. The results are depicted in Figure 3.3, where A, B, C and D indicate the A, B, C and D monomers, respectively. The origin of the channel coordinates was set at the mid point in the line between the two NPA motifs, Asn-Pro-Ala sequences conserved in all aquaporin proteins. The experimental result locates oxygen of water in the opened channel right at the restricted region near R189, but my result indicates that the distribution of water in this region is very low. The difference of these results may be due to the dynamical status of water molecules in the channel pore. In the theoretical results, a quite high peak of the water distribution is observed at the position between the NPA motifs and R189 around the restricted region. It is possible that the position where the oxygen atom is located instead of that suggested by the experiment. The closed monomer B, C and D show no water distribution around the R189 as opposed to the open monomer A.
Figure 3.3 The distribution profile of water along the channel axis of each monomer.
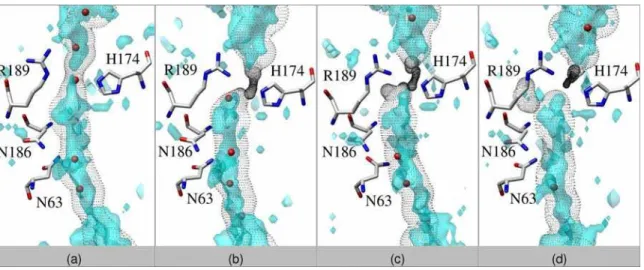
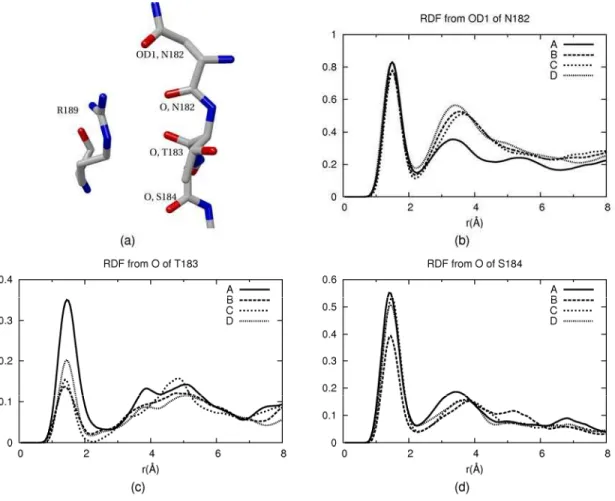
The radial distribution functions (RDFs) of hydrogen of water were shown in Figure 3.4. The highest peaks are assigned to the hydrogen bonds between hydrogen of water and oxygen of those residues. In Figure 3.4b and d, the RDFs of hydrogen of water are not so different between the closed and opened structures, but in the Figure 3.4c, they show significant difference in which the first peak of the closed structure is much lower than that of the opened structure.
Figure 3.4 (a) The configuration of the residue in the restricted region. (b) - (d) The radial distribution functions of hydrogen of water around OD1 of N182, O of T183 and O of S184.
3.3. Orientation of water molecules in the AQPZ
channel
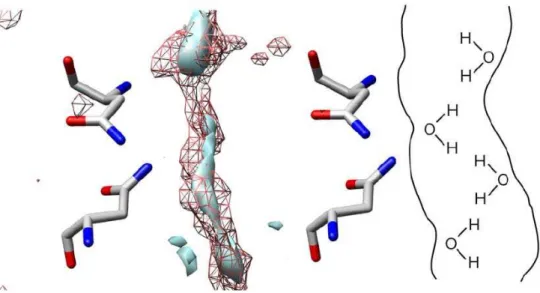
The orientation of water molecules in the channel may have significant effect on the dynamics of conducting species, especially on that of proton. Depicted in Figure 3.5 are the distributions of oxygen and hydrogen of solvent water at the NPA region of the monomer A. The picture implies that the distribution is largely distorted from what might be seen in the ice-like hydrogen-bond network in bulk water: namely, oxygen atoms are
distributed near the channel residues, while hydrogen atoms are distributed around the center of the channel. The distributions of oxygen and hydrogen of water are consistent with the average configuration of water, in which the dipole moments are pointing toward the central axis of the channel (see schematic illustration in Figure 3.5).
Figure 3.5 The distribution of oxygen (mesh surface) and hydrogen(solid surface) of solvent water in the channel of monomer A of AQPZ. The right-hand side of the figure illustrates the orientation of water molecules in the channel schematically.
Computational detail
Table 3.2 Potential and structural parameters of water. [8]
σ (Ǻ) ε (kcal/mol) q (e)
H (water) 0.400 0.0460 0.410
O (water) 3.166 0.1550 -0.820
O-H (water) (Ǻ) 1.000
∠HOH (water) (deg) 109.5
In Table 3.2, the potential parameters and structure codes used in the calculations are summarized. The dielectric constant, temperature and density of solvent are chosen as 79.8, 298 K and 0.9997 g/cm3, respectively. In the calculation, the Amber-99 parameter set was employed as potential parameters for the aquaporin [9] and the structure of AQPZ is taken from the entries 2ABM in the Brookhaven Protein Data Bank [5]. The 3D distribution functions were calculated on a grid of 2563 points in a cubic supercell of 128 Å3
References
[1] I. Johansson, M. Karlsson, V. K. Shukla, M. J. Chrispeels, C. Larsson, and P. Kjellbom, Plant Cell 10 (1998), 451-459.
[2] K. L. Nemeth-Cahalan, K. Kalman, and J. E. Hall, J. Gen. Physiol. 123 (2004), 573-580.
[3] M. Zelenina, A. A. Bondar, S. Zelenin, and A. Aperia, J. Biol. Chem. 278 (2003), 30037.
[4] E. Gunnarson, G. Axehult, G. Baturina, S. Zelenin M. Zelenina, and A. Aperia, Neuroscience 136 (2005), 105.
[5] J. Jiang, B. V. Daniels, and D. Fu, J. Biol. Chem. 281 (2006), 454. [6] F. Zhu, E. Tajkhorshid, and K. Schulten, Biophys. J. 86 (2004) 50.
[7] O. S. Smart, J. M. Goodfellow, and B. A. Wallace, Biophys. J. 65 (1993), 2455. [8] H. J. Brandsen, J. P. M. Postma, E. F. van Gunstern, J. Hermans, in: B. Pullman
(Eds.), Intermolecular Force, Reidel, Dordrecht, 1981.
[9] J. Wang, P. Cieplak, and P. A. Kollman, J. Comput. Chem. 21 (2000), 1049.
4. Proton transport in AQPs
Related article:
S. Phongphanphanee, N. Yoshida, and F. Hirata
“On the proton exclusion of aquaporins: a statistical mechanism study.”
Journal of the American Chemical Society 130 (2008), 1540-1541.
The proton exclusion from aquaporins (AQPs) is one of the most important questions to be solved in the fields of biochemistry, medicine, and pharmacology. Although the channels are extremely permeable for water, approximately a billion molecules per second pass through the channel, protons are strictly excluded from the permeation. [1-4] In many previous works of molecular dynamics simulation of proton exclusion, AQP1 and GlpF have been used to study this problem. [5-15] There are essentially two mechanisms conceivable for the proton transfer in the channel. One is the proton jump mechanism similar to that in bulk ice or water, in which a proton transfers from one minimum to the other in the double well potential of a hydrogen bond between two water molecules by tunneling through the barrier, which is called the Grotthuss mechanism. [16] The process requires the two water molecules to be in the right mutual orientation to form the double well potential. If water molecules are prevented from the reorientational
dynamics by any reason, a proton may not transport through the channel. [6-9] The other mechanism of the proton transport is due to the translational motion of water molecules; that is, a proton may move in the channel by “riding” on a water molecule or making a hydronium ion. The mechanism is similar to the usual ion transport in the channel. Therefore, any mechanism that prevents the ion from the translational motion through the channel can be the cause of the proton insulation: steric hindrance, electrostatic barrier, and so on. [9-15] The unspecific desolvation effects proposed by Warshel is nothing but the electrostatic barrier enhanced by decreased water population or screening. [10,11] The mechanism should be readily examined if one can calculate the distribution of the hydronium ion in the channel. The information of the hydronium ion distribution in the channel may also be useful for examining the possibility of the proton-jump mechanism, because a proton should be existing most likely in the form of the hydronium ion except for the moment of barrier crossing.
In the previous simulation works, AQP1 and GlpF were used as typical of two subfamilies of AQPs to study the mechanism proton exclusion in the channel. Then I also choose these two proteins for elucidating the preventing proton from the water channels by applying the 3D-RISM theory. In Figure 4.1, the contour map of the electrostatic potential due to the channel atoms, the 3D-distribution of water and of hydronium ions, and the one-dimensional profile of the distribution of the solution components are depicted along the channel axis. As can be readily seen from the figure, water in the both channels is continuously distributed through out the channel. However, the distribution of hydronium ions is intermitted by gaps both for AQP1 and GlpF, although there is some difference in the distribution between the two channels: in AQP1, the hydronium ion is
Figure 4.1 The distribution functions of water and hydronium ion in aquaporin channels. The distribution of water (blue transparent surface), g>1, and those of hydronium ion (brown surface), g>1 and distribution profiles, in AQP1 and GlpF channel, are shown in upper and lower panels, respectively. The contour colors show the electrostatic potential of protein in esu unit.
excluded from large area extending from R197 (or Ar/R) to NPA, while the gap in GlpF is limited in a small area around R206 (Ar/R). Note that “gap” does not mean “nothing is there,” since water molecules are distributed continuously through out the channel. It is also understood from the figure that the distribution of hydronium ions is essentially determined by the electrostatic potential inside the channel: hydronium ions are excluded primarily from the channel by the positive electrostatic atmosphere. The difference in the electrostatic potential between AQP1 and GlpF originates apparently from the additional
positive field produced by the residue H182 in AQP1. From those results, we can draw an important conclusion with respect to the mechanism of proton exclusion in AQP1. It is needless to mention about the proton jump mechanism, as the proton is a positive charge cannot pass through the large electrostatic barrier inside the channel. On the other hand, the gap of the distribution is small in GlpF, which leaves a slight possibility for the proton to transfer through the proton jump mechanism. Remember water is distributed continuously even in the area where the hydronium ion is excluded. If the water molecules and hydronium ions around that area have some freedom to rotate to arrange themselves to make the double well potential for the proton, then the proton may jump through the potential barrier via tunneling. The distribution of oxygen and hydrogen of water around the area does not indicate the particular coordination that prevents the molecule from the reorientation. Can a proton, then, permeate all the way through the channel via the proton-jump mechanism? In order to answer the question, we have examined the water distribution around the NPA region of GlpF, where the mechanism is suspected to be broken because of the formation of so-called “bipolar orientation.” [6,7,8] Drawn in Figure 4.2 are the distributions of oxygen and hydrogen atoms of water at the NPA region in AQP1 and GlpF. The oxygen atom of a water molecule is coordinated by the two hydrogen atoms of the residues, N203 and N68 of GlpF, N194 and N78 of AQP1. In Figure 4.3, the radial distribution functions of water around the nitrogen atom of N68 and N203 for GlpF are depicted. The peaks of oxygen are about the same distance from the both residues making hydrogen-bonds. (See the illustrative picture in the insets of Figure 4.2.) Such orientation of water molecules entirely conflicts
with the configuration of the hydrogen-bond network of water, thereby it excludes the possibility of the proton-jump mechanism around that area.
Figure 4.2 a) and b) show the distribution of oxygen (pale red), and hydrogen (light blue) of water at the NPA region of AQP1 and GlpF. The dotted surfaces denote surface of channel.
Figure 4.3 Radial distribution functions of oxygen and hydrogen of water around the nitrogen atoms of N68 of AQP1 and N203 of GlpF.
In both channels, water distributes continuously throughout the channel, while the distribution of hydronium ions is intermitted by gaps due to the electrostatic repulsion originated from the positive charges in the channels. The gap is very large in the case of AQP1, extending from R197 to the NPA region. From the results, we can readily conclude in the case of AQP1 that protons are excluded from permeation primarily due to the electrostatic repulsion inside channel. On the other hand, there are two mechanisms to prevent a proton from permeating through GlpF, the electrostatic repulsion and the bipolar coordination of orientation of water, the mechanisms may not completely eliminate the possibility of proton conduction through the channel. The high barrier for the reorientation of a water molecule at the NPA region prevents a proton from transfer via the Grotthuss mechanism, but the hydronium ion may diffuse across this region. On the other hand, the small gap for the hydronium ion around R206 due to the electrostatic repulsion and/or the steric hindrance does not completely eliminate the possibility of a proton to transfer across the gap via the Grotthuss mechanism. The interpretation of the results is basically in accord with the picture proposed by G. Voth, [9] and is in harmony with the experiments which indicate the negligibly small conductivity of a proton through GlpF. [3] The physics of the proton exclusion in AQP1 and GlpF stated above are illustrated schematically in Figure 4.4.
Figure 4.4 Schematic illustration of mechanism of proton exclusion in AQP1 and GlpF
Computational detail
Table 4.1 Potential and structural parameters of solvents.
σ (Ǻ) ε (kcal/mol) q (e)
H (water) 0.400 0.0460 0.410
O (water) a 3.166 0.1550 -0.820
H (hydronium) 0.400 0.0460 0.500
O (hydronium) b 3.164 0.1550 -0.500
Cl-c 4.417 0.1178 -1.000
O-H (water) (Ǻ) a 1.000
∠HOH (water) (deg) a 109.5
O-H (hydronium) (Ǻ) b 0.980
∠HOH (hydronium) (deg) b 116.0
a SPC water [17], b Schmitt and Voth [18] and cOPLS [19]
The structure and potential parameters used in this calculation are summarized in Table 4.1. The dielectric constant and temperature of solvent are chosen as 78.8 and 298 K. The structure of AQP1 and GlpF are taken from the 1J4N [20] and 1LDA [6], respectively, in the Brookhaven Protein Data Bank, Amber-99 parameter set was used in this calculation for the AQPs [21].
In the present work, I have employed rigid models of aquaporins. I have ignored the membrane, since it is unlikely that the membrane plays significant role for the distribution of water and ions inside a rigid channel. The monomers of AQP1 and GlpF were immersed in the aqueous solutions of the hydrogen-chloride. (The hydrogen- chloride is assumed to be completely dissociated into Cl- and H3O+.) The concentration of the HCl used in this calculation is 0.01 M a. The 3D-RISM equation were solved on a grid of 2563 points in a cubic supercell of 128 Å3.
References
[1] G. M. Preston, T. P. Carroll, W. B. Guggino, and P. Agre, P. Science 256 (1992), 385.
[2] M. I. Zeidel, S. V. Ambudkar, B. L. Sith, and P. Agre, P. Biochemistry 31 (1992), 7436.
[3] S. M. Saparov, S. P. Tsunoda, and P. Pohl, Biol. Cell 97 (2005), 545. [4] B. L. de Groot, and H. Grubmüller, Science 294 (2001), 2353.
[5] B. L. de Groot, and H. Grubmüller, Curr. Opin. Struct. Biol. 15 (2005), 176. [6] E. Tajkorshid, P. Nollert, M. Ø. Jensen, L. J. W. Miercke, J. O’Connell, R. M.
Stroud, and K. Schulten, Science 296 (2002), 525.
[7] M. Ø. Jensen, E. Tajkhorshid, and K. Schulten, Biophys. J. 85 (2003), 2884. [8] B. Ilan, E. Tajkhorshid, K. Schulten, and G. A. Voth, Protein 55 (2004), 223. [9] H. Chen, B. Ilan, Y. Wu, F. Zhu, K. Schulten, and G. A. Voth, Biophys. 92 (2007),
46.
[10] A. Burykin, and A. Warshel, Biophys. J. 85 (2003), 3969. [11] A. Burykin, and A. Warshel, FEBS Letters 570 (2004), 41.
[12] N. Chakrabarti, B. Roux, and R. Pomès, J. Mol. Biol. 343 (2004), 493.
[13] N. Chakrabarti, E. Tajkhorshid, B. Roux, and R. Pomes, Structure 12 (2004), 65. [14] M. Kato, A. V. Pisliakov, and A. Warshel, Proteins 64 (2006), 829.
[15] B. L. de Groot, T. Frigato, V. Helms, H. and Grubmuller, J. Mol. Biol. 333 (2003), 279.
[16] N. Agmon, Chem. Phys. Lett. 244 (1995), 456.
[17] H. J. Brandsen, J. P. M. Postma, E. F. van Gunstern, J. Hermans, in: B. Pullman (Eds.), Intermolecular Force, Reidel, Dordrecht, 1981.
[18] U. W. Schmitt, and G. A. Voth, J. Chem. Phys. 11 (1999) 9361.
[19] J. Chandrasekhar, D. C. Spellmeyer, and W. L. Jorgensen, J. Am. Chem. Soc. 106 (1984). 903.
[20] H. Sui, B. Han, J. K. Lee, P. Wallan, and B. K. Jap, Nature 414 (2001), 872. [21] J. Wang, P. Cieplak, and P. A. Kollman, J. Comput. Chem. 21 (2000), 1049.
5. Ions transport in AQPs
Related article:
S. Phongphanphanee, N. Yoshida, and F. Hirata
“The Potential of Mean Force of Water and Ions in Aquaporin Channels Investigated by the 3D-RISM Method”
Journal of Molecular Liquids, in press.
AQPs prevent the conduction not only of proton but also of others cations and anions. [1- 4] AQPs channels commonly have positive electrostatic potential environment inside the channel. So, it is not surprising that cations are banned from moving across the channels. That is not the case for anions: the ions are not repelled from the channel by the electrostatic force. Therefore, it is not a trivial question why an anion is excluded from AQPs channels. There have not been many studies carried out by the molecular simulations on this problem, and their results are not consistent with each other: for examples the peak height and shape of PMF of ions in AQP1 are different from study to study. [5,6]
In this work, I present the results for the PMF of water and ions in the two aquaporin channels, AQP1 and GlpF, derived from the 3D-RISM theory.
As show in the Figure 4.1 of chapter 4, the region with positive electrostatic potential in AQP1 is extended throughout the channel; the potential is especially high in the middle region as is indicated by the red color. On the other hand, the positive potential is distributed only near the Ar/R and NPA regions in the case of GlpF. The difference in the electrostatic potential and that in the diameters of channel pore between the two channels produces a marked variety in the distribution of the ions.
Figure 5.1 The 3-dimensional distribution of oxygen of hydronium ion, red surface, sodium ion, yellow, and chloride ion, purple, and PMF of each solute species at the NPA region of AQP1 and GlpF in the top and bottom figure, respectively.
In Figure 5.1, the 3D-distribution of ions, H3O, Na+, and Cl-, are shown along the channel axis. The one-dimensional profile of the potential of mean force (PMF) of the solution components including water is also depicted in the same figure. As can be seen from the PMF, water inside the channels is a little more stable than that outside (or bulk),
and there is no appreciable barrier to prevent the molecules from diffusing through the channels for both AQP1 and GlpF. The finding is consistent with the observations that water is extremely permeable through those channels, and with the X-ray measurements which indicate the existence of more or less stable water molecules inside the channel pores. The finding, however, is in contradictory with the observations by the simulations which show the positive PMF throughout the channel pore. [4]
The 3D-distributions and PMFs of the ions inside the channels exhibit much more variety than those of water, which are explained as follows.
Aquaporin1 (AQP1)
In AQP1, the cations are excluded from a large area, extending more than 10 Å along the axis, which spans amino-acid residues from R197 (or Ar/R) to the NPA region. Although these gap areas exclude the hydronium ion, water still distributes along these areas. It is also understood from the figure that the distribution of the hydronium ion is determined essentially by the electrostatic potential inside the channel: the hydronium ion is excluded from the channel primarily by the positive electrostatic repulsion. The gap of the distribution of sodium ions is greater than those of hydronium ions. It is probably because the size of sodium ions is slightly larger than that of hydronium ions. So, the electrostatic and steric effects seem to be working in concerted manner to exclude sodium ions from the channel. The large gap in the chloride distribution around the R197 should have a different interpretation from the case of cations, because the electrostatic potential and the charge of the ion have opposite signs. In this case, the steric effect due to the bulkiness of ion, approximately 4.4 Å, dominates over the electrostatic attraction to
exclude the ion from the SF region of the channel. The results are consistent with the experimental findings which indicate that none of those ions are permeable through the AQP1 channel. [7]
Glyceral Facilitator (GlpF)
The distributions of the two cations, sodium and hydronium ions, in GlpF have a similar shape: the both cations have three peaks in the PMF located around NPA, Ar/R and the area surround by T137, G199 and I44. While the distribution is almost nothing at the three regions in the case of sodium ion, it vanishes only at the Ar/R region in the case of hydronium ion. The chloride ion also has a minimum in the distribution function at Ar/R region. The minimum in the case of chloride ions, though, is not as low as those in the cations. The finding suggests that there is a slight possibility that the anion can permeate through the channel. However, to our best knowledge, such experimental result, which suggests the possible chloride permeation through the channel, have not been reported. The results are suggestive of another mechanism working for chloride ions to be blocked from the permeation, which is a “trapping” mechanism. By taking a look at the PMF of Cl- in GlpF, one may notice that it has a long-lasting down-hill slope from the intracellular exit to the SF region, which turns uphill after passing through the deep valley around the SF region. The depth of the valley relative to the bulk is about -6 kJ/mol, about twice the thermal energy at the ambient condition, which is deep enough to trap a Cl- ion inside the channel when there is no electrostatic field. That may be the reason why the ion is not permeable through the channel in the physiological condition. My explanation, however, is just qualitative. The depth of the valley, -6kJ/mol, may change if one takes the membrane around the channel into account.
Computational detail
Table 5.1 Potential and structural parameters of solvents.
σ (Ǻ) ε (kcal/mol) q (e)
H (water) 0.400 0.0460 0.410
O (water) a 3.166 0.1550 -0.820
H (hydronium) 0.400 0.0460 0.500
O (hydronium) b 3.164 0.1550 -0.500
Cl-c 4.417 0.1178 -1.000
Na+c 3.330 0.0028 1.000
O-H (water) (Ǻ) a 1.000
∠HOH (water) (deg) a 109.5
O-H (hydronium) (Ǻ) b 0.980
∠HOH (hydronium) (deg) b 116.0
a SPC water [8], b Schmitt and Voth [9] and cOPLS parameter set [10,11]
The structure and potential parameters I used in this chapter are summarized in table 5.1. The dielectric constant and temperature of solvent are chosen as 78.8 and 298 K, same as the previous chapter. The structure of AQP1 and GlpF are taken from the 1J4N [12] and 1LDA [13], respectively, in the Brookhaven Protein Data Bank, Amber-99 parameter set was used in this calculation for the AQPs [14].
Same as previous chapter, I used rigid models of aquaporins and ignored the membrane, the monomers of AQP1 and GlpF were immersed in the aqueous solutions of the hydrogen chloride and sodium chloride. The concentration of both HCl and NaCl electrolyte solution are used in calculation is 0.01 M and 0.1M, respectively. The 3D distribution functions were calculated on a grid of 2563 points in a cubic supercell of 128 Å3.
References
[1] G. M. Preston, T. P. Carroll, W. B. Guggino, and P. Agre, P. Science 256 (1992), 385.
[2] M. I. Zeidel, S. V. Ambudkar, B. L. Sith, and P. Agre, P. Biochemistry 31 (1992), 7436.
[3] S. M. Saparov, S. P. Tsunoda, and P. Pohl, Biol. Cell 97 (2005), 545. [4] B. L. de Groot, and H. Grubmüller, Science 294 (2001), 2353. [5] Y. J. Ko, J. Huh, and W. H. Jo, Proteins 70 (2008), 1442. [6] G. V. Miloshevsky, P. C. Jordan, Biophys J. 87 (2004), 3690.
[7] P. Agre, M. D. Lee, S. Devidas, and W. B. Guggino, Science 275 (1997), 1490. [8] H. J. Brandsen, J. P. M. Postma, E. F. van Gunstern, J. Hermans, in: B. Pullman
(Eds.), Intermolecular Force, Reidel, Dordrecht, 1981.
[9] U. W. Schmitt, and G. A. Voth, J. Chem. Phys. 11 (1999) 9361.
[10] J. Chandrasekhar, D. C. Spellmeyer, and W. L. Jorgensen, J. Am. Chem. Soc. 106 (1984). 903.
[11] J. Aqvist, J. Phys. Chem. 94 (1990), 8021
[12] H. Sui, B. Han, J. K. Lee, P. Wallan, and B. K. Jap, Nature 414 (2001), 872. [13] E. Tajkhorshid, P. Nollert, M. Ø. Jensen, L. J. W. Miercke, J. O’Connell, R. M.
Stroud, and K. Schulten, Science 296 (2002), 525.
[14] J. Wang, P. Cieplak, and P. A. Kollman, J. Comput. Chem. 21 (2000), 1049.
6. Carbon dioxide and ammonia
transport in AQP1
Both CO2 and NH3 are metabolic by-products from the cellular respiration. The transportation of these molecules through the cell membrane is very important in eliminating of those from our body. CO2 is a linear molecule which has no electrical dipole and its effective diameter is larger than water. It has been believed that some gases, such as CO2, O2 and NO, transport across the cell membrane by dissolving in the membrane lipid bilayer. A NH3 molecule has physical properties similar to water, such as the size and electrical dipole moments. The mechanism of transportation of NH3 through the membrane has not been clarified yet. Some proteins such as AQPs and Rh glycoproteins are believed to facilitate the NH3 transportation. [1] Recently several experimental works indicated that AQP1 is playing a role on transportations of CO2 and NH3. [2-7] Nakhoul and coworkers measured the intracellular pH in the AQP1 expressing oocytes by microelectrode. [3] From the experiment, they concluded that the flux of CO2
through the membrane is increased due to the AQP1. Using the different technique, measuring the exchange of 18O in cell suspension of red blood cells and the alkaline surface pH on oocytes, Enderward et al. indicated a similar result that AQP1 is responsible for CO2 passing through cell membrane. [4] However, not all works support the role of AQP1 in transportation of CO2. [7,8] The study on erythrocytes and intact

![Figure 1.2 Phylogenetic tree of human (Hs), plant (Ath) and bacteria (AQP and GlpF) (Kruse et al., 2006) [4]](https://thumb-ap.123doks.com/thumbv2/123deta/6164057.104562/10.918.171.753.251.718/figure-phylogenetic-tree-human-plant-bacteria-glpf-kruse.webp)