Quantitative study of 3D radiation dynamics
during resonant magnetic perturbation assisted
detached plasmas in the Large Helical Device
Shwetang N. Pandya
DOCTOR OF PHILOSOPHY
DEPARTMENT OF FUSION SCIENCE
SCHOOL OF PHYSICAL SCIENCE
THE GRADUATE UNIVERSITY FOR ADVANCED STUDIES
2014
Dedicated to my parents
i | P a g e
Acknowledgements
As I head toward wrapping up my doctoral thesis, it seems that the seasons between three “Sakura” blossoms have flown past within a blink of an eye. These three knowledgeable years of my doctoral studies pursued at National Institute for Fusion Science (NIFS) have molded me in to a better physicist and above all a better human being. Towards the end of this memorable expedition, it’s a perfect time to acknowledge the cooperation and help of all the distinguished people without whom this endeavor wouldn’t have been successful.
I would like to express my heartfelt gratitude to my thesis supervisor Prof. Byron J. Peterson for giving me this wonderful opportunity to work with his brainchild diagnostic popularly known as Infrared Imaging Video Bolometer. I am indebted to him for the amount of faith and confidence that he had in me which eventually kept me fueled with ample of enthusiasm and new ideas to work with. He provided me with a blank canvas on which I can paint all the shades of my imaginations. He was always supportive and encouraged me during my tough times. I learnt a lot of good presentation skills from him.
I would also like to express my sincere regards towards Dr. Masahiro Kobayashi who co-supervised my thesis. His in-depth knowledge on various aspects of plasma boundary physics and EMC3-EIRENE simulations have enlightened me and has polished my understanding about the physics of plasma detachment. I thank him for very fruitful discussions that I had with him during the course of my studies. I apologize to him for asking the same questions, time and again, and not being able to live up to his expectations.
I am also thankful to all the academic staff of NIFS, especially, to Prof. S. Okamura, Prof. S. Masuzaki, Prof. K. Ida, Prof. N. Ohno, Prof. S. Sudo, Prof. M.
ii | P a g e
and Dr. K. Mukai for their extensive help and support during this tenure. I am thankful to Dr. Ken Robinson for suggesting language corrections in my thesis. I would also like to thank all the teachers who taught me various aspects of plasma physics during the course work at NIFS. I would also like to thank the LHD experiment team for their excellent support during the 16th and the 17th LHD experimental campaign, which helped me to carry out all the necessary diagnostic installations, modifications and experiments to gather enough data to be used for this thesis. Thanks are also due to the NIFS mechanical workshop team, Mr. Okada and Mr. Nishimura for promptly fabricating the soft iron shield for our infrared camera. I would also like to thank Dr. A. Enokuchi and Dr. N. Takeyama from Genesia Corporation for their help in designing and fabricating the IR periscope. I would also like to thank my colleagues at NIFS Mr. R. Sano, Mr. M. Ono, Mr. H. Zhou and Mr. M. Nakamura for their pleasant company during these years. Special thanks goes to my tutor student Mr. M. Nakamura who helped to setup my life in Japan.
I would also like to extend my sincere gratitude towards Prof. P. K. Kaw, Prof. A. Sen and Prof. D. Bora from Institute for Plasma Research (IPR), Gandhinagar for their constant encouragement. I am also grateful to the academic committee of IPR for their support in all the official matters pertaining to the sanction of my study leave for pursuing higher education. I would also like to thank my group leader Dr. J. Govindarajan from IPR for mentoring me through various aspects of infrared thermography which paid its dividends during my doctoral thesis.
I would also like to thank all the office staff of NIFS for their enormous help during these three years. Special thanks are due to Ms. Hayashi, Ms. Yoshimura, Ms. Kameyama, Ms. Matsubara, Ms. Matsuzaki, Ms. Aoki, Ms. Fujji, Mr. Taki, Mr. Hosoe and Mr. Kato for efficiently handling the daily affairs from Sokendai and NIFS. I am also indebted to the financial support from NIFS, YUKWAI and JASSO which kept me well funded during the entire period of my doctoral thesis.
iii | P a g e
Ajay, Mr. Manu Bajpai, Mr. Lavkesh Lachhvani and Mrs. Snehlata Gupta. It would be very selfish of me if I forget to mention Mr. Santosh Pandya, his wife Ami and cute little Aarya. I am grateful to Santosh for all the fruitful discussions that I had with him about my research and also for taking good care of my parents in my absence. Friends, I badly missed the parties and all the good times that we used to have together.
Besides having the wonderful company of my lovely wife Bhavinee, we were cherished to have a lot of Japanese friends and well-wishers who made our social life in Japan as smooth as silk. We would like to thank Mr. Yutaka Hirose, his wife Ms. Noy and their lovely kids for treating us as a part of their family. Thanks are also due to Ms. Norie, her husband Mr. Takahashi Yamaguchi and her cute kids. We also thank Ms. Watanabe, Ms. Sachie, Ms. Misuzu and their families for all the social gatherings that we had together. We would also like to thank the members of Tajimi international exchange association for their help during our stay in Japan. Special thanks are due to Ms. Yasui, Ms. Tanaka and Ms. Naruse for giving us ample opportunities to socialize and introduce our motherland ‘India’ to the citizens of Tajimi at several occasions. We also express our sincere thanks to Mr. Mizuno from NIFS Helicon club for being a good friend of Bhavinee.
I would like to thank all our relatives and neighbors for taking good care of my parents in my absence. I would also like to thank my in-laws Mr. Vinod Dave and Mrs. Bhartee Dave for their encouragement and blessings. I also express my deepest gratitude towards my grandparents for their blessings. I am grateful to my beloved wife Bhavinee for her inexhaustible love, patience and encouragement that powered me through my difficult times. I owe a lot of this achievement to her. Finally, I am indebted to my parents Mr. Nalin Pandya and Mrs. Chandrika Pandya, whose perseverance made me capable for this endeavor. I am living their dream and I humbly dedicate my thesis to my beloved parents.
iv | P a g e
v | P a g e
Contents
i. List of Figures
ixii. List of Tables
xviii. Abstract
xvii1. Introduction
11.1
Energy crisis and the case for nuclear fusion 21.2
Concept of divertors and its merits 51.2.1 Poloidal divertor and relevant terminology 6 1.2.2 Merits of divertor and need for detachment 8
1.3
Divertor operation regimes 10 1.3.1 Sheath limited regime 101.3.2 High recycling regime 10 1.3.3 Detachment regime and divertor operation in fusion reactor 12
1.4
Motivation and Contribution 131.5
Organization of the thesis 14 References 162. Divertor detachment scenario on LHD
192.1
Divertor detachment - a qualitative understanding 202.2
Experimental observations of divertor detachment 222.3
The basic 'Two-Point Model' and divertor detachment 252.4
A short introduction to LHD 282.5
Magnetic field structure of LHD 312.6
Detachment related observations on LHD 33 2.6.1 Typical observations about sustained island assisted detachment 33 2.6.2 Radiation pattern during the detachment 36 2.6.3 Effect of island size and location on detachment stabilization 372.7
Summary 39vi | P a g e
3. Infrared imaging Video Bolometer ( IRVB)
433.1
Introduction to Bolometry 443.2
Segmented mask Infrared imaging Bolometer (SIB) 453.3
Infrared Imaging Video Bolometer (IRVB) 473.4
Sensitivity comparison - SIB and IRVB 483.5
Sensitivity of IRVB for Crank-Nicholson method 513.6
Camera Performances and Sensitivity 523.7
Selection of foil material 543.8
IRVBs installed on LHD 563.8.1 Upper port IRVB (6.5-U) for the 16thLHD experiment cycle
58
3.8.2 Tangential port IRVB (6-T) 61
3.8.3 Lower port IRVB (6.5-L) 62
3.8.4 Semi-tangential port IRVB (10-O) 63
3.9
Summary 64References 65
4. Optical design and resulting improvements in
IRVB
67
4.1
Introduction 684.2
IRVB Sensitivity 684.3
Radiometric estimations 694.4
Design Specifications 734.5
Evaluation of optical performance 794.6
Improvement in IRVB performance with addition of periscope 814.7
Summary 84References 85
5. IRVB foil calibration
875.1
Introduction 885.2
Review of IRVB calibration techniques 895.3
Estimation of surface heat capacity Cs using UV LED 915.3.1 Concept and procedure 91
5.3.2 Calibration results and drawbacks 94
vii | P a g e
5.4.1 Concept and its theoretical validation 98 5.4.2 Analysis code and its experimental validation 101
5.5
Diffusivity estimation for IRVB foil 1055.5.1 Experiment and results 105
5.5.2 Discussion on experimental results 107
5.5.3 Merits of thermographic technique 109
5.6
Summary 110References 111
6. Improvements on IRVB
1136.1
Introduction 1146.2
Justification for the use of the heat diffusion equation 1156.3
IRVB Noise equivalent power density (NEPD) – revisited 1166.4
Charge exchange neutral’s contribution to the IRVB 1226.5
Estimation of power due to the blackbody radiation from the divertor tiles in the IRVB FoV125
6.6
A study of various aspects affecting the analyzed data from IRVB126
6.6.1
Effect of spatiotemporal averaging and smoothening 1266.6.2
Effect of first frame (background) subtraction 1286.7
Validation of the power estimation by the IRVB 1316.8
Summary 132References 134
7. Dynamics of radiative structures on LHD
1357.1
Introduction 1367.2
EMC3-EIRENE modeling 1377.3
The Synthetic Instrument 1417.4
Time evolution of a discharge without a RMP 1447.5
Time evolution of a RMP assisted detachment discharge 1497.6
Qualitative comparison of radiation from modeling with experiment152
7.7
Qualitative comparison between model and experiment for D⊥=2.0 m2/s155
7.8
Quantitative comparison between the model and the experiment157
7.9
Quantitative comparison between the model and the experiment using a line profile measurement160
viii | P a g e
References 167
8. Summary and conclusions
169References 174
Publications
iConference Proceedings
iiiix | P a g e
List of Figures
1.1 D-T Fusion reaction 4
1.2 Reaction rates for various fusion fuel candidates 4 1.3 Schematic of poloidal divertor geometry showing various
regions of the plasma
7 1.4 Schematic showing various regimes for the divertor operation.
(a) the sheath limited regime - highly localized particle flux, only surface recombination (b) the high recycling regime - radiative cooling due to neutrals and volumetric recombination (c) detachment regime - leading to MARFE instability (d) partial detachment regime - suitable for future machines. (black arrow – plasma flux in the SOL, blue arrows – neutral atoms, red arrows – radiation)
11
1.5 A qualitative comparison between the results from modeling and experiment
14 2.1 Density dependence of key plasma parameters measured
experimentally
22 2.2 Poloidal cross-section of LHD showing various magnetic coils,
as well as horizontal and vertical plasma elongations signifying 3D shape of the LHD plasma
29
2.3 A 3D view of LHD magnetic coils along with the LID coils at the top and bottom ports
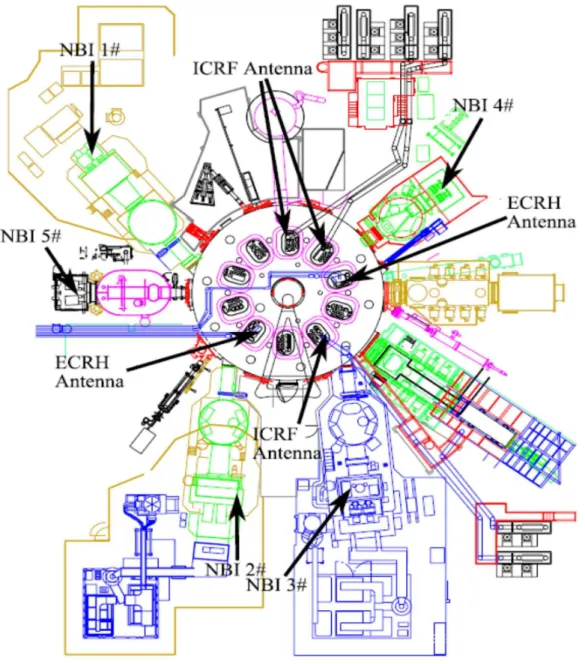
29 2.4 Top view of LHD showing various heating systems 30 2.5 The distribution of connection lengths with and without m/n=1/1
RMP
32 2.6 Shot summary for a detached discharge # 121351 34 2.7 Radial profiles of Electron temperature (Te) and plasma density
(ne) measured by Thompson scattering for a typical detachment discharge on LHD
35
2.8 (a) AXUVD radiation profiles for discharges with (right) and without (left) RMP. (b) the lines of sight for AXUVD array
36 2.9 Perturbation coil current, Icoil, versus detachment transition
density, ndetach ,and radiative collapse density, ncollapse
38 2.10 Line averaged density versus the radiation evolution from the
resistive bolometer for various perturbation coil currents
38 3.1 (a) Foil sandwiched between two identical segmented masks. (b)
Heat distribution due to absorbed power from LHD plasma
45 3.2 (a) Foil sandwiched between two identical IRVB frames. (b)
Heat distribution due to absorbed power from LHD plasma during detachment.
47
x | P a g e
material
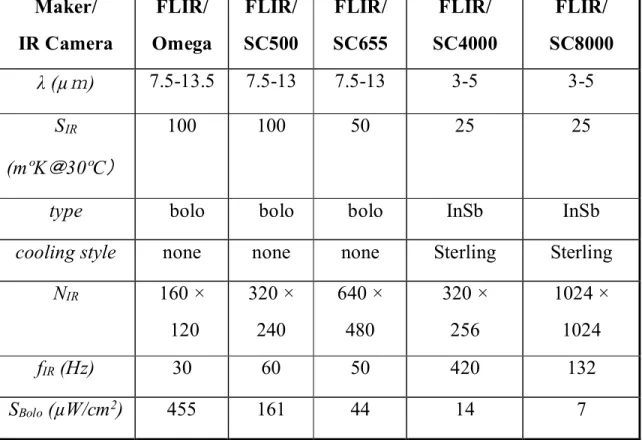
3.4 SIRVB versus Nbol for a platinum IRVB foil with Af = 130 cm2, tf = 2.5 µm, fbol = 30 Hz for 5 different IR cameras
54 3.5 Attenuation Length vs. photon energy for a) Au and b) Pt 55 3.6 Location and fields of view of IRVBs installed in LHD 56
3.7 CAD FoVs for all the IRVBs of LHD 57
3.8 Concept of the IRVB, showing aperture, IRVB foil, light shielding pipe and the IR camera mounted inside a double soft iron shield. The inset picture shows the IRVB foil (bound by a rectangle) as seen by the IR camera. The IR camera pixels imaging the foil are 190 × 150
59
3.9 Block Diagram for 6.5-U IRVB 60
4.1 Caricature showing the flow of radiometric estimation 70 4.2 Estimation of bandwidth factor F from the integrated spectral
radiant emittance curve derived from the universal blackbody curve. The region of interest is highlighted by a pink band
72
4.3 Wide FoV IRVB equipped with an IR periscope. Ray-tracing from the foil to the IR detector is also shown. The inset picture shows a larger footprint of the IRVB foil (bound by a rectangle), as imaged by the IR camera. The IR camera pixels imaging the foil have increased to 535×410 which is a significant 7.5 fold increase compared to the previous configuration
75
4.4 CAD FoV traced from the foil location through the aperture. The CAD shows IRVB pixels (grid), magnetic axis (curved brown line), upper and lower helical diverter X-points (pink and indigo lines respectively) and helical divertors (thick green bands
75
4.5 3D CAD schematic of periscope optics 78
4.6 (a) Polychromatic geometrical spot diagram. FIG. 4.6(b) Percentage distortion. FIG. 4.6(c) Polychromatic diffraction MTF. FIG. 4.6(d) Ensquared energy
80
4.7 Shot summaries for two discharges # 115065 without periscope and # 121010 with periscope
82 4.8 (a) Power density estimation for discharges # 115065 at fbol=10
fps (without periscope, 16th LHD experimental cycle) (b). Power density estimation for discharges # 121010 at fbol=10 fps (with periscope, 17th LHD experimental cycle) (c). Power density estimation for discharges # 115065 at fbol=20 fps (without periscope, 16th LHD experimental cycle) (d). Power density estimation for discharges # 121010 at fbol=20 fps (with periscope, 17th LHD experimental cycle)
83
5.1 Schematic showing the IRVB foil calibration setup using a laser. This setup can also be used with UV LED
93
xi | P a g e
inside the calibration vacuum chamber. FIG. 5.2(b) The plate having four 3 mm diameter apertures is shown mounted onto the LED module to form four distinct LED spots on the IRVB foil 5.3 (a) Graph showing the linear fit between the average LED energy
and LED pulse length, for all four LEDs (b) Graph showing the linear fitting between the average temperature rise due to LED pulse of various duration, for all four illumination locations
95
5.4 Cs map for a 2.5 µm platinum foil having 130 mm×100 mm dimension
97 5.5 (a) Thermal image acquired by the IR camera showing four
distinct LED spots towards the edge of the foil (b) Thermal image acquired by the IR camera showing four distinct LED spots at the center of the foil. LED spot size is smaller and the temperature is higher than the thermograph shown in FIG. 5.5(a) indicating reduced distance between foil and LED
97-98
5.6 (a) Simulated thermal decay for AISI SS304 using Eq.5.3, shows widening of the Gaussian profile with time (b) Linear fit of squared Gaussian beam radius vs. time derived from FIG. 5.6(a). The slope of the fitted line is proportional the thermal diffusivity
100
5.7 (a) Thermal image of AISI SS304 sample illuminated with laser spot. The figure also shows a horizontal profile passing through the center of the spot (b) Thermal image of AISI SS304 sample illuminated with laser spot. The figure also shows a horizontal profile passing through the center of the spot
103
5.8 (a) Thermal decay for AISI SS304 observed with thermal imaging camera, shows widening of the Gaussian profile with time (b) Linear fits (thick lines) and 95% confidence intervals (pairs of thin lines) of squared Gaussian beam radius vs. time derived from FIG. 5.8(a) The thermal diffusivity is one-half of the slope of this straight line
104
5.9 SEM image showing the cross-section of a graphite coated 2.5
µm platinum foil used for IRVB 105
5.10 κ map for a 2.5 µm platinum foil having 130 mm×100 mm dimension
106 6.1 κmap for a 2.5 µm platinum foil having 13×10 cm2 dimension 115 6.2 (a) Change in the camera NETD and IRVB NEPD with
increasing foil temperature. (b) Variation in the contribution of each error term with increasing foil temperature. (c) Variation in the percentage contribution of each error term with increasing foil temperature.
121
6.3 Power estimation due to CX neutral on 6.5U IRVB foil 123
xii | P a g e
CAD shows IRVB pixels (grid), magnetic axis (curved brown line), upper and lower helical diverter X-points (pink and indigo lines, respectively), and helical divertors (thick green bands) 6.5 (a) Graph shows the effect of spatial averaging (without temporal
averaging) on the mean power density, (b) Graph shows the effect of temporal averaging (without spatial averaging) on the mean power density. (c) Graph shows the time evolution of power density from LHD discharge #121371 averaged over 24×18 IRVB pixels for different IRVB frame rate (temporal averaging)
127
6.6 Narcissus effect observed by a cooled infrared camera while viewing the IRVB foil
129 6.7 Power density from LHD discharge # 121371 at t = 6.5 s,
estimated (a) Using the uncorrected, relative temperatures after first frame subtraction. (b) Using the corrected, absolute temperatures after first frame subtraction
130
6.8 Validation of the data analysis procedure. The blue line is the laser power incident on the foil. The green and the red curves shows the power retrieved after solving 2D heat diffusion equation for different values of thermal diffusivities. The magenta curve show the underestimation of the power when the relative temperatures are considered for the blackbody term. The temperature rise due to the laser spot measured by the IR camera is shown by the inset picture
131
7.1 Poloidal radiation distribution estimated by EMC3-EIRENE without RMP (attached)
139 7.2 Poloidal radiation distribution estimated by EMC3-EIRENE
with RMP (during detachment)
140 7.3 Global structure of the radiation estimated by EMC3-EIRENE
(a) without RMP (attached plasma) (b) with RMP (during detachment)
140
7.4 Flow chart showing the procedure for generating the emissivity and geometry (also termed as response matrix), finally multiplied to give a synthetic image which represents the power densities illuminating the IRVB foil through the pinhole geometry
142
7.5 Schematic showing the comparison between the experiment and modelling
143 7.6 Time traces of various LHD plasma parameters for LHD
discharges # 121839 and # 121351. The reduction in the plasma stored energy for discharge # 121351 may be attributed to the shrinking of the plasma volume due to the induction of RMP
145
xiii | P a g e
upper port IRVB for the LHD discharge # 121839 which collapses radiatively at 5.7 s. The magnetic axis (curved white line), upper and lower helical diverter X-points (thick and thin pink lines respectively)
7.8 Evolution of the power density profiles evaluated for the upper port IRVB of the LHD using a synthetic instrument and the radiation predictions from the EMC3-EIRENE modelling. The magnetic axis (curved white line), upper and lower helical diverter X-points (thick and thin pink lines respectively)
147
7.9 Time evolution of the power density profiles measured from the upper port IRVB for the LHD discharge # 121351 with RMP assisted detachment. The magnetic axis (curved white line), upper and lower helical diverter X-points (thick and thin pink lines respectively)
150
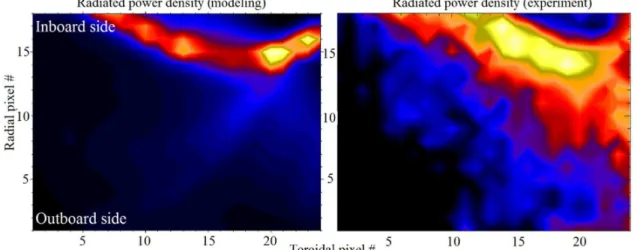
7.10 Qualitative comparison between the radiation from the EMC3- EIRENE model (D⊥ = 1.0 m2/s) and experiments. The evolution of the power density profiles shown are from the upper port IRVB
153- 154
7.11 Qualitative comparison between the radiation from the EMC3- EIRENE model (D⊥ = 2.0 m2/s) and experiments. The evolution of the power density profiles shown are from the upper port IRVB
155- 156
7.12 Normalized integrated power plotted against the line averaged density, both for experiment and synthetic images
158 7.13 Power density from the synthetic image, showing two radial line
profiles
160 7.14 Line profiles showing the power density from the synthetic
images and experiments (a) passing through both the HDX points (channel #16) (b) passing through the peak of the radiation band (channel #20)
161
7.15 Radial profiles of bremsstrahlung radiation at various line average densities
164 7.16 Power density profiles with and without core bremsstrahlung
radiation
164
xiv | P a g e
xv | P a g e
List of Tables
1.1 Regions of plasma and their radiation characteristics 8
2.1 LHD plasma diagnostics used for this study 30
3.1 Performance parameters of IR cameras and the resulting SIRVB for a platinum IRVB foil with Nbol = 432, Af =130 cm2, tf =2.5 µm, fbol = 30 Hz ( µbolo – microbolometer )
53
4.1 Detector and optical design parameters for the re-imaging periscope optics
76 4.2 Comparison between various parameters (section 4.3) for upper
port IRVB with and without IR periscope
77 5.1 Thermal diffusivities for various materials with different thickness.
Reported experimental values are mean and standard deviation over several data samples taken at various spatial locations. The linear correlation coefficient for the straight line fit for all the measured values is better than 0.95.
108
xvi | P a g e
xvii | P a g e
Abstract
The objective of this thesis is to study the dynamics of the 3D radiative structures in the Large Helical Device (LHD) during the resonant magnetic perturbation (RMP) assisted plasma detachment experiments. Plasma detachment is foreseen as an important operational regime for future fusion devices. This inevitability is due to the ability of detached plasmas to keep the overall heat loads on the plasma facing components within the engineering design limits, eventually prolonging the lifespan of those expensive components. Plasma detachment is a phenomenon with a rich mix of diverse physical processes. The RMP assisted plasma detachment experiment carried out on LHD has shown a modulation in the edge radiative structures, once the discharge enters in to the detachment phase. The dynamics of the radiative structures in LHD are studied in two dimensions (2D) using an Infrared imaging Video Bolometer (IRVB). The plasma edge of LHD is modelled using the EMC3-EIRENE code which, qualitatively, shows trends similar to the experimental observations. Qualitatively, there is a disagreement between the experimental and the modeling results which will be addressed as a part of this research project.
This thesis has two broad bifurcations. Firstly, the IRVB diagnostic has been improved in terms of its sensitivity and signal to noise ratio, calibrated thoroughly to quantify the measurements, several validations and noise estimations are carried out to gain confidence in the analyzed data and the quantitative results, the first of their kind, are presented and compared with the modeling results from EMC3-EIRENE. Secondly, the dynamics of the plasma radiation are experimentally studied and a quantitative comparison with the modeling is attempted. Such a quantitative comparison is a first step towards
xviii | P a g e
transport code and will improve the assumptions made in the transport model. As a part of the diagnostic upgrade, the IRVB installed at the top diagnostic port of LHD was chosen to be modified since it offers a unique view of the toroidal and radial extent of the plasma. An infrared periscope was designed and built to increase the sensitivity and the signal to noise ratio (SNR) of the diagnostic. Addition of the periscope to the IRVB led to a theoretical improvement of the sensitivity by 1.4 times and the SNR by 4.5 times. The effective SNR has actually increased by a factor > 4 after this upgrade which matches closely with the theoretical estimate.
Along with the improvement in SNR and sensitivity of the diagnostic the calibration of the IRVB platinum foil is also necessary to accurately estimate spatial variation of the thermophysical properties of the foil. A calibration method for estimating thermal diffusivity of the foil, was adopted and demonstrated. The heat diffusivity estimated for the Pt foil using this method was found to be 2-2.5 times lower than the literature value. This was attributed to the effect of the graphite coating applied to improve the emissivity of the foil. The decrease in the thermal diffusivity also explains the higher sensitivity of the platinum foil over the gold foil. This method is independent of any assumptions and fast enough to calibrate the entire foil and analyze the data in < 6 hours.
The improved and calibrated IRVB was used during the 17th experimental campaign to study the RMP assisted detachment. The merits of the diagnostic upgrade are evident from the qualitative comparison of the experimental results with the modeling results. Modeling predicted a flip in the radiation from the RMP X-point to the O-point during detachment, at higher densities. This fact was confirmed, for the first time, experimentally by using the improved IRVB diagnostic. The IRVB was for the first time brought to a stage by all the improvements and calibration that it can confidently quantify the radiation
xix | P a g e
for choosing the correct impurity diffusion and sputtering coefficient which can improve the match between the radiation estimated by the EMC3-EIRENE model and the experimental observations. In an attempt to establish a better match between the experiment and the modeling, firstly, the impurity diffusion coefficient was changed from D⊥=1 m2/s to D⊥=2 m2/s which diffuses the radiation distribution to better match the experiments. The quantitative comparison is attempted using the normalized integrated power from the experiment and the modeling. The comparison signifies that the model still predicts more power than the experiment, especially after the detachment, which is indicative of the change in the sputtering coefficient after the plasma detaches. The sputtering coefficient is reduced from 1% to 0.5% after the discharge goes into the detachment to establish a better match between the experiments and the modeling. This significantly reduces the amount of radiation estimated by the code and there modeling results are in better agreement with the experiments. Such a comparison is an ongoing process and would result in to a set of parameters for which the model and experiments would converge. Hence the improved and calibrated IRVB serves as a guideline for fine-tuning the model assumptions.
xx | P a g e
Chapter 1
Introduction
Introduction
1.1 Energy crisis and the case for nuclear fusion
1.2 Concept of divertors and its merits
1.2.1 Poloidal divertor and relevant terminology
1.2.2 Merits of divertor and need for detachment
1.3 Divertor operation regimes
1.3.1 Sheath limited regime
1.3.2 High recycling regime
1.3.3 Detachment regime and divertor operation in
fusion reactor
1.4 Motivation and Contribution
1.5 Organization of the thesis
References
2 | P a g e
1.1 Energy crisis and the case for nuclear fusion
Electricity has been the bread and butter for human life for more than a century. Its growth has increased exponentially over the years with the increase in its easy accessibility to a majority of the population in the industrialized world. The thirst for electricity has seen such a steep rise owing to its cost effective production, ease in transportation and utilization. The popularity of electricity, in part, is due to the flexibility that it offers in its conversion to other useful forms of energies like light and sound, at the flip of a button. Such a wide spread acceptance of electricity has made it a yardstick to measure the human development index (HDI) of a country, signifying the quality of life, which is determined by the per capita consumption of electricity [1]. The demand is expected to increase around three fold by the middle of this century due to a steady rise in the economies of densely populated parts of the world like India and China. Around five billion people are expected to join the brigade of electricity consumers (expected consumption equivalent to the world average to begin with and eventually to the average of the developed world) by the middle of this century due to the rise in their average standard of living. Hence immense energy hunger can be expected in the near future. Currently, a majority of the energy needs are sufficed by burning fossil fuels like coal, oil and natural gas. This has resulted in fast depletion of the fossil fuel reserves along with a looming danger of global warming from the greenhouse gases which are produced as a by- product. Coal is the main fossil fuel used for the generation of electricity and is expected to last for a couple of centuries. The renewable energy sources like solar, wind and hydro, despite seeing several radical improvements, are only expected to play a supporting role to meet the peak hour requirements of the industries. These renewable sources lack the much required energy density desired for feeding power, self-sustainably, to the industrial establishments and the urban households. According to an estimate, 66% of the world’s oil reserves are owned by 6% of the nations [2], which is a highly uneven distribution and thus often
3 | P a g e
results in political conflicts, as the world has encountered in the past couple of decades. The conventional fission reactors can supplement the use of fossil fuels to a certain extent but they are not seen as a substitute for a fossil fuel driven scenario because of widely pronounced public opposition due to genuine concerns about proliferation, radioactive wastes and fear about nuclear disasters like Chernobyl and more recently Fukushima. Hence, a viable alternative energy resource is sought-after which has sufficiently high energy density, based on efficient and environment friendly energy generation from the fuels that are available globally in abundance, and consequently receiving a wide public acceptance.
Humans have always turned to nature to seek solutions to many problems. The answer lies above the horizon, deep in space with the stars and the process that keeps them burning. The nearest star and center of the our solar system, the sun, is powered by nuclear fusion where two light hydrogen nuclei fuse together to form helium and the mass deficit is converted to energy by Einstein’s equation E=mC2. Fusion can only be realized if both the fusing nuclei come sufficiently close to each other, whereby, the short range nuclear forces dominates the long range coulomb repulsive force due to their like charges. The reactant nuclei need to be heated to millions of degrees °C so as to impart enough kinetic energy to overcome the electrostatic repulsive force. At such a high temperature matter turns to plasma which is a quasi-neutral mixture of electrons and ions, exhibiting a collective behavior, often termed as the fourth state of matter. The fusion reaction between the most favored reactants, the two heavy isotopes of hydrogen, Deuterium (D) and Tritium (T) is depicted in Fig. 1.1. The by-products of the fusion reaction are a α-particle (helium nucleus) accounting for 3.5 MeV energy and a highly energetic 14.1 MeV neutron. The energy of a α-particle will be used for self-heating of the plasma while the energy of the neutron will be tapped for the generation of electricity.
4 | P a g e
FIG. 1.1 D-T Fusion reaction [6]
FIG. 1.2 Reaction rates for various fusion fuel candidates [3]
Fig. 1.2 elucidates the reason for the D-T reaction to be the most favored one to initiate fusion with. The figure shows the reaction rates of various fuel candidates, which peak around 70 keV for the D-T case, making it comparatively easy to realize [3]. Deuterium is a stable hydrogen isotope found in abundance in sea water (30 g m-3), while tritium is radioactive with a half-life of 12 years and has to be bred in a reactor from lithium also abundant in nature (30 ppm). The high energy density of the fusion reaction with all other merits like abundant and
5 | P a g e
equally distributed fuel resources, safety and environment friendliness makes fusion a suitable substitute to meet the energy demands of the future. The plasma being at such a high temperature, needs to be held isolated from any material surface just to make sure it does not accumulate enough impurities from plasma surface interaction that may cool and quench the plasma by impurity radiation. Holding the plasma in a magnetic bottle is a solution where by both of the charged species are compelled to follow the magnetic field lines confining the high density and high temperature plasma, long enough for fusion to occur. Currently two such magnetic confinement concepts, namely the Stellarator [4] and the Tokamak [5] are widely explored and practiced. The tokamaks (ITER [6], JET [7] & DIII-D [8]) use a toroidally symmetric magnetic field and a strong plasma current producing a poloidal field resulting in helically twisted magnetic field lines. The second configuration, stellarator (W-7X [9] and LHD [10]), uses twisted coils to helically twist the magnetic field lines. Unlike tokamaks, the magnetic field topology of a stellarator has a complex three dimensional shape, hence lacks the toroidal symmetries.
1.2 Concept of divertor and its merits
The magnetic bottle concept presented in section 1.1 is far from being perfect and there are several mechanisms like turbulence, drifts and inter particle collisions that results in cross-field (i.e., perpendicular to the field lines) transport of the energy and particle flux. To replenish these losses the plasma needs to be heated and fueled continuously by heating sources like neutral beam injectors and microwaves which can resonate with both the charge species and impart them the required energy to overcome the energy losses. The externally applied heating power as well as the internally generated fusion power needs to be removed from the plasma in a steady state operation. The heat and particle flux leaving the plasma are often terminated at the material surface deliberately placed inside the confinement chamber called the plasma facing components (PFCs). The PFCs
6 | P a g e
called limiters, used in older confinement devices, cut the nested field lines and define the last closed flux surface (LCFS). The open field lines outside the LCFS, termed as the scrape-off layer (SOL), terminates on the limiter guiding the exhaust from the plasma on the PFCs. The bombardment of high energy particles from the plasma on the limiter causes material sputtering which contributes to the impurities which radiate and cool down the plasma to radiative collapse. Hence it is desirable to have the plasma surface interaction take place at a location remote from the main confined plasma. Also it will be mandatory for the future fusion reactors to remove the α-particles from the plasma after they transfer their energy to keep the plasma burning. The excess of helium ion in the main plasma chamber would reduce the fusion reaction rate by diluting the fuel in the core making the realization of breakeven and ignition difficult [13]. Pumping of this helium-ash can take place only at the plasma edge where the temperatures are low enough for the plasma surface interaction to take place. Such a favorable alternative to limiters is used in almost all the modern confinement devices and is termed as a divertor. The divertors can be shaped appropriately to reduce the heat and particle fluxes bombarding the divertors and to increase the neutral pressures near the pumping ducts which increases the helium-ash pumping efficiencies while reducing the impurities production. Fig. 1.3 shows the schematic of the most popular divertor configuration called the poloidal divertor, along with various key regions of the plasma.
1.2.1 Poloidal divertor and relevant terminology
In a tokamak the poloidal divertor configuration can be realized by using a external poloidal field coil carrying a current ID in the same direction as the plasma current IP which shapes the magnetic field lines to form the flux surfaces with a figure 8 shape in a poloidal cross-section [11]. At a specific poloidal location the fields produced by ID and IP cancels each other and the resulting magnetic field is zero forming a null which is termed as an X-point.
7 | P a g e
FIG. 1.3 Schematic of poloidal divertor geometry showing various regions of the plasma [12]
The magnetic flux lines passing through the X-point are termed as the separatrix. The points where the separatrix hits the target plate are termed as the strike points. The closed flux surfaces inside the separatrix contain the confined plasma, termed as the plasma core. The particles that manage to diffuse across the separatrix, while traveling along the open set of flux tubes are terminated on the solid material surfaces termed as divertor targets which cut the flux surfaces and act as sink for plasma. The closed flux surface adjacent and inside the separatrix is called the LCFS which separates the core plasma from the open SOL field lines terminating on the divertor target. The region of the SOL adjacent to the confined region is termed as upstream and the one near the target plates as downstream. The poloidal divertors are axi-symmetric, toroidally.
All the distinct regions in the plasma can also be defined in terms of the normalized poloidal flux coordinate, ρ [13]. ρ = 1 represents the LCFS and ρrad is
8 | P a g e
the region with intense impurity radiation and typically represented as ρrad ~ 0.9. Table 1.1. summarizes all these regions of the plasma differentiated in terms of ρ, along with their typical radiation characteristics.
Table 1.1. Regions of plasma and their radiation characteristics
Region of
the
divertor
Extent in
terms of ρ
Typical characteristics in terms
of impurity radiation
plasma core ρ ˂ ρrad the neutral particle density is negligible
low-Z impurities are fully stripped
the radiated power density is low core
periphery
ρrad < ρ < 1 neutrals may exist in small numbers
low-Z impurities are not fully stripped
significant radiation can occur scrape-off
layer
ρ > 1
(excluding the divertor region)
neutrals may exist in small numbers
low-Z impurities are not fully stripped
significant radiation can occur divertor
region
ρ > 1
(near the X-point)
high neutral densities
high impurity levels
high radiation density private flux
region
ρ < 1
(below the X-point)
high neutral densities
high impurity levels
moderate radiation density
1.2.2 Merits of divertor and need for detachment Merits of the divertor are summarized below:
The divertor targets can be located at far enough distances from the LCFS by making a deep divertor configuration which will help in reducing the impurities penetrating directly into the core plasma.
The divertor configuration naturally allows the build-up of high neutral pressures there by facilitating the effective pumping of helium ash by the pumping ducts embedded in the divertor channel, preventing the dilution of the burning plasma in the core
9 | P a g e
The divertor modules can be shaped to make a shallow angle with the magnetic flux lines hence reducing the plasma flux. The power loads on the plasma-facing components can also be effectively controlled by volumetric loss processes, a key advantage available to divertors
A favorable regime for high power operation called plasma detachment was first realized in the divertor configuration
The parallel transport along field lines is faster than the perpendicular transport which restricts the radial power fall-off lengths outside the LCFS to a few cm in the region above the X-point. The majority of the energy and particles entering the SOL from the core are transported to the divertor targets, parallel to the field lines and less on the machine walls through cross-field transport. Around 150-200 MW of power exhaust is expected to enter the SOL for ITER [14]. The peak power loads expected for ITER divertors are > 20 MW/m2 against the engineering limit of 10 MW/m2 which leaves more than 50% of the exhaust power to be quenched by other suitable alternatives. The divertor target material near the strike point is constantly bombarded by energetic particles resulting in its erosion by physical sputtering. This increases the impurity concentration and has a significant adverse effect on the useful lifespan of the PFCs. Physical sputtering cannot occur below certain threshold energies hence it is advantageous to have low plasma temperatures near the target plates. Hence an operational regime is necessary which can effectively bridge the contrary requirements of the core and divertor regions of the plasma confinement device. Such a regime where the plasma detaches from the divertors was first identified on ASDEX [15] and is termed as the detachment regime. The divertor detachment is characterized by reduced particle flux, a drop of plasma pressure along the field lines, low plasma temperature and high neutral pressures in the vicinity of the targets. The plasma accesses the detachment regime through a series of predecessor regimes, as discussed in section 1.3.
10 | P a g e
1.3 Divertor operation regimes 1.3.1 Sheath Limited regime
The plasma densities are gradually ramped up as a part of fuelling to attain the desired operational densities. To start with, the divertor will access the sheath limited regime, when the plasma density in the SOL is sufficiently low. Here, ideally there is no temperature gradient parallel to the magnetic flux tubes but practically it is negligible. Hence all the power entering the SOL reaches the divertors, purely through convective transport. The power deposition is highly localized close to the divertor strike points. A Debye sheath is formed due to the interaction of plasma with the material surface and the power entering the SOL that can be removed by the divertors is limited by the power crossing the sheath region. Hence this regime is called the sheath limited regime. Since the upstream and downstream temperatures are almost equal in the sheath limited regime, the divertors experience very high heat loads due to high particle fluxes as depicted by Fig. 1.4(a).
1.3.2 High Recycling regime (Conduction limited regime)
The plasma particle flux to the targets increases with the increase in the plasma density in the SOL by fuelling. The charged particles of a plasma recombine on the target surfaces to form neutrals that get released subsequently from the target back into the plasma resulting into a process called recycling. The recycling intensifies with increasing density as the number of neutrals entering the SOL increases and can be conveniently termed as the high recycling regime. These recycled neutrals get ionized in the SOL plasma, near the target plates removing the energy from the SOL. Consequently the temperature along the field line drops. The presence of impurities (source: the target plates, the walls and/or induced impurity, i.e., impurity seeding) also contributes to decreasing the SOL plasma temperature by enhancing the radiative losses, further cooling down the
11 | P a g e
divertor plasma. This positive feedback steepens the temperature gradient between the upstream and downstream locations. The pressure along any magnetic flux line is still maintained in this regime since the density increases and the temperature decreases. The collisionality escalates, favored by low temperatures and high densities in front of the target, the conduction supersedes the convection and hence this regime is also termed as the conduction limited regime. Since the recycling neutrals are now being ionized in front of the divertor target, the target plates acts as the dominant particle source, unlike the SOL in the case of the sheath limited regime. Noteworthily, the volumetric radiation in front of the targets reduces the power flux reaching the divertor, thereby increases the lifetime of the divertor target plates as shown by Fig. 1.4(b).
FIG. 1.4 Schematic showing various regimes for the divertor operation.[12] (a) the sheath limited regime - highly localized particle flux, only surface recombination (b) the high recycling regime - radiative cooling due to neutrals and volumetric recombination (c) detachment regime - leading to MARFE instability (d) partial detachment regime - suitable for future machines. (black arrow – plasma flux in the SOL, blue arrows – neutral atoms, red arrows – radiation)
12 | P a g e
1.3.3 Detachment regime and divertor operation in a fusion reactor
The high recycling regime saturates with further increase of the plasma density and the amount of charged particles reaching the divertor falls to negligible levels. This can be inferred by the reduction of the Langmuir probe signals embedded in the divertor plates. The impurities released by the targets, walls or deliberately seeded to enhance the radiation in the divertor volume further reduce the temperature of the plasma by radiative cooling with increasing density. When the temperature of the divertor volume decreases to ~ 1 eV the electrons and ions can recombine to form neutrals volumetrically as shown by Fig. 1.4(b). A positive feedback is realized when these volumetric neutrals along with the recycling neutrals increase the friction with the plasma species, giving sufficient time for the plasma species to recombine, making this process more likely to happen. The neutrals can transport the power and momentum to a broader volume around the divertor since they no longer follow the field lines. This reduces the peak power levels at the strike points, well within the engineering design limits, enhancing the effective lifecycle of the PFCs. This regime is known as the detachment regime. The detachment regime suitably bridges the contradictory requirements for upstream and downstream regions.
Despite the inevitability of the detachment regime, it is often challenging to stabilize the detachment when plasmas become fully detached. The plasma looses its robust boundary conditions imposed by the divertor target (i.e., sink action). Due to cooling of the divertor volume the ionization front (i.e., the region where neutrals ionize) moves upstream towards the X-point. The ionization front in the vicinity of the divertor targets is replaced by volume recombination (i.e. the region where plasma recombines). The neutrals have a long mean free path in such a cold plasma (~ 1 eV), large enough to penetrate into the confined region. The neutral and impurity influx from the detached divertor volume can cause a positive feedback of density increase and radiation enhancement resulting in the
13 | P a g e
thermal instability and eventually the plasma terminates by a radiative collapse or a disruption. The phenomenon leading to thermal instabilities is often accompanied by Multi-faceted Asymmetric Radiation from the Edge (MARFE) as shown by Fig. 1.4(c) and needs to be avoided. Hence a regime termed as a partial detachment regime is favored for the divertor operation of future machines, where the plasma is detached only from the strike points whereas plasma remains attached to the rest of the divertor, in the high recycling regime. This also prevents the onset of a MARFE, eventually stabilizing the partial detachment as depicted by Fig. 1.4(d).
1.4 Motivation and Contribution
Divertor detachment, being such an important operation regime, has been demonstrated on all major tokamaks, such as JET [16], DIII-D [17], CMOD [18], ASDEX-U [19] and JT60-U [20]. Numerous experiments in various devices have demonstrated that the detached divertor (also termed as radiative divertor) plasma can be a solution to this problem by dispersing heat flux to a larger area through impurity radiation [21–24]. The study of detachment has also been carried out on LHD [25, 26] and W7-AS [27, 28]. The radiation from the edge of LHD for various phases of divertor operation has been modeled [25, 26] by EMC3-EIRENE [29, 30]. The radiative divertor regime has also been studied for changing radiation patterns, experimentally by Infrared imaging Video Bolometer (IRVB) [31] and several discrepancy has been observed between the modeling and the experimental results [32, 33]. The motivation of this study is to increase the degree of understanding of underlying physics and improve the quantitative agreement between the experiment and the modeling.
The work reported in this thesis is divided into two major categories. Firstly, the development of a new IRVB for the 6.5-U diagnostic port which is located at the top diagnostic port of the LHD vacuum vessel. This IRVB images the vertically elongated plasma column of LHD and is best suited for studying
14 | P a g e
the spatiotemporal changes taking place in the radiation pattern during the radiative divertor operation. The IRVB used for the 16th LHD experimental cycle was modified by the addition of a periscope, increasing its sensitivity and signal to noise ratio, simultaneously. A new calibration technique for estimating the thermal diffusivity of the IRVB foil material has been introduced. A quantitative estimation of radiated power from the LHD plasma was attempted after establishing the spatial variation of all the thermal and optical properties of the foil material. Several improvements were made to the data analysis technique which improved the confidence in experimental results.
Secondly, an attempt has been made to increase the degree of quantitative agreement between the experiment and modeling. Fig. 1.5 serves as an appetizer, showing the synthetic image obtained from the modeling data and an experimental image from the modified upper port IRVB module. Both the images shows the radiation concentrated towards the inboard side of the torus after the detachment.
FIG. 1.5 A qualitative comparison between the results from modeling and experiment
1.5 Organization of the thesis
This chapter provided a brief overview about the divertor and its operational regimes. Chapter 2 reviews the process of detachment in further detail, gives a brief introduction about LHD and various diagnostic systems and
15 | P a g e
describes the detachment experiments on LHD with relevant observations. Chapter 3 gives a brief introduction about the IRVB diagnostic used to study the radiation during the detachment experiments on LHD and elaborates on its figure of merits and necessity for improvement in its sensitivity. Chapter 4 gives a brief description about the infrared periscope along with the radiometric considerations and evaluation of the optical performance of the periscope. This chapter also compares the experimental data with and without the periscope and justifies the improvement in the signal to noise ratio and the sensitivity improvement with the addition of the periscope. Various calibration techniques, used for determining the thermophysical and optical properties of IRVB foil material, are reviewed in chapter 5 and under the light of their drawbacks, a new photo thermal technique is introduced for determining the thermal diffusivity of the IRVB foil. The merits of this technique are also discussed along with other interesting observations that affect the sensitivity of the IRVB. After improvising the diagnostic sufficiently and having calibrated the IRVB foil, the data analysis procedure needs to be reviewed and validated for confidently quantifying the measured radiation from the plasma using the IRVB in chapter 6. The noise estimates are also reconsidered in chapter 6. The quantified results from the IRVB diagnostic are then compared with the results from the EMC3-EIRINE code in chapter 7 and an attempt is made to improve the correlation between the experiment and modeling by varying the free modeling parameters in the EMC3-EIRINE code. Chapter 8 concludes the thesis with an outlook over the future prospects of this study.
16 | P a g e
References:
[1] UNITED NATIONS DEVELOPMENT PROGRAMME, http://.hdr.undp.org/ [2] P. K. Kaw and I. Bandyopadhyay, Fusion Physics, IAEA Publishing (2012). [3] J. Wesson, Tokamaks, chapter 1.2 p.4-5, Clarendon Press- Oxford, (2004). [4] L. Spitzer, Phys. Fluids, 1-253 (1958).
[5] J. Wesson, Tokamaks, Clarendon Press, Oxford, 2nd edition (1997). [6] www.iter.org
[7] J. Paméla et al., Nuclear Fusion, 43, 1540-1554 (2003). [8] V. S. Chan et al., Nuclear Fusion, 40, 1137, (2000).
[9] M. Wanner et al., Plasma Phys. Control. Fusion, 42, 1179, 2000. [10] A. Iiyoshi et al., Nuclear Fusion, 39, 1245 (1999).
[11] P. C. Stangeby, The plasma boundary of magnetic fusion devices, Institute of physics publishing, Bristol and Philadelphia (2000).
[12] http://www.efda.org/fusion/focus-on/limiters-and-divertors/
[13] C. S. Pitcher and P. C. Stangeby, Plasma Phys. Control. Fusion, 39, 779–930 (1997). [14] ITER Physics Basis. Chapter 4: Power and particle control, Nucl. Fusion, 39, 2391
(1999).
[15] Y. Shimomura, M. Keilhacker, K. Lackner et al., Nucl. Fusion, 23, 869 (1983). [16] A. Loarte et al., Nucl. Fusion, 38, 331 (1998).
[17] M. E. Fenstermacher et al., Plasma Phys. Control. Fusion, 41, A345 (1999). [18] B. Lipschultz et al., J. of Nucl. Mater., 241-243, 771 (1997).
[19] R. Schneider et al. J. of Nucl. Mater., 266-269, 175 (1999). [20] N. Asakura et al., J. of Nucl. Mater., 266-269, 182 (1999). [21] G. F. Matthews, J. Nucl. Mater., 220–222, 104 (1995).
[22] C. S. Pitcher and P. C. Stangeby, Plasma Phys. Control. Fusion, 39, 779 (1997).
17 | P a g e [23] O. Gruber et al., Phys. Rev. Lett., 74, 4217 (1995).
[24] J. Neuhauser et al., Plasma Phys. Control. Fusion, 37, A37 (1995). [25] M. Kobayashi et al., Phys. Plasmas, 17, 056111 (2010).
[26] M. Kobayashi et al., Nucl. Fusion, 53, 093032 (2013). [27] P. Grigull et al., J. Nucl. Mater. 313–316, 1287 (2003). [28] Y. Feng et al., Nucl. Fusion, 45, 89 (2005).
[29] Y. Feng et al., Contrib. Plasma Phys., 44, 57 (2004). [30] D. Reiter et al., Fusion Sci. Technol., 47, 172 (2005). [31] B. J. Peterson, Rev. Sci. Instrum., 71, 3696 (2000). [32] B. J. Peterson et al., J. Nucl. Mater., 415, S1147 (2011). [33] E. A. Drapiko et al., Nucl. Fusion, 51, 073005 (2011).
18 | P a g e
Chapter 2
Divertor detachment scenario
on LHD
Divertor
detachment
scenario on
LHD
2.1 Divertor detachment - a qualitative understanding
2.2 Experimental observations of divertor detachment
2.3 The basic 'Two-Point Model' and divertor
detachment
2.4 A short introduction to LHD
2.5 Magnetic field structure of LHD
2.6 Detachment related observations on LHD
2.6.1 Typical observations about sustained island
assisted detachment
2.6.2 Radiation pattern during the detachment
2.6.3 Effect of island size and location on
detachment stabilization
2.7 Summary
References
20 | P a g e
2.1 Divertor detachment - a qualitative understanding
The previous chapter introduced the word detachment and the journey of the divertor to access the detached regime via several predecessor regimes. The chapter also gave the reasons to support the operation of future machines in detached or partially detached regimes. This chapter intends to give an insight into the detachment phenomenon and also discuss some interesting results regarding the detachment scenario observed on LHD.
The detachment observed on any machine is characterized by the following observations [1].
1) high energy radiation losses from the SOL region (Qrad) [2,3] 2) low plasma temperature near the divertor plates (Td)
3) strong decrease of the plasma particle and energy fluxes onto the plates (Γd) 4) strong plasma pressure drop along magnetic field lines in the divertor
volume
5) relatively high neutral gas density in the divertor volume (Nd)
The detachment regime is in fact a saturated high recycling regime where the recycling neutrals from the divertor supersede the particle source from the core plasma. Hence the plasma flux from the core to the SOL, Γs, is much smaller than the flux from the target, Γd , i.e. Γs /Γd <<1. In such a situation, one can neglect any particle source from the core plasma and consider the SOL region as a "closed box" with a finite number of particles. The only input to the SOL is the energy flux, Qs, from the core. This energy flux is dissipated by various channels, namely, the ionization energy, Eion, required to ionize the recycling neutrals, energy dissipated onto the target plates by charged species, γpTd, where Td is the plasma temperature in front of the target plates and γp=5~8 is the sheath energy transmission coefficient, energy loss due to impurity radiation, Qrad, and energy loss to the walls by neutrals, QN, to name a few.
21 | P a g e
The energy loss due to impurity radiation can be approximated as
( )
2rad imp p p rad
Q n V
(2.1) Where, imp and n are impurity fraction and plasma density respectively and pp rad
V is the radiating volume. Similarly, the energy loss due to the neutrals can be written as
N N w w
Q S NT C
(2.2)where, SN is the area of the target and surrounding wall, N is the neutral density, Tw is the temperature, and Cw is the sound speed near the wall. It can be noted that radiation energy loss is volumetric whereas the neutral energy loss is restricted to the surface. But since both of them are dependent on densities, they will increase with increasing density (explaining point # 1).
The flux from the target, Γd, and these energy losses should satisfy the following energy balance equation in the SOL [1].
( ) / ( ) /
d
Q
sQ
radQ
NE
ion
pT
dQ
sE
ion
(2.3)Now since Qs is almost fixed, the increase in density will result in an increase in Qrad and QN leaving less energy for neutral ionization. Hence, as (Qs - Qrad - QN ) → 0, it is naturally evident that Td will decrease monotonically to zero (explaining point # 2) resulting into the decrease of Γd from Eq. 2.3 (explaining point # 3).
The particle flux from the target can also be expressed as
sin /
d
S n C
t d d S P
t dT
d
(2.4)Where, St is the area of the target, ndis the plasma density, Cd is the sound velocity at the target given byCd Td /M , is the field line angle, M is the ion mass and Pd=ndTd is the plasma pressure. Equating Eq. 2.3 and 2.4 gives
![FIG. 1.3 Schematic of poloidal divertor geometry showing various regions of the plasma [12]](https://thumb-ap.123doks.com/thumbv2/123deta/6159793.103939/29.918.209.715.126.516/schematic-poloidal-divertor-geometry-showing-various-regions-plasma.webp)
![FIG. 1.4 Schematic showing various regimes for the divertor operation. [12] (a) the sheath](https://thumb-ap.123doks.com/thumbv2/123deta/6159793.103939/33.918.151.762.492.934/fig-schematic-showing-various-regimes-divertor-operation-sheath.webp)

![FIG. 2.5 The distribution of connection lengths with and without m/n=1/1 RMP [25]](https://thumb-ap.123doks.com/thumbv2/123deta/6159793.103939/54.918.222.698.276.790/fig-distribution-connection-lengths-m-n-rmp.webp)
![FIG. 2.10 Line averaged density versus the radiation evolution from the resistive bolometer for various perturbation coil currents [25]](https://thumb-ap.123doks.com/thumbv2/123deta/6159793.103939/60.918.248.672.614.1013/averaged-density-radiation-evolution-resistive-bolometer-perturbation-currents.webp)