Study on fueling characteristics of
supersonic gas puffing applied to
large high-temperature plasmas
Akiyoshi Murakami
DOCTOR OF
PHILOSOPHY
Department of Fusion Science
School of Physical Science
The Graduate University for Advanced Studies
2011
i
Acknowledgements
At first, I would like to express my sincere gratitude to my advisers Prof.
Hiroshi Yamada and Dr. Junichi Miyazawa for their guidance, support, and
encouragement over five years of my doctoral course.
I am deeply grateful to Mr. Koji Yasui and Mr. Takanori Murase for
their kind helps and supports in the SSGP installation and the design of
Laval nozzle.
Special thanks to Dr. Tomohiro Morisaki, Dr. Ryuichi Sakamoto, Dr.
Naoki Tamura, Dr. Yoshiro Narushima, Dr. Tsuyoshi Akiyama, Dr. Naoko
Ashikawa, Dr. Hayato Tsuchiya and others for their supports, many useful
suggestions and comments.
My sincere gratitude to previous and present Director General of
National Institute for Fusion Science (NIFS) Prof. Osamu Motojima and
Prof. Akio Komori, respectively. I wish to express my appreciation to all
members of the LHD experimental group, NIFS and the Graduate
University for Advanced Studies (SOKENDAI) staffs for their supports.
Furthermore, I thank Dr.(to be) Kinya Saito, and the other Ph.D students
in NIFS for mutual encouragement, and for sharing hopes and concerns
about the future.
Finally, I am sincerely grateful to my family and friends for their support
and understanding.
This work has been financially supported by the Ministry of Education,
Sports, Culture, Science and Technology, Grants-in-Aid for Scientific
Research (S) 20226018 and NIFS09ULFF006. This work is also supported
by Grant-in-Aid for Japan Society for the Promotion of Science Fellowship
(No. 23-1219).
March, 2012
Akiyoshi Murakami
ii
iii
Abstract
Fueling characteristics of supersonic gas puffing (SSGP) applied to
large high-temperature plasmas have been investigated in the Large Helical
Device (LHD). A fueling efficiency of ~20 % can be achieved in
low-density plasmas and it decreases as the target plasma density increases.
This is due to the fueling mechanism of SSGP, where the fuel particles are
supplied to the plasma edge region and then transported to the core region
by diffusion. The fueling efficiency improves depending on the recycling
condition and/or the edge density condition of the target plasma. Various
phenomena are induced by SSGP, such as the reheat of the plasma stored
energy, the strong edge cooling and the nonlocal transport. The electron
temperature fluctuations related to the MHD instability are induced after
the nonlocal phenomenon. SSGP is also capable of inducing the fast
density modulation externally by using fast pulse train. The convergence of
gas flow plays an important role in these experiments. An effectiveness of a
Laval nozzle in generating the convergent gas flow has been tested by
visualizing the gas flow.
Establishment of fueling methods in future thermonuclear fusion
reactors is one of the critical issues. In a fusion reactor, the role of fueling
device is to supply fuel particles and, consequently, to control the plasma
density profiles. Two major fueling methods have been used in the plasma
experiments. One is the gas puffing that is a conventional method and has
been used since the early period of the fusion plasma study. The
conventional gas puffing has a drawback of low fueling efficiency. The
other is the ice-pellet injection that can effectively increase the density in
the plasma core region. However, the pellet injection device is complicated
compared with the gas puffing device. SSGP has been developed as a new
fueling method that can combine both advantages of the pellet injection and
the conventional gas puffing, i.e., simpleness of the device, high fueling
efficiency, and rapid response. In SSGP, high-pressure gas is ejected
through a fast solenoid valve equipped with the Laval nozzle. SSGP
supplies pulsed convergent gas flow to the plasma.
Before applying SSGP to LHD, the effectiveness of the Laval nozzle
has been tested by visualizing the gas flow. Three methods have been
iv
applied for visualization, i.e., the shadow graph imaging, the emission
imaging using electron beam, and the laser scattering after forming the
cluster beam. The cluster beam is formed by selecting the gas species, or by
cooling the gas using a refrigerator.
As the first step, the cluster beam ejected through the fast solenoid
valve without using the Laval nozzle has been investigated by selecting the
gas species capable of forming the cluster at a room temperature in a test
chamber. Time-resolved 2-D images of Rayleigh scattering from clusters
have been measured by a fast charge coupled device camera. The
expansion half angle of the gas flow without the Laval nozzle was 22.5º.
The scattering signal was proportional to the averaged cluster size and the
number density of clusters. The scattering signals from argon and nitrogen
clusters showed approximately cubic dependence on the backing pressure
as expected from a model. Meanwhile, stronger pressure dependence than
this was found in the case of methane, where the scattering signal increased
with the fifth power of the backing pressure at 3.2 MPa – 7 MPa, and it was
further enhanced at > 7 MPa. This suggests that a new structure model
would be necessary to determine the cluster size of methane, which shows
stronger backing pressure dependence than argon and nitrogen.
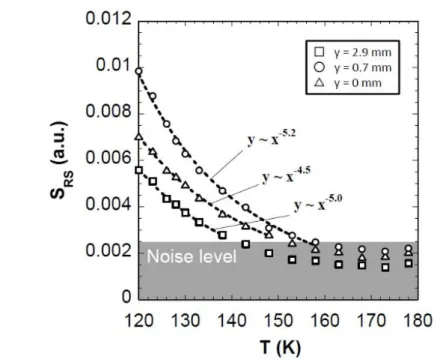
Next, formation of the hydrogen cluster beam using the Laval nozzle
has been investigated at a low-temperature regime ranging from 120 K to
300 K. The Rayleigh scattering signal from hydrogen clusters was detected
when the temperature was lower than 178 K, as expected from a calculation
result of the cluster formation condition. The scattering signal intensity was
inversely proportional to the fifth power of the gas temperature and the
cube of the backing pressure as expected from an available cluster model.
The divergence of cluster beam has been decreased from 22.5 º to ~5 º after
installation of the Laval nozzle.
Based on the test results of the Laval nozzle, fueling characteristics
have been investigated in LHD. Since there is no disruption in LHD, the
edge density can be significantly increased by supplying particles with a
large flow rate. The plasma minor radius of ~0.6 m is much longer than the
penetration depth of neutrals supplied by SSGP, of which the typical order
is mm in LHD. The fueling efficiency of SSGP depends on the target
plasma density and decreases as the density increases. This is due to the
fueling mechanism of SSGP, where the fuel particles are supplied to the
v
plasma edge region and then transported to the core region by diffusion.
SSGP locally supplies a large number of particles to the edge region within
a short time on the order of ms. The fueling efficiency of ~20 % can be
achieved by SSGP, which is more than twice higher than that of ordinary
gas puffing.
Two kinds of improvement in the fueling efficiency of SSGP have
been observed. The fueling efficiency improved suddenly when the target
plasma was close to the density limit. In the case of hydrogen SSGP, abrupt
increase in the density increase rate was observed with the plasma
shrinkage. As a result of this, the fueling efficiency was improved for two
times even though the difference in the number of supplied particles was
less than 20 %. The fueling efficiency also improved when the edge-density
was kept high and a strongly hollow density profile was maintained. The
fueling efficiency of helium SSGP is indeed higher than that of hydrogen
SSGP because of the high recycling property.
SSGP can be also used for physics experiments. For example, the
nonlocal transport phenomenon and electron temperature fluctuations were
triggered by SSGP. After a short-pulse SSGP, the core electron temperature
increased while the edge electron temperature decreased. SSGP triggered a
longer core temperature increase than that triggered by a small impurity
pellet injection. The temperature profile, which was relatively flat inside
the half minor radius before SSGP, becomes parabolic after non-local
transport was triggered. Fluctuations were excited in the electron
temperature signals around the half minor radius. The frequency of these
fluctuations increased from ~400 Hz to ~1 kHz within ~0.1 s and the
amplitude decreased correspondingly. The temperature fluctuations inside
and outside of the half minor radius had opposite phases. Magnetic
fluctuations resonating near the half minor radius were observed
simultaneously with the electron temperature fluctuations.
Fast density modulation experiments using SSGP has been also
carried out in the LHD. The fast density modulation of 50 ~ 200 Hz was
excited by SSGP. High-frequency injection (500 Hz) was confirmed in
preliminary experiments on the test stand. The achieved frequency of 200
Hz is still smaller than that demonstrated in the test stand of 500 Hz. The
optimum flow rate for fast density modulation in LHD was 40 – 200
Pa ·m
3/s. In the case of 50 Hz injection, higher harmonics of up to 200 Hz
vi
was also observed simultaneously.
SSGP has an additional effect of edge cooling that will be beneficial
for divertor heat load reduction. The edge temperature during or just after
SSGP becomes more than 50 % lower than that in the case of conventional
gas puffing, compared at the similar edge density. This strong edge cooling
effect will be beneficial for divertor heat load reduction, which is inevitable
in future fusion reactors, since the low edge temperature enhances the
radiation loss in the ergodic layer and reduces the conduction loss to the
divertor plates.
In conclusion, the fueling efficiency of SSGP is more than twice
higher than that of conventional gas puffing. The fueling efficiency
improves when the target plasma is close to the density limit during SSGP
and the edge-density is kept high and a strongly hollow density profile is
maintained. In plasma physics experiments, SSGP caused various
interesting phenomena by supplying the short convergent gas flow. SSGP is
also available as the fueling method which triggers a variety of plasma
responses by supplying a large numbers of particles in a short time. The
scientific knowledge obtained in this study will be beneficial for future
fusion reactors.
vii
Contents
Acknowledgements
Abstract
1 Introduction
1.1 Fusion study and state of the world 1.2 Fueling system in fusion reactors 1.2.1 Introduction of fueling system
1.2.2 Conventional gas puffing 1.2.3 Pellet injection
1.2.4 Supersonic gas puffing 1.3 Large Helical Device
1.4 Position of SSGP in the world 1.5 Objective of this study
1.6 Outline of this thesis Figures of Chapter 1 Bibliography of Chapter 1
2 Development of supersonic gas puffing 2.1 Theoretical backgrounds
2.1.1 Theory of supersonic gas flow 2.1.2 Design of Laval nozzle
2.1.3 Visualizing of supersonic gas flow and cluster theory Figures of section of 2.1
2.2 Characteristics of solenoid valve 2.2.1 Mechanism of solenoid valves
viii
2.3.4 Pressure dependence of scattering signal Figures of section of 2.3
2.4 Shadow graph imaging and emission imaging using electron beam 2.4.1 Shadow graph imaging
2.4.2 Emission imaging using electron beam Figures of section of 2.4
2.5 Installation of SSGP device in LHD Figures of section of 2.5
2.6 Summary
Bibliography of Chapter 2
3 Fueling characteristics of supersonic gas puffing 3.1 Introduction
3.2 Typical responses of the plasma to SSGP 3.3 Fueling efficiency of SSGP
3.3.1 Differentiated fueling efficiency 3.3.2 Total fueling efficiency
3.4 Improved Laval Nozzle
3.5 Improvement in the Fueling Efficiency 3.5.1 Reheat after SSGP
3.5.2 Helium SSGP 3.6 Summary
Figures of Chapter 3 Bibliography of Chapter 3
4 Plasma physics experiments using SSGP 4.1 Introduction
4.2 Reheat discharge using SSGP 4.3 Edge cooling effect
4.4 Non-local transport phenomena triggered by SSGP 4.4.1 Non-local transport phenomenon
4.4.2 Non-local transport phenomenon triggered by SSGP 4.4.3 Observation of temperature fluctuation
4.4.4 Rotating magnetic structure and the temperature fluctuation 4.4.5 Summary of non-local transport and fluctuations
4.5 Fast density modulation
42 43 49 49 49 51 54 56 59 60 61 61 63 64 64 65 66 67 68 68 69 71 78 79 79 80 81 82 82 82 85 85 86 87
ix
4.5.1 Density modulation 4.5.2 Test results
4.5.3 Fast density modulation experiments 4.5.4 ELM mitigation using SSGP
4.6 Fueling to the long pulse plasma discharge using ICRF heating 4.7 Summary
Figures of Chapter 4 Bibliography of Chapter 4
5 Summary and conclusion
Appendix
x
1
Chapter 1
Introduction
1.1 Fusion study and state of the world
A movement against the nuclear power plants has been invoked by a nuclear accident on Fukushima Daiichi Nuclear Power Station after the east Japan earthquake occurred on March 11, 2011. The nuclear power had accounted for 30% of the energy source in Japan before the accident. This is due to the policy that had been taken to reduce the risk of oil shortage after twice oil shocks in 1970s. In terms of energy balance, Japanese government should have kept a variety of energy sources. As a result, the nuclear energy was promoted in Japan. Japanese nuclear industries have been evolved to the leading industries in the world. However, Japanese energy policy after the east Japan earthquake is reaching a turning point.
It is expected that the world population will reach 9.3 billion at 2050s [1]. The countries of most increase in the Gross Domestic Product (GDP) at 2050s are China, India, Brazil and Russia which are called “BRICS”. These countries will economically develop significantly in a future. Energy is absolutely essential for economic activities. When large economic activities develop in these countries of large population, it will become necessary for human beings to use more energy than now.
2
There are various energy sources. The most popular energy source is the fossil fuels, such as coal, oil and natural gas. In the case of energy from fossil fuel, depletion is of special concern. In a future expected of the increase of population and economic activity, the energy from fossil fuels will not be sufficient for supplying all of the energy demands. The price of energy from fossil fuel also will increase more and more. In the case of renewable energy sources such as solar and wind power, the stable power cannot be supplied because of the weather. Unstable electric power is fatal for manufacturing factories. An energy source that can produce a lot of energy is the nuclear power. There are two methods to produce the nuclear power. One is fission in which the nucleus of an atom is split releasing a large amount of energy. The other is fusion in which the nuclei of atoms are combined to form a heavier nucleus, with energy being released. Nuclear power has an advantage of producing huge stable power. However, in the case of fission plants, there is a safety problem as mentioned. One of the most difficult problems is how to manage high-level radioactive wastes from fission power plants. We must control these high-level radioactive wastes for over tens of thousands of years.
Nuclear fusion is more safety than nuclear fission because there are no nuclear chain reactions in nuclear fusion. In fusion reactions, the runaway reactions will not cause in principle. The deuterium-tritium (D-T) reaction is selected for thermo-nuclear fusion because of its large cross section [2]. The reaction occurs as follows,
) MeV 14 ( n ) MeV 5 . 3 ( He T
D+ → 4 + . (1.1)
Deuterium exists in sea and tritium will be bred in the process of the n-L reaction. If a fusion reactor realizes, the energy problem in the world might be solved. Fusion study started at 1950s. Many fusion experiments have been carried out in the world. International Thermonuclear Experimental Reactor (ITER) has been under construction at Cadarache, France in order to demonstrate the possibility of fusion reactor [3]. In ITER, D-T reaction will be occurred and it will be aimed that it takes out ten times larger energy compared with input power.
In conclusion, fusion study has to be promoted for future human beings by global
3
cooperation in order to take out energy from nuclear fusion.
1.2 Fueling system in fusion reactors
1.2.1 Introduction of fueling system
Establishment of fueling methods is one of the critical issues for the realization of a fusion reactor. There are four control factors of heat and particle transport in fusion plasmas. Those are a fueling system, a heating system, an exhaust system, and a heat removal system (See Fig. 1.1). Firstly, the fueling system supplies particles to fusion plasmas. As shown in Eq. (1.1), deuterium and tritium have to be continuously supplied to the plasma in fusion reactors. Secondly, the heating system heats the plasma to a temperature needed for nuclear fusion reactions. In current plasma experiment, neutral beam injection, ion cyclotron heating, and electron cyclotron heating are mainly used as the heating system. Thirdly, the exhaust system removes unnecessary particles. After nuclear fusion reactions, helium particles (alpha-particles) are generated, as also shown in Eq. (1.1). The alpha particles heat the plasma in the fusion reactor. After that, these particles become helium ash. Helium ash has to be removed otherwise the plasma temperature will decrease due to enhanced radiation loss. In the exhaust system called
“divertor”, the magnetic field lines are connected to the divertor plate and those particles are exhausted. Finally, the heat removal system removes heat from the fusion plasma. The divertor system is also used as the heat removal system. Heat from neutron after nuclear fusion reactions is taken out as energy by the system called “blanket” located on first wall of a vacuum vessel. The blanket system will play another role in breeding of tritium from reactions between lithium and neutron.
Especially, since the alpha heating is dominant in the fusion plasma as previously described, the only active control factor is the fueling system. In addition, in order to obtain the fusion power continuously, the steady state plasma is required in fusion
4
reactors. In steady state plasma, the density control is fairly important. Recent results of particle control in the high temperature tokamak plasma were reported in JT- 60U, ASDEX-U and JET [4-6]. The role of fueling system is to supply fuel particles and, consequently, to control the plasma density profile.
In conclusion, the fueling system will be essential for the fusion plasma control and therefore development of effective fueling methods has been one of the key issues in the fusion study.
Conventionally, two fueling methods of a gas puffing system and a pellet injection have been studied for a long time. The conventional gas puffing (GP) and the pellet injection (PI) system are described in the following. A brief exposition of supersonic gas puffing (SSGP) is also given.
1.2.2 Conventional gas puffing (GP)
The conventional gas puffing (GP), in which fuel gas is ejected into the vacuum vessel and supplied to the edge plasma, has been used since early fusion plasma experiments. Piezo electric valves are often used in the conventional gas puffing. A piezo valve is available in a magnetic field. The maximum backing pressure is limited to less than ~0.6 MPa and the order of the minimum pulse length is ~1 ms. The conventional gas puffing has a drawback of low fueling efficiency. Especially in large plasmas, most of the particles supplied by gas puffing are ionized outside of the plasma confinement region. As a result, the fueling efficiency is as low as ~10 % [7, 8]. In tokamaks, shielding of fuel particle was observed in the case of conventional gas puffing [9].
1.2.3 Pellet injection (PI)
The ice-pellet injection (PI) is considered as a favorable method to refuel magnetically confined plasmas [10]. Hydrogen gas is cooled by a refrigerator to ~10 K
5
to form small ice pellets. The pellet is injected to plasma at a velocity of ~1000 m/s. PI is characterized by the high fueling efficiency reaching 100 % and can effectively increase the density in the plasma core region. From the point of view of the time response, the density increases within the duration of the pellet ablation of less than 1 ms in the case of PI, while the typical time constant of density control by GP is similar to the particle confinement time. Using the pellet injection, improved particle and energy confinement properties have been demonstrated in LHD [11]. In LHD, a super dense core plasma develops when a series of pellets are injected [12]. High-density steady state operation has also been demonstrated in LHD [13]. However, the pellet injection device itself is complicated compared with a gas puff device and still has demanding technological issues for a fusion reactor.
1.2.4 Supersonic gas puffing (SSGP)
Supersonic gas puffing (SSGP) has been developed as a new fueling method that can combine both advantages of the pellet injection and the conventional gas puffing, i.e., simpleness of the device, high fueling efficiency, and rapid response [14,15]. In SSGP, high-pressure gas is ejected through a fast solenoid valve equipped with a Laval nozzle. SSGP supplies pulsed convergent gas flow to the plasma. In this study, fueling characteristics of SSGP applied to large high-temperature plasmas and the plasma physics experiments using SSGP are described. Detailed explanations of the SSGP device are described in Chapter 2.
1.3 Large Helical Device
In this study, SSGP has been applied to the large high-temperature plasma on Large Helical Device (LHD) in National Institute for Fusion Science (NIFS). Figure 1.2 shows the bird’s-eye view of LHD.
6
In a magnetic confinement fusion study, there are two major methods to maintain plasmas. One is a device called “tokamak”, which is devised by Russian researchers in the 1960s. In tokamak devices, the electric current is driven in the plasma to form magnetic fields for plasma confinement. Tokamak has been the top runner in the fusion research. Highest ion temperature of 520 million degrees centigrade was achieved in JT-60U tokamak. ITER is also a tokamak device. However, plasma collapse phenomenon called “disruption” is observed in tokamak [16]. Disruptions occur suddenly and damage the vacuum vessel. This phenomenon is weakpoint of the tokamak as a fusion reactor. On the other hand, the other method of stellarator device is devised by Dr. Spizer in 1950s. One of the merits of a stellarator device is not to require the plasma current. The helical device is an improved version of the stellarator device. The confinement magnetic fields are produced by external coils alone. There is no disruption in the helical device. Therefore, as a nuclear fusion reactor, helical device has an advantage in steady state operation.
LHD is the world’s-largest superconducting helical device where nested magnetic surfaces are generated by a pair of continuously wound helical coil and three pairs of planar poloidal coils [17,18]. The major radius, R, can be adjusted from 3.5 m to 3.9 m. The minor radius, a, is ~0.6 m. The volume of the vacuum vessel is ~200 m3. The typical plasma volume, Vp is ~30 m3 in the standard configuration of R = 3.6 m. The magnetic field strength on the plasma axis, Bt, is up to 3 T. A steady state operation has been demonstrated in LHD [19].
Three heating systems of electron cyclotron heating (ECH) [20], ion cyclotron heating (ICH) [21,22] and neutral beam injection (NBI) [23] have been employed in LHD. There are three negative-ion-based tangential neutral beam injectors and two positive-ion-based vertical neutral beam injectors. In this study, the plasma was mainly heated by three negative-ion-based tangential neutral beam injectors. The total heating power of neutral beam injectors was up to 14 MW.
Many plasma measurement systems have been installed on LHD. The plasma
7
characteristics after SSGP are analyzed by electron density profiles measured by a Thomson scattering system [24,25]. The Thomson scattering system is installed on a horizontally elongated section in LHD. The line-averaged density is measured by a FIR laser interferometer [26].
The conventional gas puffing systems has been installed on 3.5-L, 5.5-L 9.5-L and 6-I port in LHD [27]. The gas flow rate of the conventional gas puffing is selectable from 1 to 100 Pa·m3/s. Ordinary gas species of gas puffing is hydrogen. Other gas species of helium, nitrogen, neon and argon are used in some experiment conditions. Although the fueling efficiency is low, gas puffing is mainly used in the experiment as the most reliable fueling method. The pellet injection system is installed on 4-O port in LHD. The position of SSGP is 3.5-L port. The gas flow is upward and the distance from valves to plasma is ~4 m.
1.4 Position of SSGP in the world
There are many methods similar to SSGP in the world plasma devices as described below.
SMBI in HL-2A
Supersonic molecular beam injection (SMBI) has been installed on HL-2A tokamak (Plasma volume, Vp ~ 5.2 m3). Prof. Yao started to develop supersonic molecular beam injection (SMBI) on HL-1M for the first time [28-31]. Two type SMBIs (high- and low- filed side injections) have been installed on HL-2A. The valve for LFS SMBI is an electro-magnetic valve, which is the same type used for SSGP in LHD. On the other hand, the valve for HFS SMBI is a pneumatic valve, which is the same type used in Tore Supra [30]. The distance from plasma to LFS nozzle is ~1.28 m. The fueling efficiency of both SMBIs, which is defined as the ratio
8
of the increment of the plasma content divided by the number of injected particles, was 30 ~ 60 %. The fuelling efficiency of HFS SMBI is higher than that of LFS SMBI. It was also reported that H-mode was triggered by SMBI instead of pellet injection in HL-2A [32]. Recently, a conic nozzle with a diameter of 0.5 mm and half angle of 8º is installed on the valve of LFS SMBI [33].
SPGI in Tore Supra
Supersonic pulsed gas injection (SPGI) has been installed on Tore Supra tokamak (Vp ~ 25 m3) [34,35]. The fueling efficiency of SPGI, which was derived from interferometer measurements, was 30 ~ 50 % in the limiter discharges. The fueling efficiency from the LFS tends to be better than that from the HFS. The fueling efficiency in the divertor discharges is lower than that in the limiter discharges. The edge cooling effect of SPGI has been observed in Tore Supra. It was revealed that SPGI reduced wall inventory compared to a similar conventional gas puffing in one long pulse discharge.
SMBI in JT-60U
SMBI was installed on JT-60U tokamak (Vp ~ 80 m3) [36,37]. The SMBI system in JT-60U is the same as that used in Tore supra. It was revealed that a fueling efficiency of SMBI exhibited a week dependence on the backing pressure and injection direction (high- and low-side injections). The backing pressure is 0.2 ~ 0.6 MPa. The injection frequency is less than 10 Hz and the pulse length of one pulse is
~2 ms. It was also reported that the fueling efficiency defined as a ratio of increase in the total electron number to the injected electron number was estimated to be
~20% when it was assumed that the density increases uniformly in the whole plasma and ~50 % when it was assumed that the density increases only in the peripheral region (r/a = 0.96 – 1.0). The fueling efficiency of SMBI was higher than that of GP. The plasma response for SMBI was also faster than that for GP.
9
SMBI in Heliotron J
SMBI has been installed on Heliotron J (Vp ~ 0.7 m3) [38,39]. Heliotron J is a helical type device. It was reported that the fueling efficiency is estimated to be about 50 – 60 % for NBI and 20 – 30 % for ECH + NBI discharges at ne~ 1
10
maximum amount of particles supplied by SSGP in LHD is ~ 13.6 Pam3/pulse (#108184) while that of SMBI in JT-60U is 1.5 Pam3/pulse [6]. Since the plasma volume of LHD is larger than that of Heliotron J, the fueling characteristics of SSGP applied to large helical plasma are able to be investigated in this study.
1.5 Objective of this study
Establishment of fueling methods is one of the critical issues for the realization of a fusion reactor. Two fueling methods of gas puffing and pellet injection have been studied for a long time. The objective of this study is to investigate fueling characteristics of SSGP applied to large high-temperature helical plasmas in LHD.
Since detailed radial profiles can be measured in LHD, the fueling characteristics can be studied based on the analysis of electron density profile data.
In addition, various phenomena are induced by SSGP, such as the reheat of the plasma stored energy, the strong edge cooling and the nonlocal transport. The electron temperature fluctuations related to the MHD instability are induced after the nonlocal phenomenon. SSGP is also capable of inducing the fast density modulation externally by using fast pulse train. These plasma physics experiments using SSGP are also discussed in this study.
The convergence of gas flow plays an important role in these experiments. An effectiveness of a Laval nozzle in generating the convergent gas flow has been tested by visualizing the gas flow. Three methods have been applied for visualization, i.e., the shadow graph imaging, the emission imaging using electron beam, and the laser scattering after forming the cluster beam. The convergences of gas flow with and without the Laval nozzle have been investigated using these methods. As a result, the effectiveness of the Laval nozzle has been revealed in this study.
11
1.6 Outline of this thesis
After introducing the first chapter (this chapter), Chapter 2 describes the basic physics of supersonic gas puffing, and the experiments results on convergence of supersonic gas flow or cluster beam. The fueling characteristics of SSGP applied to large high-temperature plasma in LHD are discussed in Chapter 3. In Chapter 4, the results of plasma physics experiments using SSGP are presented. Finally, the summary and conclusions are given in Chapter 5.
12
Fig. 1.1 Schematic view of heat and particles controls in fusion DEMO
reactor. Images of three fueling methods are also shown.
Fig. 1.2 Bird’s-eye view of LHD [44]. LHD is the world’s-largest
superconducting heliotron device.
13
Bibliography of Chapter 1
[1] UN, World Population Prospects: The 2010 Revision, http://esa.un.org/unpd/w pp/Excel-Data/population.htm.
[2] R. D. Hazelitine and J. D. Meiss, “Plasma Confinement” Chapter 1.3 p.3 Addison-weslet publishing company. (1992).
[3] ITER project http://www.iter.org/.
[4] H. Takenaga et al., J. Nucl. Mater. 390-391, 869 (2009). [5] C. Angioni et al., Phys. Rev. Lett. 90, 205003 (2003).
[6] H. Weisen et al., Plasma Phys. Control. Fusion 48, A457 (2006). [7] J. Miyazawa et al., Nucl. Fusion 44, 154 (2004).
[8] J. Miyazawa et al., J. Nucl. Mater. 313-316, 534 (2003). [9] B. J. D. Tubbingb et al., Nucl. Fusion 32, 967 (1992). [10] C. A. Foster et al., Nucl. Fusion 17, 1067 (1977). [11] R. Sakamoto et al., Nucl. Fusion 41, 381 (2001). [12] N. Ohyabu et al., Phys. Rev. Lett. 97, 055002 (2006). [13] R. Sakamoto et al., Nucl. Fusion 46, 884 (2006).
[14] A. Murakami et al., Plasma Fusion Res. 5, S1032 (2010).
[15] A. Murakami et al., J. Plasma Fusion Res. SERIES 9, 979 (2010).
[16] John Wesson, “Tokamaks”, Chapter 7.7, p. 374, Clarendon Press – Oxford, (2004).
[17] A. Iiyoshi et al., Nucl. Fusion 39, 1245 (1999). [18] O. Motojima et al., Phys. Plasmas 6, 1843 (1999). [19] Y. Yoshimura et al., J. Phys. Conf. Ser. 25, 189 (2005). [20] T. Shimozuma et al., Fusion Eng. Des. 53, 525 (2001). [21] T. Mutoh et al., Phys. Rev. Lett. 85, 4530 (2000). [22] T. Watari et al., Nucl. Fusion 41, 325 (2001).
[23] Y. Takeiri et al., Rev. Sci. Instrum. 70, 4260 (1999).
14
[24] K. Narihara et al., Rev. Sci. Instrum. 72, 1122 (2001). [25] I. Yamada et al., Fusion Sci. Tech 58, 345 (2010).
[26] K. Kawahata et al., Rev. Sci. Instrum. 70, 707 (1999). [27] J. Miyazawa et al., Fusion Eng. Des. 83, 265 (2008). [28] L. Yao et al., Nucl. Fusion 38, 631 (1998).
[29] L. Yao et al., Nucl. Fusion 41, 817 (2001). [30] L. Yao et al., Nucl. Fusion 44, 420 (2004). [31] L. Yao et al., Nucl. Fusion 47, 1399 (2007).
[32] X. R. Duan et al., Nucl. Fusion 50, 095011 (2010).
[33] C. Y. Chen et al., J. Plasma Fusion Res. SERIES 9, 37 (2010). [34] B. Pegourie et al., J. Nucl. Mater. 313-316, 539 (2003).
[35] J. Bucalossi et al., 19th IAEA conf. Lyon, WX/P4-04, (2002). [36] H. Takenaga et al., Nucl. Fusion 49, 075012 (2009).
[37] H. Takenaga et al., Nucl. Fusion 50, 115003 (2010).
[38] T. Mizuuchi et al., Contrib. Plasma Phys. 50, NO.6-7, 639 (2010). [39] T. Mizuuchi et al., J. Nucl. Materials 415, S443 (2011).
[40] J. Bucalossi et al., Proc. 31st EPS Conference on Plasma phys. London, ECA 28G P-4. 115 (2004).
[41] P. T. Lang et al., Plasma Phys. Control. Fusion 47, 1495 (2005). [42] V. A. Soukhanovskii et al., Rev. Sci. Instrum. 75, 4320 (2004).
[43] V. A. Soukhanovskii et al., Proc. 35th EPS Conference on plasma phys. Greece, P2. 109 (2008).
[44] NIFS HP, http://www.lhd.nifs.ac.jp/lhd/limit/cad/LHD_cut/PE423.JPG.
Chapter 2 Development of supersonic gas puffing
15
Chapter 2
Development of supersonic gas puffing
2.1 Theoretical backgrounds
2.1.1 Theory of supersonic gas flow
Supersonic gas flow is generated from a “Laval nozzle”. In this section, the theory of supersonic gas flow is described.
The stream-tube, where the cross section area A to vary with distance x, is assumed, as illustrated in Fig. 2.1. The steady flow, where the cross section area, A, the pressure, p, the density, nf, and the velocity, v are functions of x only, is defined as quasi-one-dimensional flow. One the other hand, in the case of one-dimensional flow that is treated as strictly constant-area flow, three physical mechanisms, such as a normal shock, heat addition and/or friction, cause the flow properties to change with x even though the area constant [1]. Although the actual physical flow through the variable-area duct is three-dimensional, in the case of quasi-one-dimensional flow, the flow properties described as a function of x. This is due to assuming that the flow properties are uniform across any given cross section of area A. The quasi-one- dimensional flow is an approximation to the actual physics of the flow.
Chapter 2 Development of supersonic gas puffing
16
The continuity equation for steady quasi-one-dimensional flow is derived from the integrated calculation over the control volume, as follows,
⋅ =∂∂
−
V S
dV t n
d
nfV S f , (2.1) when integrated over the control volume in Fig. 2.1 leads, for steady flow, directly to
Chapter 2 Development of supersonic gas puffing
17
Expanding Eq. (2.4), and multiplying by v,
f 0
2 f
2
fv dA+nvAdv+Av dn =
n . (2.9)
Subtracting this equation from Eq. (2.8), we obtain vdv
n
dp=− f . (2.10) From Eq. (2.4),
0
f
f + + =
A dA v dv n dn
.
(2.11)
To eliminatednf nf from Eq. (2.11), consider Eq. (2.10) n vdv
dn dn
dp n
dn = =−
f f f f
f
.
(2.12)
There are no dissipative mechanisms such as friction, thermal conduction, or diffusion acting on the flow. Thus, the flow is isentropic. Hence, any change in pressure, dp, in the flow is accompanied by a corresponding isentropic change in density,dnf. Therefore, we can write,
2 s f
f
n v p dn
dp
s
=
∂
= ∂
,
(2.13)
where vs is the sound speed. Eq. (2.13) is a fundamental expression for the speed of sound. Combining Eqs. (2.12) and (2.13),
n vdv v dn =−
f 2 f s
,
v M dv v
v dv v v
vdv n
dn 2
2 s 2 2
f s
f =− =− =−
,
Chapter 2 Development of supersonic gas puffing
18
This equation is called the area-velocity relation and significant equation. It tells us this information:
1. M →0 (Incompressible flow)
v dv A
dA=− . const Av = .
This is the familiar continuity equation for incompressible flow.
2. 0≤ M ≤1 (Subsonic flow)
(
0)
>
−
= C
v Cdv A dA
. 0 0
0 0
>
<
<
>
dv dA
dv dA
.
The velocity increases in a converging duct and decreases in a diverging duct.
3. M >1 (Supersonic flow)
(
0)
>
= C
v Cdv A dA
. 0 0
0 0
<
<
>
>
dv dA
dv dA
.
The velocity increases in a diverging duct and decreases in a converging duct.
4. M =1 (Sonic flow)
0 A = dA
.
From the above results, the flow with the speed of the subsonic becomes supersonic speed flow when the flow passes through a minimum radius of the area which is called throat. In contrast, the supersonic flow becomes the subsonic flow when the flow passes through the throat (See Fig. 2.3). That is, in order to obtain the supersonic speed, it is necessary to pass through the throat. “Laval nozzle” is the nozzle to achieve supersonic flow using this property.
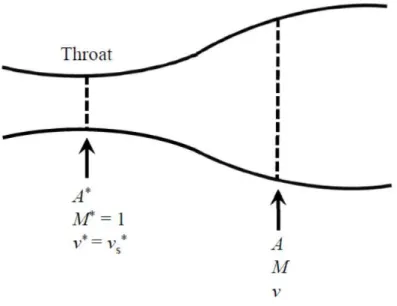
Next, a relation equation of the area and Mach number in nozzle is shown as follows. Consider the duct shown in Fig. 2.4. At the throat, the flow is sonic. Hence,
Chapter 2 Development of supersonic gas puffing
19
denoting conditions at sonic speed by an asterisk, we have M* = 1 and v* = vs* at the throat. The area of the throat is A*. At any other section of the duct, the local area, Mach number, and velocity are A, M, and v, respectively. Apply Eq. (2.2) between these two locations:
vA n A v
n*f * *= f (2.16) Since v* = vs*, Eq. (2.16) becomes
v v n n n
n v v n n A
A s*
f f0 f0
* f
* s f
* f
* = = , (2.17) where nf0 is the stagnation density,n =f0 ps/RGTs, and is constant throughout the isentropic flow. The ratio of total to static density at a point in the flow as a function of Μach number M at that point is given as follows [2],
( 1)
1 2
f f0
2 1 1
−
−
+
= γ γ
n M
n , (2.18)
and apply this to sonic conditions, we have
( 1)
1
* f f0
2
1 −
= + γ γ
n
n . (2.19)
Also, by definition, and from a direct relation between the actual Mach number M and the characteristics Mach number M*,
2 2 2
* 2
* s
2 1 1
2 1
M M v M
v
+ − +
=
=
γ γ
.
(2.20)
Squaring Eq. (2.17), and substituting Eqs. (2.18), (2.19), and (2.20), we have
* 2 s 2
f f0 2
f0
* f 2
*
=
v v n n n
n A
A
,
( ) ( )
+ + −
−
+
= +
− −
2 1 2
2 2 1
2 2
*
2 1 2 1 1 2
1 1 1
2
M M A M
A
γ γ γ
γ
γ γ
,
Chapter 2 Development of supersonic gas puffing
20
( 1) (2 1)
2
* 2
1 1 1 2
1 + −
−
+ +
=
γ
γ γ
γ M
M A
A
.
(2.21)
Equation (2.21) is called the area-Mach number relation. The Mach number at any location in the duct is a function of the ratio of the local duct area to the sonic throat area.
2.1.2 Design of Laval nozzle
Our Laval nozzles were designed referring NACA technical note [3]. Especially, a part of method of Foelsch was used in this design. Design of Laval nozzle is divided into three sections. First section is upstream of the throat. This section is arbitrary curved line. Other two sections are important for the Laval nozzle. Second section is called expansion section where expansion wave is generated and propagate across the flow downstream reflecting from the opposite wall. Third section is called straightening section where all the expansion waves generated by the expansion section are canceled. The point of junction of the expansion section and straightening section is called a
“inflection point”. The angle of the duct wall at inflection point is largest in the all section of the Laval nozzle. (See Fig. 2.5)
Before design, the diameter of throat, d, the Mach number of the design value, Mt and the angle of the inflection point, θ1 were determined. Typical design parameters of Laval nozzle for SSGP are d =0.3 mm, Mt = 8 and θ1 = 12º, respectively.
Firstly, the design of the expansion section is described. Although the curve line of the expansion section is also arbitrary, the coordinate at inflection point, (x1, y1), have to be determined. The cross section area at the throat, A* is πy*2, where y* denotes the radius of throat. The streamline through (x1, y1) is radial surface. The cross section area of the radial surface, A1, is as follows,
(
1)
2 1
1 =2πr 1−cosθ
A (2.22) From Fig. 2.6,
Chapter 2 Development of supersonic gas puffing
21
1 1
1sin y
r θ = , (2.23)
(
1)
2
* 2 1
*
1 =2 1−cosθ
y r A
A . (2.24)
Hence,
(
1)
1 2
*
* 1
1 21 cos
sin θ θ
= − A y A
y
Chapter 2 Development of supersonic gas puffing
22
− +
=
1 2
1 1
*
1 3 tan
x x x
y x
y θ . (2.28)
Substituting (x, y) = (x1, y1) to Eq. (2.28) and solving the equation for x1,
( )
1
* 1
1 2 tan
3 θ
y
x = y − . (2.29)
This is the x-coordinate of the inflection point.
Next, the design of straightening section is shown as follows. The assumptions of this method, or rather its boundary conditions, may be variously stated:
(1) Along the Mach line emanating from the inflection point, the velocity vectors are co-original,
(2) the Mach number is constant along the arc of the circle which passes through the inflection point of the wall perpendicularly (and obviously its center is the origin of the velocity vectors),
(3) in the region between this arc and the Mach line from the inflection point, the Mach number is a function solely of the radius from the vector origin.
The radius of vector at the throat, r* is as follows,
1 1
*
* r
A
r = A . (2.23)
The minim step of the Mach number is determined as the step number of 500, 500
M1
M = Mt−
Δ , (2.24) where Mt is the Mach number of the design value. The angle at the point of P is estimated from next equation, substituting the Mach number,
2 ) (M v vt −
θ = . (2.25) The relation is given by continuity equation from Fig. 2.7, as follows
(
1) [ (
0) (
0) ]
02 cos cos sin sin cos sin sin
2πr θ − θ =π l θ +α +r θ + r+l α θ l α , (2.26) where α0 is the Mach angle at the point P. The left-hand side of this equation means the
Chapter 2 Development of supersonic gas puffing
23
area formed by the arc between the points of P and P’. In contrast, the right-hand side of this equation means the area of side of the circular truncated cone, where the side surface is formed by the points of Q and Q’. This equation can be solved for the length between the points of P and Q, l, as follows,
( )
( ))) sin( sin sin sin cos ( 2
) sin( sin sin sin cos cos
2 cos 2 4 sin sin 4 sin sin 2
0 0 0
0
0 0 0
0 1
2 2
2 0 2 2 0
θ α α θ α α
θ α α θ α α θ
θ θ
α θ
α
+
−
−
+
−
−
−
−
= r − r r r
l
(2.27) The coordinate, (x, y), in straightening section are determined by l,
) cos (
) cos(
cosθ l θ α0 x1 r1 θ1 r
x= + + + − (2.28)
θ α
θ ) sin
sin( 0 r
l
y= + + (2.29) This is the points of the straightening section. We have to calculate until the end of exit hole of Laval nozzle. At the inflection point, the length of l needs to be the minimum value.
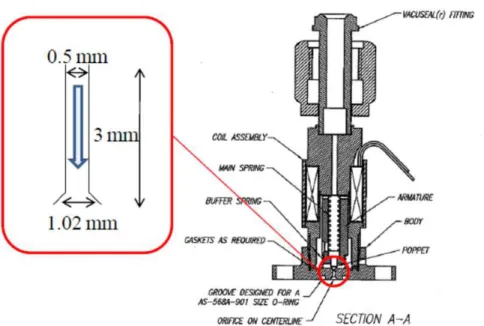
Figure 2.8 shows cross sections of the three Laval nozzles of 0.1, 0.3 and 0.6 mm throat diameter designed for the SSGP device. These nozzles are similarly designed to generate a gas flow of Mt = 8 and the inflection angle of 12º. Figure 2.9 shows an image of Laval nozzle of 0.3 mm throat diameter. An improved Laval nozzle is described in the section 2.5 and 3.4.
2.1.3 Visualizing of supersonic gas flow and cluster theory
Before applying SSGP to LHD, the effectiveness of the Laval nozzle has been tested by visualizing the gas flow. Three methods have been applied for visualization, i.e., the shadow graph imaging, the emission imaging using electron beam, and the laser scattering after forming the cluster beam.
The cluster beam is formed by selecting the gas species, or by cooling the gas using a refrigerator. Physics of cluster formation by gas jet has been studied since 1956
Chapter 2 Development of supersonic gas puffing
24
[4]. A cluster beam for fusion research was studied firstly as the source of plasma heating in the 1970s [5]. Cluster jet injection (CJI) comes to the front again in recent study of fueling [6]. The CJI, where liquid nitrogen of 77 K is used for gas cooling, has been developed for HL-2A. Supersonic gas injector (SGI) has been developed for NSTX, where a Laval nozzle is used to generate supersonic gas jet [7].
There is no established theory to predict the cluster size in a free jet expansion. Nevertheless, it has been shown that the condition to produce clusters can be described by an empirical scaling parameter Г* that is proportional to a so-called “Hagena parameter”, k [8, 9]
( )
29 0 . 2 0
85 . 0
* /tan
P T
k d α
=
Γ (2.30)
where d is the nozzle diameter in µm, α is the expansion half angle (α = 45° for the sonic case, α < 45° for the supersonic case), P0 is the backing plenum pressure in 10-4 MPa, and T0 is the pre-expansion temperature in Kelvin. Massive condensation, where the cluster size exceeds 100 atoms/cluster, is generally observed for Г* > 1000 [8, 9].
The parameter Г* as a function of the gas temperature is shown in Fig. 2.10, where d = 500 µm, α = 45°, and P0 = 4 MPa are assumed, respectively. The nozzle diameter of d = 500 µm is equal to that of the solenoid valve used in next section study. In this calculation, species-dependent k of 184, 3.85, 2360, 528, 185, and 1650 are used for H2, He, CH4, N2, Ne, and Ar, respectively [8]. The result implies that the gasses except He are expected to form clusters at a room temperature.
Characteristics of cluster beam ejected from the solenoid valve without the Laval nozzle is described in Section 2.2. In section 2.3, results of the H2 cluster jet using the Laval nozzle of 0.3 mm throat diameter for SSGP are described. The convergence of gas flow from the Laval nozzle is discussed using results of the shadow graph imaging and the emission imaging using electron beam in section 2.4. Installation of SSGP device in LHD is shown in section 2.5. Finally, these are summarized in section 2.6.
Chapter 2 Development of supersonic gas puffing
25
Fig. 2.1 The model of quasi-one-dimensional flow.
Fig. 2.2 Incremental volume.
Chapter 2 Development of supersonic gas puffing
26
Fig. 2.3 Flow in a convergent-divergent duct.
Fig. 2.4 Geometry for derivation of the area Mach number relation.
Chapter 2 Development of supersonic gas puffing
27
Fig. 2.6 Design of expansion section.
Fig. 2.5 Sketch of Laval nozzle.
Chapter 2 Development of supersonic gas puffing
28
Fig. 2.7 Design of straightening section.
Fig. 2.8 Cross sections of the three Laval nozzles installed in the
SSGP device. These nozzles are similarly designed to
generate a gas flow of M
t= 8.
Chapter 2 Development of supersonic gas puffing
29
Fig. 2.9 Image of Laval nozzle with 0.3 mm throat diameter.
Fig. 2.10 Calculated results of the scaling parameter Г
*, where d =
500 µm,
α = 45°, P0 = 4 MPa. The gasses except heliumsatisfy the condition for massive condensation of Г
*> 1000
at room temperature (293 K).
Chapter 2 Development of supersonic gas puffing
30
2.2 Characteristics of solenoid valve
2.2.1 Mechanism of solenoid valve
A solenoid valve ofParker-Hannifin Pulse Valve 99 Series has been chosen for SSGP. Figure 2.11 shows the image of the solenoid valve. A similar valve is installed in HL-2A tokamak for SMBI [6]. The maximum pressure of the solenoid valve is up to 8 MPa. The minimum pulse length is ~0.1 ms. On the other hand, piezo-electrical valves are used in the conventional gas puffing (GP). In a typical case of piezo-electric valves, the maximum backing pressure is ~0.6 MPa and the minimum pulse length is ~1 ms [10]. While the piezo-electric valve is driven by the motion of a piezo-electric element, the solenoid valve is driven by the electrical magnetic force to open a poppet. The voltage of 250 V is applied for the first 30 µs and the voltage of 30 V is applied until the end of the pulse length. The material of poppet is TEFLON. The cross section of solenoid valve is shown in Fig. 2.12. Comparison between the conventional gas puffing and SSGP is shown in Table 2.1. A solenoid valve for SSGP has been tested at a room temperature in a test vacuum chamber. In this section, the convergence of gas flow ejected from the solenoid valve without the Laval nozzle has been revealed. Various gasses shown in Fig. 2.10 were used in the experiment to investigate the clustering condition.
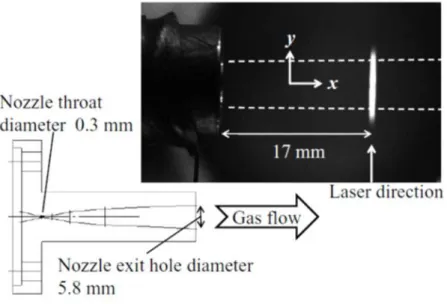
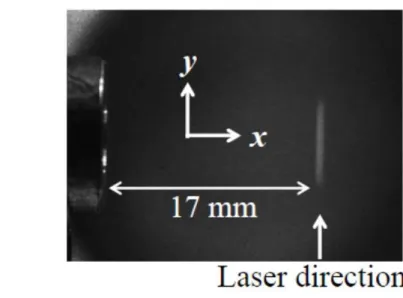
2.2.1 Experimental setup
The experimental setup is shown in Fig. 2.13. A solenoid valve of Parker-Hannifin Pulse Valve Series 99B07 with a 500 µm diameter orifice is used. This valve is equipped with a tapered nozzle and without a Laval nozzle. The available backing pressure is up to 8 MPa. This valve is set inside the vacuum chamber. The pressure in the vacuum chamber is measured by a pressure gauge of MKS Baratron capacitance manometer (MODEL#617A) set at the opposite side of the valve. When the
Chapter 2 Development of supersonic gas puffing
31
valve is open, the gas flows from left to right in Fig. 2.13. Various gasses of H2, He, CH4, N2, Ne, and Ar are used in the experiment. A semiconductor laser of NEOARK LDP2-6535A with 650 nm standard wavelength and 35 mW power is set inside the chamber to perpendicularly intersect the gas flow. A beam dump is set at the opposite side of the laser and the valve is rolled by black tape in such a way that the stray light is lowered. The distance between the valve exit and the laser chord is variable from 3.5 mm to 4.0 mm. A fast charge coupled device (CCD) camera of 1280 × 1024 pixels is arranged in the direction perpendicular to both the gas flow and the laser beam. An example CCD image is shown in Fig. 2.14.
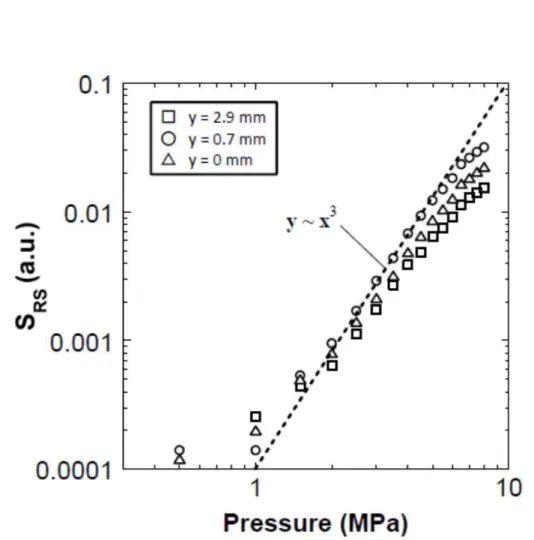
The total Rayleigh scattering signal SRS is proportional to the product of the scattering cross section σ and the number density of clusters nc. The cross section σ is proportional to the square of the averaged cluster size Nc defined by the averaged number of atoms per a cluster. nc is approximately given by the monomer density before becoming cluster, n0, divided by Nc, i.e., nc ≈ n0/Nc. The scattering signal SRS is proportional to P0Nc since the monomer density is proportional to the backing plenum pressure P0. Farges et al. showed that Nc
Chapter 2 Development of supersonic gas puffing
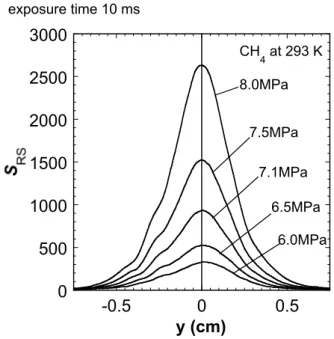
32
camera is fixed to 10 ms. These profiles are axisymmetric and the full-width of half-maximum (FWHM) does not depend on the backing pressure. Similar characteristics are also observed for N2 and Ar.
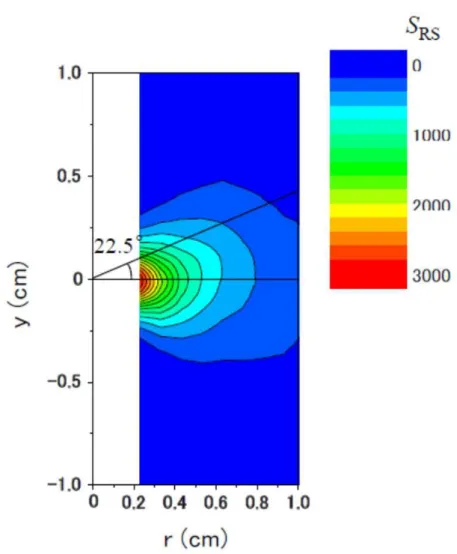
Figure 2.17 shows that scattering signal profiles of Ar measured at different position, where the distance from the valve to laser light is varied from 0.23 cm to 1.0 cm. A contour plot of these profiles is shown in Fig. 2.18. The FWHM increases with the distance from the valve. The expansion half angle of 22.5° suggests that this gas flow is supersonic.
The maximum of the scattering signal as a function of the backing pressure is plotted in Fig. 2.19. The scattering signal increases with ~P02.8 for Ar (Fig. 2.19 (a)) and
~P03.2 for N2 (Fig. 2.19 (b)). These results are similar to the expectation of Eq. (2.31) and the results in Ref. [8]. However, in the case of CH4 (Fig. 2.19 (c)), it is found that the backing pressure dependence is stronger than expected, i.e., SRS
Chapter 2 Development of supersonic gas puffing
33
The expansion half angle of 22.5° was confirmed in the case of the solenoid valve without the Laval nozzle in this section.
Chapter 2 Development of supersonic gas puffing
34
Fig. 2.11 Image of the solenoid valve from Parker-Hannifin Pulse
Valve Series for SSGP.
Fig. 2.12 Cross section of the solenoid valve and the enlarge
image of the exit of the valve.
Chapter 2 Development of supersonic gas puffing
35
Fig. 2.13 Schematic of the experimental setup. The distance from
the solenoid valve to the baratron pressure gauge is 4.2 m.
Inside the chamber is pumped to less than 10
-4Pa. The laser
is set inside the chamber.
SSGP Conventional gas puffing
Valve Solenoid valve Piezo valve
Maximum pressure 8 MPa ~0.6 MPa
Convergence ~5º ~22.5º
Responsive property Valve open time
~100 µs
Valve open time
~1 ms
Table. 2.1 Table of comparison between SSGP and conventional GP.
Chapter 2 Development of supersonic gas puffing
36
Fig. 2.14 The scattering light image detected by the CCD camera in the
case of CH
4. The backing pressure is 8.0 MPa, and the exposure
time is 10 ms. The laser beam direction (y) is perpendicular to the
gas flow (x).
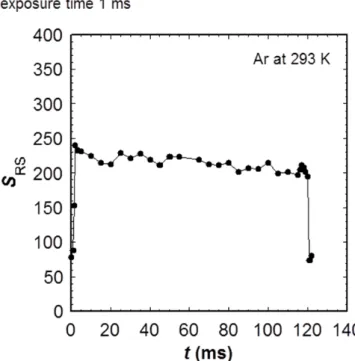
Fig. 2.15 Typical temporal behavior of the scattering signal intensity. The
working gas is Ar and the backing pressure is 7.1 MPa.
Chapter 2 Development of supersonic gas puffing
37
Fig. 2.16 Typical scatter signal profiles in the case of CH
4. The direction
y is parallel to the laser light. The backing pressure P0is scanned
from 6.0 MPa to 8.0MPa, while the gas puff pulse length of 40 ms,
the CCD camera trigger timing of 35 ms, and the exposure time of
10 ms are fixed.
Fig. 2.17 Scatter signal profiles in the case of Ar, where the distance from
valves to laser light is varied from 0.23 cm to 1.0 cm. The
direction y is parallel to the laser beam.
0 500 1000 1500 2000 2500 3000
-0.5 0 0.5
y (cm)
CH4 at 293 K
exposure time 10 ms
8.0MPa
7.5MPa
7.1MPa 6.5MPa
6.0MPa
Chapter 2 Development of supersonic gas puffing
38
Fig. 2.18 Contour plot of scatter signal profiles shown in Fig. 2.17.
Chapter 2 Development of supersonic gas puffing
39
![Fig. 1.2 Bird’s-eye view of LHD [44]. LHD is the world’s-largest superconducting heliotron device](https://thumb-ap.123doks.com/thumbv2/123deta/6158984.103839/24.892.228.660.658.1026/fig-bird-view-world-largest-superconducting-heliotron-device.webp)