Biological control of dimethylsulfoniopropionate and
dimethylsulfide production in the Southern Ocean
Nobue Kasamatsu
DOCTOR OF PHILOSOPHY
Department of Polar Science, School of Multidisciplinary Sciences, The Graduate University for Advanced Studies
2004
Biological control of dimethylsulfoniopropionate and dimethylsulfide production in the Southern Ocean
Table of contents
Abstract ……….. 1 Abbreviations ………. 2
Chapter 1. Introduction ………... 3
1-1 DMS in the global environment ……… 3 1-3 DMS in the Southern Ocean ………. 11
1-2 Dimethylated sulfur in the surface ocean 5 1-4 Objectives of this study ……… 13
Chapter 2. Distributions of DMS and its related compounds in the Southern Ocean ………… 19
2-1 Introduction ……….. 19 2-3 Results ………. 21
2-2 Materials and methods ……….. 20 2-4 Discussion ……… 24
Chapter 3. Role of zooplankton grazing on DMS and DMSPd production ………... 40
3-1 Introduction ……….. 41 3-4 Discussion ……… 46
3-2 Materials and methods ……….. 42 3-5 Summary of Chapter 3 ………. 50
3-3 Results ……….. 45
Chapter 4. The properties of DMSP production by phytoplankton under the cold condition … 59 4-1 Introduction ……….. 59 4-4 Discussion ……… 62
4-2 Materials and methods ……….. 60 4-5 Summary of Chapter 4 ………. 64
4-3 Results ……….. 61
Chapter 5. General discussion ………. 70
Concluding remarks ……….. 82
Acknowledgments ……… 83
References ……… 84
Abstract
In order to understand how biota controls the DMS dynamics, especially the DMS production, in the Southern Ocean, five cruises were conducted during 2002 – 2004 austral summer. In addition, two incubation experiments were conducted in both ship and laboratory. From the observations during cruises two properties of distributions were found. Those properties are (1) there were discrepancies between peak positions of particulate dimethylsulfoniopropionate (DMSPp) and chl a concentrations, and (2) DMS concentrations were high in the coastal regions of Antarctica in January 2002. From the shipboard incubation experiments, it was observed that Antarctic krill, Euphausia superba, produced DMS and dissolved dimethylsulfoniopropionate (DMSPd) in its grazing processes. Copepods also produce DMS, and the potential production rates of DMS in the Southern Ocean by krill and copepods are estimated to be approximately 21 µmol m-2 d-1 and 0.6 µmol m-2 d-1, respectively. From the phytoplankton incubation experiments, it was observed that the DMSPp : chl a ratio of phytoplankton changed during their growth cycles. The ratios increased as much as 6.5 times during the stationary phase, when chl a remained constant. From findings through these two incubation experiments, observed properties of distributions in the ocean could be partly explained. High DMS production rates of zooplankton and the presence of phytoplankton, which have high DMSP contents in their cells, might facilitate in situ DMS production in the Southern Ocean. It was found that the biological control of DMS concentrations in the Southern Ocean is operated through the whole pelagic food web.
Abbreviations
Chl a Chlorophyll a
DMS Dimethylsulfide
DMSP Dimethylsulfoniopropionate
DMSPd Dissolved dimethylsulfoniopropionate DMSPp Particulate dimethylsulfoniopropionate
DMSPt Total dimethylsulfoniopropionate
DMS(P) Dimethylsulfide and Dimethylsulfoniopropionate
DMS(Pd) Dimethylsulfide and dissolved Dimethylsulfoniopropionate
Chapter 1 Introduction
1-1 Dimethylsulfide in the global environment
Human activity has emitted greenhouse gases such as CO2, CH4, N2O, CFCs, and other halocarbons. These gases are believed to increase surface global temperature. Human activity has also increased the abundance of aerosols in the troposphere, mainly by increasing oxidation of sulfur dioxide (SO2), which cause a direct radiative forcing (through their reflection and absorption of solar radiation) and an indirect radiative forcing (through acting as a cloud condensation nuclei (CCN)). The radiative effects of aerosols are mainly negative and tend to cool the surface temperature.
In the near-surface global sulfur cycle, the two largest fluxes to the atmosphere are those from fossil fuel combustion (70 – 100 TgS yr-1) and from oceanic biological activity (12 – 58 TgS yr-1), ignoring the direct input of seawater sulfate by bubble bursting and wave breaking. The other fluxes, from volcanoes (3 – 9 TgS yr–1), land biosphere (0.1 – 7 TgS yr-1) and biomass burning (1 – 4 TgS yr-1), are all small in comparison (Liss et al. 1997). The large range in the estimates of the marine biogenic source is noteworthy. Most of oceanic flux occurs via emission from the oceans of gaseous dimethylsulfide (DMS : (CH3)2S ), with COS, CS2 and hydrogen sulfide (H2S) together accounting for <10% of the total. Chin and Jacob (1996) showed that although in terms of emissions, anthropogenic sources outstrip marine biogenic inputs by 3:1 (67.4 : 22.6 TgS yr-1), in terms of column burden (which is what is important for the formation of CCN) biogenic inputs are just ahead of those from man’s activities. This difference arises from the fact that the residence time of the man-made SO2 is short in comparison with that for DMS, which needs to be oxidized from the atmosphere and sulfate before it can be effectively removed from the atmosphere (transformation processes which take tens of hours to several days to occur). It is clear that despite the pervasive influence of man’s activities on the global sulfur cycle, marine DMS emissions are potentially still a
powerful influence on climate.
It has long been recognized that algae play a highly significant role in the global biogeochemical cycles of oxygen, carbon, nitrogen, phosphorus, and sulfur. The marine biota affect and interact with the climate on many different time-scales. These range from the seasonal (week, month), up to the periods of more than 107 years over which carbon is removed from the atmosphere-ocean system to form carbonate rock and organic deposits - part of the rock cycle which over long timespans is thought to control atmospheric carbon dioxide (CO2) concentrations (Watson and Liss 1998). In case of sulfur, a dominant compound is DMS. Plankton-produced DMS is thought to influence climate by changing the numbers of cloud condensation nuclei available in remote regions; the efficiency of this mechanism is still unknown, but calculations suggest it may be a powerful influence on climate (Watson and Liss 1998). It has a much shorter time-scale than the CO2 effect, and as a consequence may well be a player on the ‘global change’ time-scale. The direction of both the CO2 and the DMS mechanisms is such that more marine productivity would lead to lower global temperatures, Watson and Liss (1998) speculated that the overall effect of the marine biota today is to cool the planet by approximately 6°C as a result of these two mechanisms, with one-third of this figure being due to CO2 effects and two-thirds due to DMS.
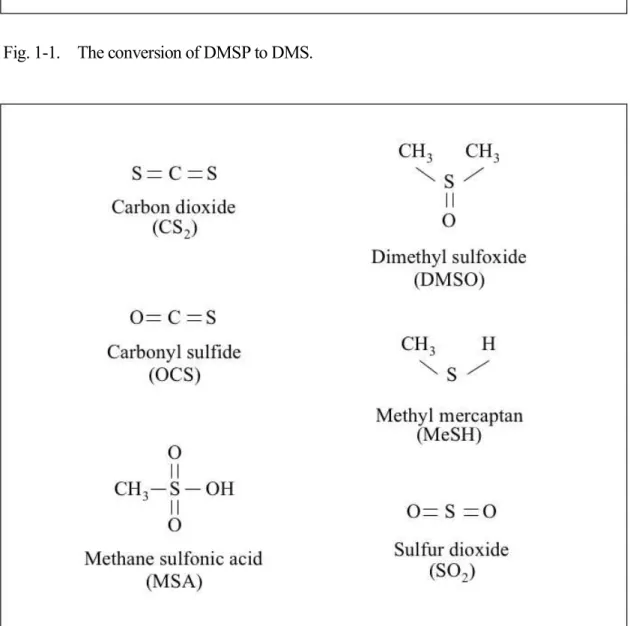
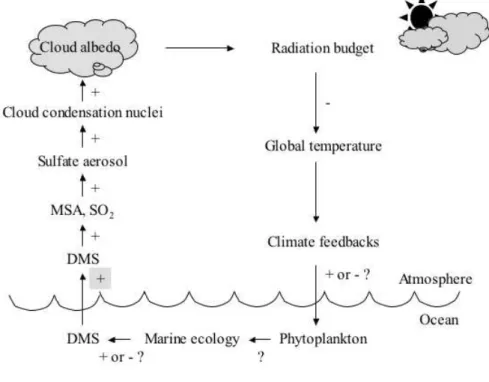
In the ocean, DMS is produced by the enzymatic cleavage of dimethylsulfoniopropionate (DMSP) ( (CH3)2S+CH2CH2COO- ) (Fig. 1-1), an organic compound synthesized by many marine phytoplankton species (e.g. Keller et al. 1989). The volatility of DMS and the concentration gradient across the sea-air interface lead to the ocean being the major source of DMS for the atmosphere (Liss et al. 1997). In the troposphere, DMS is oxidized primarily by hydroxyl radicals. The main atmospheric oxidation products are methanesulfonic acid (MSA) and sulfur dioxide (SO2) (Fig. 1-2). Oxidation of DMS in the atmosphere produces sulfate aerosols that, either directly or by acting as CCN, scatter solar radiation, thereby increasing cloud albedo. If the consequent reduction in solar irradiance made phytoplankton produce less DMS, then a negative feedback would operate, thus stabilizing climate. Because the cloud albedo is sensitive to CCN density, biological regulation of the
climate is possible through the effects of temperature and sunlight on phytoplankton population and DMS production (Chaerson et al. 1987) (Fig. 1-3). The system involving phytoplankton, DMS, sulfate aerosol formation, cloud albedo and ocean surface temperature has been suggested to be a feedback mechanisms linking global biosphere and climate, although the existence of the feedback has not been proven (Simó 2001).
1-2 Dimethylated sulfur in the surface ocean
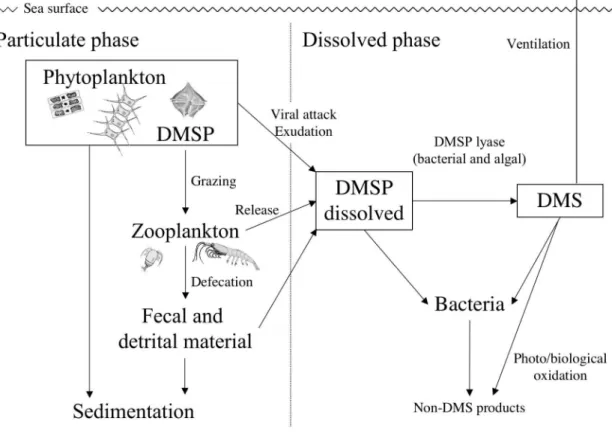
Recent progresses suggest that it is not only phytoplankton but the whole food web that releases DMS and that the response of net DMS production to changes in solar radiation might operate through the profound effects of surface vertical mixing on oceanic biogeochemistry and food web dynamics (Fig. 1-4).
It is well established that methionine is the precursor for DMSP (Stefels 2000). DMSP is the principal source of DMS in surface waters, and it has been known that oceanic phytoplankton produces DMSP as a compatible solute, a cryoprotectant and a grazing deterrent (Malin et al. 1992). Recently, Sunda et al. (2002) found that DMSP reacts rapidly with the hydroxyl radical (·OH), and thus could serve as an effective cellular scavenger of this harmful radical. DMSP’s enzymatic cleavage products, DMS and acrylate (CH2CHCOOH) are even more effective at scavenging hydroxyl radical, as are the DMS oxidation products dimethylsulfoxide (DMSO) and methane sulphinic acid (MSNA). Calculations suggest that, taken together, these molecules constitute and antioxidant system, which could be more effective at scavenging OH radical in high-DMSP algae than other well-recognized antioxidants, such as ascorbate and glutathione. An antioxidant function would explain the observed increase in algal DMSP concentrations at high light, as OH radical is produced as a byproduct of photosynthesis.
There are generally poor positive correlations between DMS and phytoplankton biomass (chlorophyll a concentrations). This is largely caused by differences in the production of a DMS
precursor, DMSP, between phytoplankton species (Keller et al. 1989). In addition, the DMSP content of algae is affected by a variety of abiotic factors, such as salinity, light, temperature and nutrient supply (Malin and Kirst 1997) (Table 1-1). Of these factors salinity has been investigated the most, because DMSP-containing species accumulate or degrade DMSP with increasing or decreasing salinity respectively. DMSP is accumulated in addition to other organic osmosolutes, for example Tetraselmis subcordiformis has DMSP, mannitol, glycine betaine, and homarine. In contrast to ions, organic osmolytes accumulate slowly after hyperosmotic shock, following lag phases of hours to days (Malin and Kirst 1997). Light intensity and daylength both appear to influence cellular DMSP concentration. Green macroalgae from different locations increased their DMSP concentration with increasing irradiance (Karsten et al. 1991), and representatives from Antarctica decreased DMSP concentrations with decreasing daylength and vice versa. However, some inconsistencies were observed which suggested that light history during cultivation was important. Only a few studies have considered the effects of light on DMSP and/or DMS levels in microalgae. Matrai et al. (1995) investigated light dependence of DMS and DMSP production for polar Phaeocystis isolates and found high rates of intracellular DMSP production per unit chl at intensities of less than 3 µmol m-2 s-1. A liner response between 3 and 50 µmol m-2 s-1 and beyond this apparent saturation was observed. More DMS seemed to be produced under light-limiting conditions, but the relationship was not so clear. Keller and Bellows (1996) found no clear effect of light intensity on DMSP production for cultures of Chrysochromulina sp., Emiliania huxleyi, Heterocapsa pygmaea, or Minidiscus trioculatus. Polar macroalgae (chlorophytes) contain significantly more DMSP than their relatives collected from temperate areas, and Karsten et al. (1996) obtained supportice evidence for this idea using malate dehydrogenase from the polar species Acrosiphonia arcta. They found that DMSP stabilized this enzyme activity at –2°C, and DMSP concentrations of 300 mM stimulated enzyme activity to 165% of the control value. Nevertheless, the cryoprotective role of DMSP is less clear for phytoplankton because Antarctic species do not appear to contain elevated DMSP levels when compared to their counterparts from temperate and
tropical regions (Meyerdierks et al. 1997). Nutrient levels can influence intracellular DMSP concentration. The structure of DMSP is similar to that of the nitrogen containing osmoregulatory compound glycine betaine, (CH3)3N+CH2COO- (GBT), which has nitrogen as the central atom in contrast to the sulfur in DMSP. Andreae (1986) has suggested that marine plankton may produce DMSP in preference to GBT under conditions of limited nitrogen availability. Some marine phytoplankton produced more DMSP per cell under nitrogen-deplete conditions (Keller and Bellows 1996). Although there is some evidence for this hypothesis from laboratory culture experiments, data from field studies are notably limited, and the relevance of the idea in the marine environment has yet to be adequately established (Liss et al. 1997). Turner et al. (1996) observed increased levels of DMSP and DMS following addition of iron to patches of seawater in the equatorial Pacific.
In order to calculate budgets or model the global sulfur cycle, it is important to determine the rates of release of organic sulfur compounds from organisms into the water column and to define the degradation pathways for DMSP and related compounds. The conversion of DMSP into DMS is also influenced by complex biological processes such as phytoplankton exudation, cell lysis, viral attack, zooplankton grazing, phytoplanktonic enzymes and bacterial activities (Stefels and van Leeuwe 1998; Simó 2001) (Table 1-1). It is usually assumed that autolysis is a minor pathway for the release of DMSP and DMS from algal cells (Malin and Kirst 1997). In seawater, chemical conversion through hydroxide decomposition is negligible: at pH 8.2 and 10°C dissolved DMSP (DMSPd) has a chemical half-life of 8 yr (Stefels and van Boekel 1993). Wakeham and Dacey (1989) estimated the turnover of intracellular DMSP in microalgae to be 1% per day. A key question is whether it is possible in principle for active cells to release DMSP and DMS into the environment.
Grazing by macro- and microzooplankton has been found to be a key process in the release and conversion of DMSP from marine phytoplankton cells, although the loss of algal DMSP could not always be recovered in the form of DMS (Stefels et al. 1996). Some marine phytoplankton has DMSP lyase (e.g. dimethylpropiothetin dethiomethylase (4.4.1.3) (Nishiguchi and Goff 1995)) (Stefels et al. 1996). The ability of Phaeocystis sp. to cleave extracellular, dissolved DMSP into
DMS and acrylate was first observed in experiments with axenic cultures of this organism (Stefels and van Boekel 1993). After heating of the cultures for 45 min at 60°C, the cleavage reaction could not be restored, indicating of that this conversion was an enzymatic process, and that DMSP lyase activity was associated with the cells. The membrane-bound nature of DMSP-lyase in Phaeocystis sp. was confirmed in cell fractionation experiments in which 50 to 80% of total activity was present in the membrane fraction (Stefels and Dijkhuizen 1995). Hence, Stefels et al. (1995) suggest that DMSP lyase in Phaeocystis is membrane-bound and located outside the cells. It is not clear whether DMS production by grazing was due to enzymatic conversion of DMSP in the guts of the zooplankton or to increased release of DMSPd into the water (Dacey and Wakeham 1986). The possibility that phytoplankton are able to produce DMS from extracellular DMSP – released in the water by e.g. algal cell lysis or sloppy feeding by zooplankton – has not been investigated (Stefels and van Boekel 1993). Wolfe and Steinke (1996) investigated Emiliania huxleyi and reported that DMSP lyase activity per cell was constant during exponential growth, but little DMS was produced by healthy cells. Rather, DMS production was activated when cells were subjected to physical or chemical stresses that caused cell lysis. Hence, they proposed that DMSP lyase and DMSP are segregated within algal cells and reaction only under conditions that result in cell stress or damage. Such activation occurs during microzooplankton grazing. When phytoplankton were grazed by the dinoflagellate Oxyrrhis marina, DMS was produced; ungrazed cells, as well as those exposed to grazer exudates and associated bacteria, generated no DMS. DMS was only generated when cells were actually being grazed, indicating that ingested cells were responsible for the DMS formation. And they suggested that even low levels of grazing can greatly accelerate DMS production. Dacey and Wakeham (1986) were the first to demonstrate that the release of DMS from dinoflagellate cultures was elevated several-fold when cells were grazed by copepods. Daly and DiTullio (1996) showed that grazing by krill on ice-edge phytoplankton communities increased DMS concentration between 3 and 16 times. In contrast, Kwint et al. (1996) concluded from culture experiments that macrozooplankton grazing (copepods) on DMSP containing diatoms repackaged DMSP into fecal
pellets. Small unicellular DMSP producers such as E. huxleyi are not effectively grazed by macrozooplankton and laboratory experiments indicate that microzooplankton are likely to be of greater significance for such species (Christaki et al. 1996). Wolfe and Steinke (1996) showed that grazing by Oxyrrhis marina on E. huxleyi appeared to release DMS because algal DMSP lyase and DMSP were mixed together when algal cells lysed during the grazing process. Wolfe and Steinke (1996) have shown that the amount of DMS released by zooplankton grazing of E. huxleyi is related to the amount of DMSP-lyase in the phytoplankton cells. Apparently, the effect of grazing is to
“mix” the lyase and DMSP which appeared to be otherwise separated in the growing cells.
The current picture is that viral infection of phytoplankton and bacterial cells plays a significant role in the microbial food web, carbon and nutrient cycles, and phytoplankton community succession. This led Malin et al. (1992) to suggest that viral activity might also affect the sulfur cycle as a mechanism for the release of DMS and DMSP from algal cells. Viral pathogens have now been described that infect major DMSP producers such as Phaeocystis species. As yet, there is no field evidence for viral turnover of Phaeocystis populations. In the coccolithophore-dominated bloom in the North Sea, Wilson et al (2002) reported that large viruses, assumed to infect DMSP producing algae, did not appear to influence DMS/DMSP production. They concluded that it is likely that microzooplankton out competed viruses for coccolithophore prey/host.
As indicated in Fig.1-4, there are several processes which remove (which is taken to include transform and destroy) DMSP and DMS from seawater: bacterial consumption / transformation, photochemical oxidation, and loss to the atmosphere by gas exchange across the sea surface. Following release from algal cells, DMSP is a potential bacterial substrate, and a wide range of aerobic and anaerobic degradation pathways exist in bacteria isolated from various marine environments. Two major pathways exist-one involves bacterial DMSP lyase enzymes, which are analogous to the algal enzymes. The alternative pathway, which dose not produce DMS, is via an initial demethylation of DMSP to 3-methyltiopropionate, which can be followed by a further demethylation yielding 3-mercaptopropionate or a demethylation to form methyl mercaptan
(CH3SH) (Stefels et al. 1996, Kiene and Linn 2000). Microbial consumption of DMSPd and DMS resulting in the production of non-DMS products appears to be a significant sink for oceanic DMS and DMSP, although it is extremely variable in both space and time in the ocean (Simó 2001). DMS is also converted into Dimethylsulfoxide (DMSO) via photochemical and microbial oxidation (Liss et al. 1997). It has revealed that, like DMS, DMSO is found in a wide variety of marine environments (Simó et al. 1996, Lee et al. 2003). DMSO concentrations are consistently higher than those of DMS, and it was also detected in the deep waters of the Pacific Ocean and Arabian Sea (Hatton et al. 1996). Some recent studies have shown that DMSO is present in phytoplankton (Simó et al. 1998). Cellular DMSO concentrations (usually calculated on a cell volume or cell water content basis) range from traces to less than 50 mM in “minor DMSP producers” and up to 400 mM in “high DMSP producers.” In the equatorial Pacific revealed that maximal photolysis from DMS to DMSO occurs in the 380-460 nm waveband, and although no other oxidation products were identified, only 14% of the DMS oxidized by this route appeared in the DMSO pool (Kieber et al. 1996). Laboratory studies show that DMSO can also arise from bacterial oxidation of DMS (Malin and Kirst 1997). In addition, anaerobic reduction of DMSO has been observed, implying that DMSO could act as an alternative source of DMS.
Kieber et al. (1996) compared the rates of DMS removal processes (i.e. bacterial decomposition, air-sea exchange, and photochemical transformation) in terms of the turnover rate constant for three different thicknesses of the ocean surface layer (0-1, 0-20 and 0-60 m) in the equatorial Pacific. The results show that all three DMS loss mechanisms are of importance. As might be expected, in the top 1 m loss of DMS to the atmosphere is by far the dominant process (0.9 – 11.7 d-1). Over intermediate water thicknesses, all three loss processes were of roughly similar size. In contrast, over the full 60 m water column, bacterial consumption of DMS dominated (0.04 – 0.66 d-1). Over all, they concluded that DMS is turned over rapidly, from 1 to 4 days. Consequently, sea-air exchange may represent only a minor sink for seawater DMS and DMSP. Burkill et al. (2002) reported DMS flux to the atmosphere was only 1% of the DMSP sulfur produced in the
surface mixed layer within a coccolithophore bloom. Much of the marine sulfur cycle involving DMS, DMSP, and other related compounds remains poorly understood even in sign.
1-3 Dimethylsulfide in the Southern Ocean
In thinking about the link between DMS, CCN and albedo, the Southern Hemisphere and particularly the Southern ocean is a key part of the globe. The relatively small area of ice-free land in the Southern Hemisphere means that terrestrial sources of CCN are less common than in the Northern Hemisphere, and observed CCN concentrations are indeed generally low over the vast ocean areas of the Southern Hemisphere. As Twomey (1991) has shown, areas of low CCN number are much more susceptible to albedo change due to increases in particle inputs than regions where CCN numbers are already high (as in the Northern Hemisphere due to the larger land area and the inputs from industrial and urban pollution sources).
The Southern Ocean (south of the Subtropical Front) surrounding the Antarctic continent covers about 20% of the total world surface ocean. Liss et al. (1997) reported the majority of atmospheric sulfur comes from oceanic DMS originating in the Southern Ocean. Globally, the Southern Ocean is a large source of DMS to the atmosphere, mainly due to high summer DMS production rate in the sea ice zone (the region south of 60°S) (Curran et al. 1998). Also, analysis of DMSP in Antarctic sea ice samples recorded concentrations at tens to hundreds of times higher than levels in the water (Curran and Jones 2000). These high levels are believed to be due to the activity of ice algae (Turner et al. 1995). High DMSP and DMS concentrations have also been observed associated with high productivities in summer and in the ice edge bloom (Curran and Jones 2000). Curran and Jones (2000) estimated the annual emission of DMS from the Southern Ocean to be as much as 139 Gmol S yr-1 (4.4 TgS yr-1), which represents 28% of the global emission (500 Gmol S yr-1) (16 TgS yr-1). The Southern Ocean is also thought to be where the largest changes in DMS flux are expected under global warming (Bopp et al. 2003). According to Bopp et al. (2003), at 2 x CO2,
the model estimates a small increase of global DMS flux to the atmosphere (+2%) but with large spatial heterogeneities (from –15% to +30% for the zonal mean). Mechanisms affecting DMS fluxes are changes in (1) marine biological productivity, (2) relative abundance of phytoplankton species and (3) wind intensity. In the 30-50°S band the model predicts a 19% increase in the annual DMS flux (from 2.7 to 3.2 TgS yr-1). The effect of wind changes alone accounts for one quarter of the total increase (a +5% increase), whereas the major effect is driven by changes in sea-surface DMS concentrations (+15%). Changes in DMS concentrations in that region result mainly from modifications of the community structure of the ecosystem (shift from diatoms to non-siliceous species). However, current studies of DMS models do not satisfactorily reproduce surface DMS concentrations in the Southern Ocean (Belviso et al. 2004), since data sets are sparse in both space and time.
Evidence from observations covering the past ~40 years indicates that parts of coastal Antarctica are warming (Jacobs et al. 2002). Recently, MSA (an oxidation product of DMS) levels in East Antarctic continental ice cores are reported to be correlated with the extent of seasonal sea ice (Curran et al. 2003). Their study clearly demonstrated high MSA deposition within the ice core in years with extensive sea ice and low MSA associated with years when there was less extensive winter sea ice. They suggested that there has been a 20% decline in SIE since about 1950 when the instrumental correlation between MSA concentrations in ice core and 22 years of satellite-derived SIE were extrapolated to longer term MSA data (1841 – 1995). MSA is an oxidation product of DMS which itself is a breakdown product of DMSP produced by phytoplankton. MSA production is influenced by presence of sea ice (Curran and Jones 2000), however, the mechanisms linking phytoplankton DMSP production, to sea ice extent and subsequent MSA deposition in ice cores are unknown because these agreement between satellite records of sea ice extent and an ice core record of MSA production is notable considering the complicating factors involved in this link (Curran et al. 2003). These include sea ice formation (and controls such as deep water circulation, ENSO), sea ice decay (rates, timing, percentage decay), biological activity (and controls such as seeding, nutrients,
light, iron etc…), phytoplankton speciation (succession and distribution), air-sea transfer of DMS (wind speeds), atmospheric oxidation of DMS (and associated pathways to sulfate and MSA), atmospheric mixing, aerosol transport, snow precipitation, wet versus dry deposition, post-depositional effects in the ice sheet (e.g. movement), snow accumulation rate and ice core dating. Nevertheless, DMS is a key part of the relationship between MSA in ice core and sea ice extent, and DMS concentrations in seawater might have shown dramatic change as MSA have.
Climate-induced changes in sea ice cover have a marked impact on the timing and magnitude of phytoplankton blooms in the highly productive southwestern Ross Sea (Arrigo and van Dijken 2004). Not surprisingly, years with the heavy sea ice cover characterized by increased cloudiness, a delayed phytoplankton bloom, and lower annual production than years with lighter sea ice cover (Arrigo and van Dijken 2004). Savidge et al. (1996) suggested that phytoplankton blooms associated with the seasonal ice retreat contribute substantially to the biochemical cycling in the Southern Ocean. Antarctic krill and salps are major grazers in the Southern Ocean (Pakhomov et al. 2002). Atkinson et al. (2004) showed the southwest Atlantic sector contains >50% of Southern Ocean krill stocks, but here their density has declined since the 1970s. They also suggested that spatially, within their habitat, summer krill density correlates positively with chlorophyll concentrations. Temporally, within the southwest Atlantic, summer krill densities correlate positively with sea ice extent the previous winter. Salps, by contrast, occupy the extensive lower productivity regions of the Southern Ocean and tolerate warmer water than krill. They showed that as krill densities decreased last century, salps appear to have increased in the southern part of their range. These changes have had profound effects within the Southern Ocean food web (Atkinson et al. 2004). Air-sea-ice interactions including biological processes in polar regions would provide the control for sulfur cycle as reported in controls for the atmospheric carbon dioxide cycle (Zwally et al. 1983) and the biogeochemical cycle of silica (Ledford-Hoffman et al. 1986).
1-4 Objectives of this study
DMS could be one of the good tools to develop a better insight in the relationship between biota and the climate in the past, at the present and in the future, since DMS is produced through biological processes, and thought to influence climate and climate might influence biota. Objectives of this study are to discuss the properties of distributions of DMS and its related compounds in the Southern Ocean and to understand how biota controls the DMS dynamics in the Southern Ocean.
The “Southern Ocean” is usually a loose collective term for the circumpolar ring of ocean surrounding the Antarctica. For this thesis, the Southern Ocean was defined as the ocean between 40°S and the Antarctic continent. The Antarctic region of the Southern Ocean was defined here as the ocean between the Polar Front which were described by Sokolov and Rintoul (2002) and the Antarctic continent. “The Australian sector” was defined here as the region of the Southern Ocean bound by 80 °E –160 °W.
Table 1-1. Factors influencing DMS(P) production and removal in literature.
DMSP production in algal cells Sign DMS production in seawater Sign DMS removal from seawater Sign
Salinity increase + Phytoplankton cell auto-lysis X Bacterial activities +
Light increase +/- pH in natural condition X Photochemical oxidation +
Temperature increase - (?) Phytoplankton exudation + Air-sea exchange +
Nitrogen supply - Zooplankton grazing + (?)
Iron supply + Phytoplankton enzymes +
Phytoplankton species O Bacterial enzymes +
Reduction of DMSO +
Sign descriptions. +; positive effect, -; negative effect, O; effective, X; not effective, (?); not clear effect.
Fig. 1-1. The conversion of DMSP to DMS.
Fig. 1-2. Sulfur compounds..
Fig. 1-3. The feedback system linking oceanic plankton and climate through the production of atmospheric sulfur.
Fig. 1-4. Schematic representation of dimethylated sulfur processes in the surface ocean.
Chapter 2
Distribution of dimethylsulfide and its related compounds in the Antarctic region of the Southern Ocean
2-1 Introduction
DMS is the most abundant form of volatile sulfur in the ocean. According to Charlson et al. (1987), marine DMS production may act as a climate regulatory mechanism via a feedback loop involving surface ocean temperature, phytoplankton, DMS, sulfate aerosol formation and cloud albedo, although the existence of this feedback has not been proven. Recently, attention has been focused on assessing sinks and sources of DMS in the oceans, and on the processes controlling the cycling of DMS in the marine environment. The different processes involved in marine DMS emission were reviewed by Liss et al. (1997). DMS is produced by the enzymatic cleavage of DMSP, an organic compound synthesized by many phytoplankton. The conversion of DMSP into DMS may be influenced by bacterial activities (Kiene and Linn 2000), phytoplanktonic enzymes (Niki et al. 2000) and zooplankton grazing (Dacey and Wakeham 1986; Cantin et al. 1996; Wolfe et al. 2000).
In the remote marine atmosphere, such as that over the Southern Ocean, DMS is believed to be the sole primary gaseous precursor of atmospheric aerosols. Due to its remote nature there is very limited data on DMS and DMSP concentrations in the Southern Ocean, despite it covering 20% of the total world ocean area.
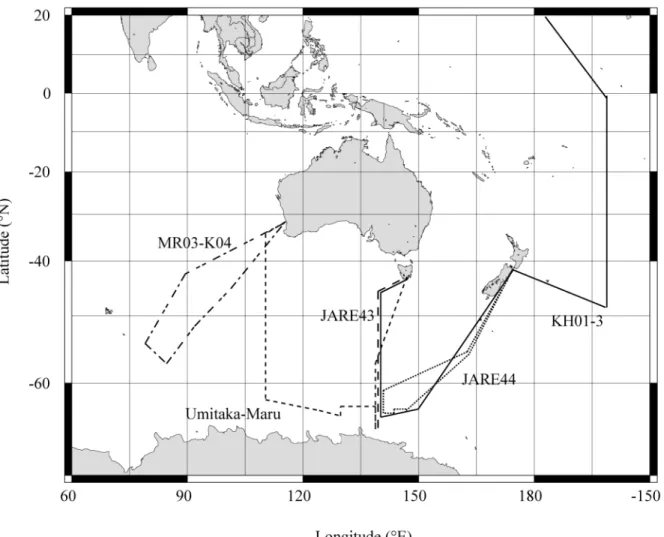
During the period 2001 – 2004 an opportunity was made available by several organizations to participate in five voyages in the Southern Ocean. Two of these voyages were conducted by R/V Tangaroa chartered by Japan Antarctic Research Expedition (JARE) 43 and JARE 44. And the each of the rest was conducted by R/V Hakuho-Maru (the University of Tokyo),
RT/V Umitaka-Maru (the Tokyo University of Fisheries) and R/V Mirai (Japan Marine Science and Technology Center (JAMSTEC)), respectively. In order to understand the factors controlling DMS and its related compounds in the Southern Ocean, broad data sets in both space and time of these compounds are needed. In this chapter, I discuss the features of DMS and DMSP distributions in the Antarctic region of the Southern Ocean.
2-2 Materials and methods
Study area and water sampling
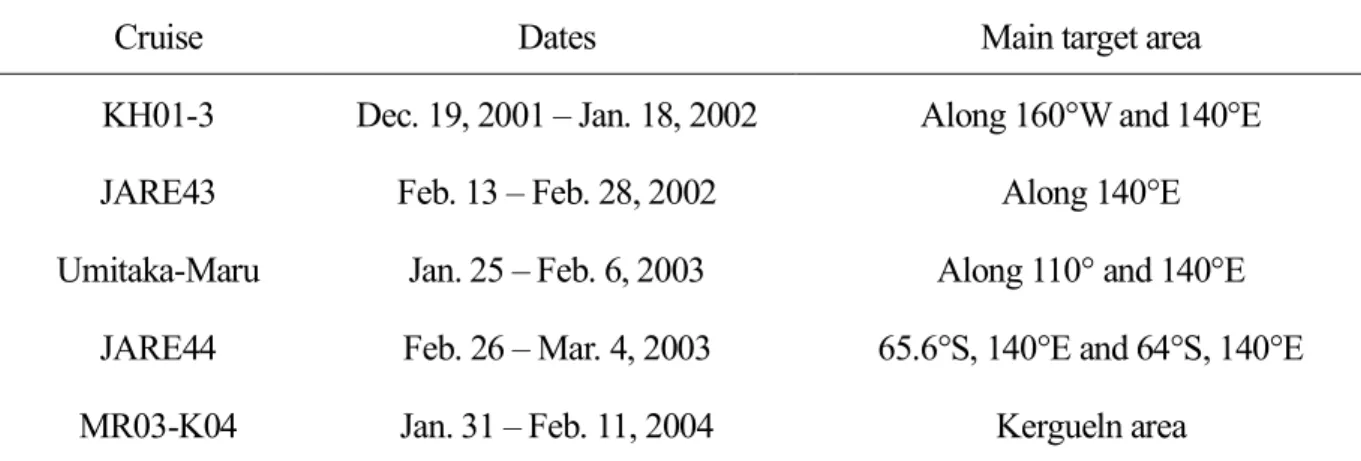
A part of the present study was conducted as a part of a multi-ship/time-series study in the Antarctic Ocean in 2001/02 austral summer (Table 2-1, Fig. 2-1). Sampling was carried out in the Australian sector of the Southern Ocean during the R/V Hakuho-Maru cruise KH01-3 (the University of Tokyo) in January 2002 and during the R/V Tangaroa JARE43 Marine Science Cruise in February 2002. During 2002/03 austral summer sampling were carried out on RT/V Umitaka-Maru (Tokyo University of Marine Science and Technology) in February and on R/V Tangaroa chartered by JARE44 in March. In January 2004 sampling was carried out near the Kergueln plateau during R/V Mirai cruise MR03-K04 (JAMSTEC). Water samples were collected at 10 or 11 depths from 2 to 200 m with a rosette sampler equipped with 12-L Niskin bottles and a CTD probe (SeaBird SBE911 plus). Surface seawater was taken with a plastic bucket.
Sulfur determinations
Water samples for the determination of DMS, dissolved DMSP (DMSPd) and particulate DMSP (DMSPp) were transferred with glass syringes of 100-ml from Niskin bottles to avoid gas exchange. DMS and DMSP concentrations were measured with a modified purge and trap apparatus
as described by Watanabe et al. (1987) and Uzuka et al. (1999). For DMS measurements, an aliquot of 4-14 ml of seawater was filtered on Whatman GF/F filter (47-mm) and the filtrate was introduced into a glass purge chamber. DMS concentration was determined on a gas chromatograph (Shimadzu GC-14B) equipped with a flame photometric detector (FPD). For DMSPt (total DMSP = DMSPd+DMSPp) + DMS measurements, an aliquot of 4-14 ml of seawater sample was poured into a 30-ml serum bottle containing 4 ml of 6 M NaOH. The alkali treatment permits the cleavage of DMSPt into gaseous DMS. For DMSPd+DMS measurements, an aliquot of 4-14 ml of seawater was filtered through a Whatman GF/F filter and the filtrate was poured into a serum bottle containing NaOH. Serum bottles were stored at 4°C for at least 24 hours to complete the cleavage before analyses. For DMSP analyses, the serum bottles were purged with pure nitrogen gas. DMSPd
concentration was computed as the difference between DMSPd+DMS and DMS. DMSPp concentration was calculated as the difference between DMSPt+DMS and DMSPd+DMS. The analytical error for each measurement was 11%.
Other measurements
Salinity, temperature, sigma-t and chl a levels were provided by ORI (Ocean Research Institute), the University of Tokyo for KH01-3 (Terazaki et al. 2003) and NIPR (National Institute of Polar Research) for JARE43 and JARE44 cruises. For Umitaka-Maru cruise, salinity, temperature and sigma-t were derived from the data sets of Umitaka-Maru and chl a levels were provided by Dr. T. Hirawake (personal communication).
2-3. Results
Overview of the survey site
Distributions of temperature, salinity and sigma-t in upper 200 m along 140°E during KH01-3, JARE43, Umitaka-Maru and JARE44 cruises are shown in Fig. 2-2.
In January 2002, the northern edge of the sea ice cover was observed near 65.5°S. In February, sea ice cover had retreated more than 93 kilometers further south, near the coast of the Antarctic continent. All of the sampling station was thus free of ice in February 2002. During the two cruises (KH01-3 and JARE43) structure of the Antarctic region of the Southern Ocean along 140°E longitude was nearly the same (S. Aoki personal communication) (Fig. 2-2 a, b). The southern branch of the Polar Front (PF-S) (identified by 2.2°C at sigma-t max) was observed between 60° and 61°S at each cruise. The northern branch of the southern ACC (Antarctic Circumpolar Current) front (SACCF-N) (identified by 2.0°C at sigma-t max) was found between 62° and 63°S in January and between 61.75° and 62.50°S in February. The southern branch of the southern ACC front (SACCF-S) (identified by 1.8°C at sigma-t max) was found between 64° and 65°S in January and between 64° and 64.75°S in February. The southern boundary of the ACC (SB) (identified by 1.5°C at sigma-t max) coincided with the Antarctic Slope Front (ASF) (identified by 0°C at 200 db) which was found between 64° and 65°S in January and between 64.75° and 65.12°S in February. The surface mixed layer depth (defined as the depth where potential density is 0.1 greater than surface values) almost became shallower from the north to the south in the south of PF-S during both cruises except in the south of the ASF in February, where the mixed layer depth became increased. The surface mixed layer depth deepened from January to February. In the south of the ASF the seasonal variability of the mixed layer depth was big and near 65.5°S it increased from 5 m in January to 50 m in February.
Concentrations of DMS and related compounds
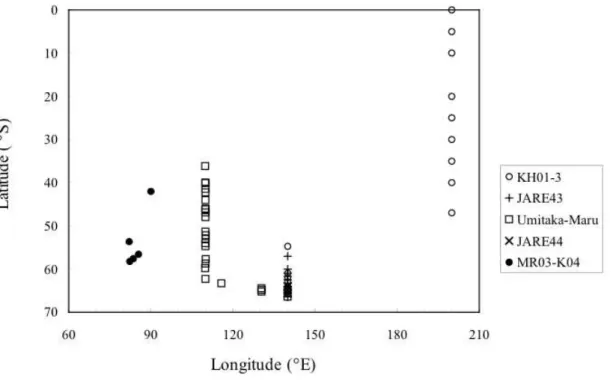
Sampling sites and concentrations of DMS, DMSPd, DMSPp and chl a at sea surface
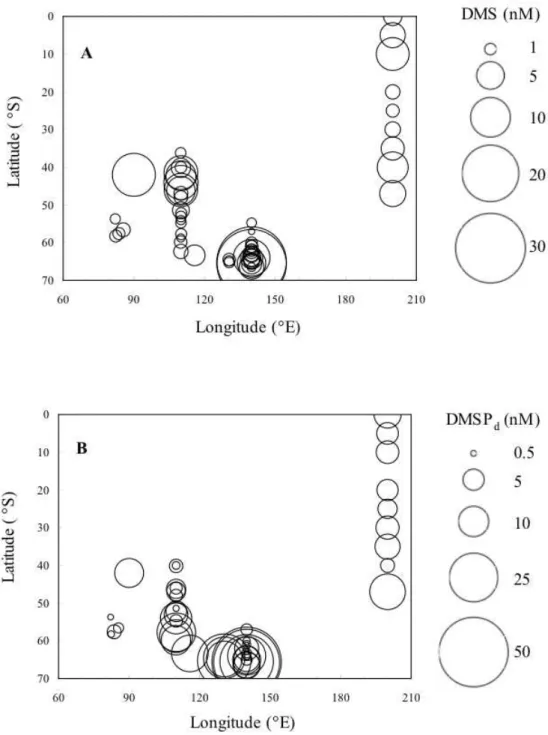
during five cruises are shown in Fig. 2-3 and in Fig. 2-4. All these concentrations were observed during austral summer (December 19th to March 4th) (Table 2-1). Concentrations of DMS, DMSPd, DMSPp and chl a at sea surface were in ranges of 0.37-31.43 nmol l-1, 0.23-48.77 nmol l-1, 1.12-120.44 nmol l-1 and 0.03-9.93 mg m-3, respectively (Fig. 2-4). The highest levels of all these parameters were observed along 140°E, in the south of 65°S. In the Australian sector of the Southern Ocean, DMS concentrations at sea surface showed latitudinal variations during austral summer (Fig. 2-5 a). There were two DMS peaks. The first peak of DMS concentrations coincided with the Subtropical Front, approximately at 44°S. The second peaks of DMS concentrations were located in the south of the SACCF-S (approximately 64°S). From 50 - 60°S, DMS concentrations varied only in a narrow range from 0.6 to 2.0 nmol l-1. There were peaks of DMSPd concentrations in around 58°S and in the south of 64 °S (Fig. 2-5 b). The peaks of DMSPp and chl a concentrations were also observed in the south of 64°S, although clear latitudinal variations were not found between 40°S to 60°S (Fig. 2-5 c, d).
From the time serial observations conducted in January and February 2002 along 140°E latitude in the Antarctic region of the Southern Ocean, seasonal variations of DMS and its related compounds were found. Distributions of DMS, DMSPd, DMSPp and chl a concentrations along 140°E in January and February 2002 are shown in Fig. 2-6. Concentrations of all these parameters were higher in the southern parts of each cruise. High concentrations of DMS, DMSPd and DMSPp
for both cruises were observed upper 100 m. In January 2002, an extensive phytoplankton bloom composed mainly of diatoms (Miki 2003) was observed near the sea ice edge. Chl a concentrations reached 11.3 mg m-3 at 65.7°S (Fig. 2-6 a). DMSPp was a maximum, approximately 60 nmol l-1, at 64°S. However, DMS and DMSPd concentrations in 65° and 65.7°S were higher than those in 64°S. At 65°S, DMS maximum was 48 nmol l-1, a value 24 times higher than DMS concentrations measured in most oceans areas (Aumont et al. 2002) and DMSPd maximum was 53 nmol l-1 at 65.7°S. In February, sea ice cover had retreated further south, near the coast of the Antarctic
continent. Concentrations of DMS maximum decreased to 9 nmol l-1 (Fig. 2-6 b). High DMSPp concentrations were observed at 65.4°S, although chl a concentrations were higher at the southernmost stations, 66.4°S. Integrated values of DMS and DMSPd decreased from January (KH01-3) to February (JARE43) in the south of 65°S (Table 2-2). However, integrated value of DMSPp increased there. Integrated values of chl a were high at each southernmost sampling site of KH01-3 and JARE43 cruises. In January integrated values of chl a at 65.0° and 65.7°S were over 360 mg m-2. It decreased below 90 mg m-2 at 65.4°S in February.
2-4. Discussion
Five cruises were conducted during austral summer 2002, 2003 and 2004 to demonstrate the features of DMS and DMSP distributions in the Antarctic regions of the Southern Ocean. DMS(P) varied in both space and time. DMS(P) distributions sometimes seemed to be associated with the oceanic physical structure.
During time serial observations conducted in January and February 2002, there were substantial changes in the position of the ice edge and in the concentrations of biogenic sulfur compounds and chl a. In both cruise, higher concentrations of DMS, DMSPd, DMSPp and chl a were observed in the southern part of each observation area. In January, the southernmost sampling station (65.7°S) was located near the ice edge and the integrated values of DMS and DMSPd measured that month in the upper 200 m of the water column were relatively high, 1.45 mmol·m-2 and 2.18 mmol·m-2, respectively (Table 2-2). Maximum of DMSPp integrated value was observed at northern site, 64°S, although DMSPp had been known as the principal source of DMSPd and DMS. DMSPp
had also been known to be produced by phytoplankton, however, phytoplankton biomass, estimated by chl a was relatively higher in the southernmost station, 65.7°S. In February, when the sea ice had
retreated further south, the integrated DMS value (0 – 200 m) decreased to one-third of that in January in the south of 65°S (Table 2-2). The integrated DMSPd value in February also decreased there. In contrast to DMS and DMSPd, the integrated DMSPp value increased over the two months.
From the distributions of DMS(P) and chl a concentrations, it was shown that (1) there were discrepancies between the peak positions of DMSPp and chl a concentrations, (2) there were discrepancies between the peak positions of DMS(Pd) and those of DMSPp, and (3) DMS concentrations were high in January 2002.
The possible reasons of the mismatch between DMSPp and chl a include a differences in dominant phytoplankton species. It is known that DMSP contents of phytoplankton differs from phytoplankton species (Keller et al. 1989), for example, Phaeocystis sp. are known to be a significant producer of DMSP and diatoms are known to be a moderate producer. If there were higher DMSP producer (high DMSP, low chl a) at 64°S and lower producer (low DMSP, high chl a) at 65.7°S, it would be recorded as discrepancies between DMSPp and chl a. Other possibility is associated with the physiological stage of phytoplankton bloom. Matrai and Vernet (1997) suggested from the observation in the Barents Sea that physiological stage of bloom would be more important to biogeochemical cycling than its phytoplankton species composition in controlling DMSP and DMS flux.
One of the possible reason of the mismatch between DMS(Pd) and DMSPp would be a complex biological control. Uzuka (1999) investigated the distributions of DMS(P) in Funka Bay and observed the condition; low DMS, low DMSPd, and high DMSPp. They referred to the DMS(Pd) consumption by bacteria. In the end of the diatom bloom DMSPd and DMS concentrations increase due to phytoplankton senescence and grazing by zooplankton. The increase of substrate stimulates bacterial consumption of DMSPd and DMS. Dominated phytoplankton are replaced from diatom (low DMSP producer) to high DMSP producer with high bacterial consumption rates of DMS(Pd). It results in a low DMS, low DMSPd, and high DMSPp.
Bacterial growth in aquatic systems may be regulated by temperature, predation, substrate supply and viral infection (Granéli et al. 2004). Zubkov et al. (2002) investigated the bacteria-driven turnover of DMSP and DMS in the North Sea and suggested that bacterioplankton communities exerts strong control over DMSPd and DMS concentrations both in the subsurface layer and surface mixed layer. Aranami et al. (2001) observed a positive correlation between DMS concentrations and bacterial production in the North Pacific and suggested that bacterial production does not represent DMS and DMSP removal but rather DMSP cleavage (DMS production) in this area. In the Southern Ocean, bacterial production rates are reported to be smaller than that in North Sea and the North Pacific (Aranami et al. 2001, Zubkov et al. 2002, Granéli et al 2004). In addition, Granéli et al. (2004) suggested that even if organic carbon seems to be limiting bacterial production in the Southern Ocean, temperature is a very important regulator of bacterial growth rates at the community level. Hence, bacterial production of DMS as well as bacterial consumption of DMS and DMSPd could have less impact on sulfur cycle in the Southern Ocean than that in other temperate oceans.
A possible reason of high DMS in January 2002 may be a high phytoplankton biomass. Precursor of DMS, DMSP, is produced by phytoplankton (Keller et al. 1989), therefore, high phytoplankton biomass would be tend to high DMS concentrations. Physical parameter might be included in a reason of high DMS concentrations. Aranami and Tsunogai (2004) suggested that the strong seasonal DMS variability at high latitudes would result mainly from dilution effects in the surface mixed layer. In January, in the southernmost station, mixed layer depth was only 5 m and there would be less effect of dilution within the mixed layer, although photochemical oxidation of DMS would proceed within the thin mixed layer.
There would be a lot of scenarios which gave the observed distributions of DMS, DMSPd
and DMSPp. In the following chapters, I discuss the effects of zooplankton and phytoplankton on the production processes of these sulfur compounds. Zooplankton must be an essential to produce
DMSPd. Among many kinds of zooplankton, I chose Antarctic krill and salp, which appeared to be profound in the climate change. Phytoplankton could be highly responsible to the initiation of the DMS(P) dynamics in the ocean. In spite of its importance, the data linking phytoplankton with DMS(P) dynamics are limited to phytoplankton biomass and composition of species in the Southern Ocean. At last I discuss the DMS dynamics associated with the food web in the Southern Ocean.
Table 2-1. Time periods when DMS(P) samples were collected in the Southern Ocean (in the south of 40°S).
Cruise Dates Main target area
KH01-3 Dec. 19, 2001 – Jan. 18, 2002 Along 160°W and 140°E
JARE43 Feb. 13 – Feb. 28, 2002 Along 140°E
Umitaka-Maru Jan. 25 – Feb. 6, 2003 Along 110° and 140°E JARE44 Feb. 26 – Mar. 4, 2003 65.6°S, 140°E and 64°S, 140°E
MR03-K04 Jan. 31 – Feb. 11, 2004 Kergueln area
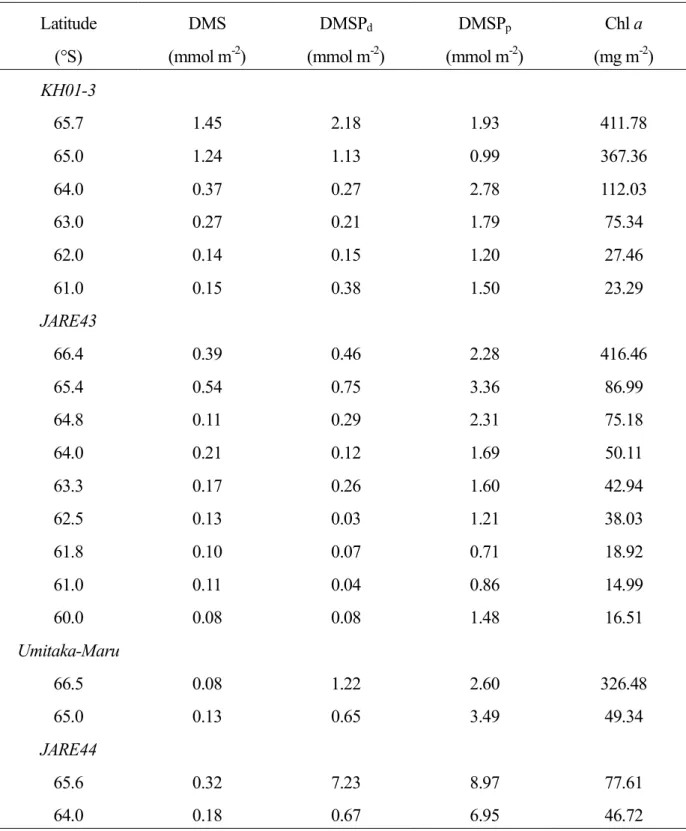
Table 2-2. Integrated values for DMS, DMSPd, DMSPp and chl a in the water column (depth = 0 – 200 m) along 140°E.
Latitude DMS DMSPd DMSPp Chl a
(°S) (mmol m-2) (mmol m-2) (mmol m-2) (mg m-2) KH01-3
65.7 1.45 2.18 1.93 411.78
65.0 1.24 1.13 0.99 367.36
64.0 0.37 0.27 2.78 112.03
63.0 0.27 0.21 1.79 75.34
62.0 0.14 0.15 1.20 27.46
61.0 0.15 0.38 1.50 23.29
JARE43
66.4 0.39 0.46 2.28 416.46
65.4 0.54 0.75 3.36 86.99
64.8 0.11 0.29 2.31 75.18
64.0 0.21 0.12 1.69 50.11
63.3 0.17 0.26 1.60 42.94
62.5 0.13 0.03 1.21 38.03
61.8 0.10 0.07 0.71 18.92
61.0 0.11 0.04 0.86 14.99
60.0 0.08 0.08 1.48 16.51
Umitaka-Maru
66.5 0.08 1.22 2.60 326.48
65.0 0.13 0.65 3.49 49.34
JARE44
65.6 0.32 7.23 8.97 77.61
64.0 0.18 0.67 6.95 46.72
Fig. 2-1. Cruise tracks for five cruises.
Fig. 2-2. Distributions of temperature, salinity and sigma-t during KH01-3 (a), JARE43 (b), Umitaka-Maru (c) and JARE44 (d). (a)
Fig. 2-2. (continued)
(b)
Fig. 2-2. (continued)
(c)
Fig. 2-2. (continued)
(d)
Fig. 2-3. Sampling sites of sea surface water for DMS(P) measurements during five cruises.
Fig. 2-4. Concentrations of DMS (A), DMSPd (B), DMSPp (C), and chl a (D) at sea surface.
Fig. 2-4. (continued)
Fig. 2-5. Latitudinal variations of DMS (a), DMSPd (b), DMSPp (c) and chl a (d) of sea surface.
Chapter 3
Role of zooplankton grazing on DMS and DMSPd production
3-1 Introduction
Since DMS is produced in seawater by the breakdown of its precursor, DMSP, one of the key steps towards better knowledge of DMS cycling in the ocean is to understand the rates of and controls on production and fate of DMSP. The conversion of DMSP into DMS may be influenced by bacterial activities (Kiene and Linn 2000), phytoplanktonic enzymes (Niki et al. 2000) and zooplankton grazing (Dacey and Wakeham 1986; Cantin et al. 1996; Wolfe et al. 2000). However, there is still a need for a proper evaluation of the role of zooplankton on DMS production in natural systems.
Dacey and Wakeham (1986) found that one third of the phytoplankton DMSP ingested by copepods was released in the seawater as DMS. Daly and DiTullio (1996) showed that DMS concentrations increased when krill were added to bottles filled with seawater during shipboard experiments. The interpretation of these results is, however, limited since zooplankton ingestion rates were not measured during these experiments.
Zooplankton grazing experiments conducted during DMS studies were mainly done with copepods and krill which are both known as sloppy feeders (Dacey and Wakeham 1986; Daly and DiTullio 1996; Tang et al. 2000a). Macrozooplankton have various grazing mechanisms in nature. In order to understand the impact of zooplankton on DMS production, we need to assess the effect of the different grazing mechanisms on DMS production. The Antarctic krill, Euphausia superba, and the tunicate, Salpa thompsoni, are both known as dominant macrozooplankton groups in the Antarctic Ocean. Although both krill and salps are
filter feeders (e.g. Harbison et al. 1986), they have different grazing mechanisms. Krill are known as sloppy feeders since they break algal cells with their mouthparts (Mauchiline and Fisher 1969) while salps filter particles on their mucous nets and swallow them directly into their guts (Alldredge and Madin 1982). Breakage of the algal cells through sloppy feeding may result in greater DMSPd production than does grazing by direct ingestion of cells without breakage (Kawaguchi 2001). Because of their different grazing mechanisms and their importance as consumers of primary producers in the Antarctic region of the Southern Ocean, I believe it is important to compare the contribution of krill and salps to DMS production in this ocean system. The objective of this chapter is to determine the influence of macrozooplankton grazing on DMS and DMSPd production in the Southern Ocean.
3-2 Materials and methods
Water sampling
Sampling was carried out in the Antarctic region of the Southern Ocean during R/V Tangaroa cruise (JARE43) in February 2002 (Table 3-1). Water samples were collected at the layer of chl a maxima with a rosette sampler equipped with 12-L Niskin bottles and a CTD probe (SeaBird SBE911 plus). In addition, surface seawater was taken with a plastic bucket. On some occasions, seawater pumped by the ship from a depth of ca. 5 m was (Table 3-1).
Incubation experiments
In order to determine the influence of macrozooplankton grazing on DMSPd and DMS production, shipboard incubation experiments were conducted during JARE43 cruise using the two dominant macrozooplankton species, the Antarctic krill Euphausia superba and
the tunicate Salpa thompsoni (Table 3-1). Krill and salp individuals were sampled by vertical tows with a NORPAC net at a hauling speed of 0.5 m s-1. Salps were handled as gently as possible to avoid any damage to the animals. The animals were acclimated for several days under laboratory condition, and only the ones in good condition were used for the experiments. This time span also ensured the regeneration of their mucous nets even if they were accidentally damaged during the sampling. Except for Exp-3, krill were collected before the cruise and kept alive in the laboratory until performing the experiments. Approximate body length of krill and salps were 35 and 40 mm, respectively. All animals were kept in Whatman GF/F (nominal pore size of 0.7-µm) filtered seawater for 24 hours prior to the beginning of the experiments in order to make sure that the gut contents of the animals were cleared out.
For the incubation experiments, water was collected at the sea surface or at the depth of the chl a maximum, as described above, or pumped by the ship from a depth of approximately 5 m (Table 3-1). The water was transferred into a 75-L plastic bucket through 330-µm mesh which removed macro- and mesozooplankton. Initial concentrations of DMS, DMSPd, DMSPp, chl a and bacteria of the seawater in this 75-L bucket were determined in triplicate. The seawater was then immediately subdivided into 6 narrow-mouthed 10-L polycarbonate bottles as gently as possible. One animal each was placed in three of these bottles. The remaining three bottles without animals were incubated as controls. All the labware was previously cleaned with diluted HCl.
All bottles were incubated, with a little headspace, for 6-24 h in a darkened roller incubator installed in a low temperature room (ca. 0.5°C). At the end of the incubation, subsamples were collected in each bottle for the determination of DMS(P), chl a and bacterial abundance. The appearance of fecal pellets in the incubation bottles was checked every 3-6 hours. Fecal pellets were removed from the treatment bottles when they were present. They
were observed and photographed under a microscope. Clearance rate of chl a by macrozooplankton was calculated using the equation suggested by Frost (1972).
Sulfur determinations
DMS and DMSP concentrations were measured with GC-FPD as described in chapter 2 of this thesis.
Pigments analysis
Samples for pigment analysis (chl a and pheopigments) were filtered on Whatman GF/F filters. Pigments were extracted in dimethylformamid (Suzuki and Ishimaru 1990) for 24 h at ca. –80°C. Concentrations of pigments were determined onboard ship (Parsons et al. 1984) using a Model 10AU Turner Designs fluorometer.
Zooplankton and Bacterial abundance
Samples for the determination of bacterial abundance were fixed with 0.5% glutaraldehyde and kept refrigerated for later processing. At a shore laboratory, cells were stained with DAPI and counted by epifluorescence microscopy (Kirchman et al. 1982).
Statistical methods
Statistical analyses were conducted in order to evaluate the possible impacts of zooplankton on DMS(P) production, chl a concentration and bacterial abundance in the experimental seawater during the incubation. Since the values in the control bottles changed during the incubation periods as well as in the treatment bottles, differences of the final values between treatment bottles and control bottles (mean of three replicates for each experiment) were compiled for both krill and salps, and applied to the tests. Since I was uncertain about
the normality of the distribution of the values, I used both parametric (one tailed t-test) and non-parametric (the Sign test) to assess the significance of their differences. Nonparametric tests are less powerful than parametric test, but require fewer assumptions. Therefore, the results of the nonparametric tests will be more conservative (Zar, 1999). To evaluate the relationship between the zooplankton grazing activity and DMS(P) production, a linear regression was fitted. Statistical analyses were conducted using Statview (Version 5.0, SAS) software.
3-3 Results
Krill experiments
During most experiments, krill ingested phytoplankton pigments. chl a concentrations in treatment bottles, were significantly lower than those of final control bottles (One tailed t-test, n = 12, t = -2.713, p ≤ 0.05; Sign Test, n = 12, p ≤ 0.01) (Fig. 3-1 a). For all experiments, the clearance rate was 262 ± 239 ml ind.-1 h-1 (mean ± SD) and the ingestion rate ranged from 0.00 to 0.48 µg chl a ind.-1 h-1 (Table 3-2). DMSPd+DMS concentrations in treatment bottles were significantly higher than in the final control bottles (One tailed t-test, n
= 12, t = 2.937, p ≤ 0.05; Sign Test, n = 12, p ≤ 0.01) (Fig. 3-1 b). Production rates of DMS and DMSPd+DMS were 2.91 ± 2.75 nmol ind.-1 h-1 and 2.96 ± 2.78 nmol ind.-1 h-1, respectively (Table 3-3). Mean bacterial abundance under the different experimental conditions ranged from 1.1 to 1.4 x 10⁵ cells ml-1 (Table 3-4). There was a statistical significant difference in bacterial abundances between treatment bottles and final control (One tailed t-test, n = 12, t = 3.559, p ≤ 0.01; Sign Test, n = 12, p ≤ 0.05).
Salp experiments
Initial chl a concentrations in salp grazing experiments were lower than those in krill experiments (Table 3-1). Significant statistical differences between chl a concentrations in treatment bottles and final control bottles were observed (One tailed t-test, n = 6, t = -2.936, p ≤ 0.05; Sign Test, n = 6, p ≤ 0.05) (Fig. 3-1 a). During the experiments with salps, clearance rates ranged from 5.3 to 1048 ml ind-1 h-1 while ingestion rates were 0.06 ± 0.06 µg chl a ind-1 h-1 (mean ± SD) (Table 3-2). However, changes in DMSPd+DMS concentrations during the incubations were not statistically significant (One tailed t-test, n = 6, t = 1.071, p = 0.333; Sign Test, n = 6, p = 0.688) (Fig. 3-1 b). Mean bacterial abundance under the different experimental conditions ranged from 0.8 to 1.0 x 10⁵ cells ml-1 (Table 3-4). There was no significant difference in bacterial abundance between the treatment bottles and final control bottles (One tailed t-test, n = 6, t = -1.777, p = 0.136; Sign Test, n = 6, p = 0.219).
The relationship between ingestion rates and production rates
Ingestion rate of krill was linearly related to DMSPd+DMS production rate (linear regression, n = 12, r2 = 0.664, p ≤ 0.01) (Fig. 3-2). In one case, the DMSPd+DMS production rate of krill was calculated as a negative value. This may have been caused by the poor physiological condition of the krill.
3-4 Discussion
Antarctic krill and salps are the dominant herbivores in the Antarctic regions of the Southern Ocean. (Pakhomov et al. 2002). Although both krill and salps are filter feeders, they
have different grazing mechanisms. In their mouthpart, E. Superba has mandibles that macerate any large particles, and the food passes to the mouth (Mauchiline and Fisher 1969). Breakage of phytoplankton cells causes the release of organic matter to seawater. Whereas salps ingest whole phytoplankton and repackage the ingested chemicals into rapidly sinking pellets. Fecal pellets of krill, which are known to be sloppy feeders, contained destroyed phytoplankton cells (Fig. 3-3 a) while those produced by salps contained unbroken phytoplankton cells (Fig. 3-3 b, c). The difference in grazing mechanisms (sloppy feeding or direct ingestion) may lead to differences in the magnitude of DMS and DMSPd release from the ingested phytoplankton cells.
The ingestion rate of krill was linearly related to the DMSPd+DMS production rate (r2 = 0.664, p ≤ 0.01, n = 12) (Fig. 3-2). This indicates that krill grazing on phytoplankton is directly linked to the increasing DMSPd+DMS concentration. The difference in bacterial abundance between treatment bottles and final control bottles (Table 3-4) was significant in krill experiments. If the bacterial abundance has increased in the treatment bottles, it may also have affected the DMSPd+DMS production in krill experiments. However, the linear relationship found between ingestion rates of krill and DMSPd+DMS production rate supports the assumption that DMSPd+DMS production has been stimulated by krill grazing during the experiments.
The rate of DMSPd+DMS production by krill grazing in this study was 2.96 nmol krill-1 h-1 and the DMS production rate was 2.91 nmol krill-1 h-1 (Table 3-3). DMS production rate through krill grazing reported by Daly and DiTullio (1996) accounted for only 5% of the value obtained in the present work. Daly and DiTullio (1996) noted that their values may have been underestimated due to confinement effects. Furthermore, in their work, the initial chl a concentration was low (0.31 mg m-3) compared with that of krill incubation experiments in this work (Table 3-1). The containers used here were relatively large (10-L), and were rotated
during the experiment so that the phytoplankton were always suspended in the incubation bottles. Moreover, most of the animals used during current incubations were well adapted to the tanks and consequently less stressed than wild animals recently captured. All these experimental conditions should have produced values with less experimental stress, which may be closer to the in situ value.
In the case of salps, clearance rates varied among individuals (Table 3-2). Huntley et al. (1989) conducted shipboard incubation experiments and obtained maximum clearance rates of 376 ml ind-1 h-1 for Salpa thompsoni in the Antarctic Peninsula region. Pakhomov et al. (2002) reported that clearance rate of S. thompsoni is a function of body length. According to their regression, the clearance rate of salps of 40 mm length should be 1491 ml ind.-1 h-1. In present study, clearance rates of salps ranged from 5.3 to 1048 ml ind-1 h-1 (337 ml ind-1 h-1 on average). These clearance rates are slightly smaller than those of Pakhomov et al. (2002), but maximum rates obtained here are only marginally higher than those of Huntley et al. (1989). Pakhomov et al. (2002) also reported that the changes in ingestion rates as a function of salp length are best represented by a power function. This equation gives an ingestion rate of 0.6 µg pigment·ind.-1 d-1 for a 40 mm animal. In present experiment, the ingestion rates of salps ranged between 0.0 and 0.2 µg chl a· ind.-1 d-1. These low values result mainly from the low chl a concentrations present in incubation vessels and not from the clearance performance. Hence, I believe current incubation experiments on salps are appropriate for grazing experiments.
Bacteria attached to fecal pellets and damaged phytoplankton cells are known to play an important role in the transformation of DMSP and DMS (Scarratt et al. 2000). The effect of attached bacteria should have been negligible during incubations since fecal pellets were removed. However, attached bacteria may have been more abundant and/or active on the fecal pellets from the krill than from the salps which contained mostly intact cells. It is also