s t at es of m
i ddl e- aged adul t s i n J apan
著者
N
akam
i ne Shi n, Tac hi kaw
a H
i r okaz u, Ai ba
M
i yuki , Takahas hi Sho, N
oguc hi H
ar uko,
Takahas hi H
i det o, Tam
i ya N
anako
j our nal or
publ i c at i on t i t l e
PLO
S O
N
E
vol um
e
12
num
ber
12
page r ange
e0189112
year
2017- 12
権利
( C) 2017 N
akam
i ne et al . Thi s i s an open
ac c es s ar t i c l e di s t r i but ed under t he t er m
s of
t he Cr eat i ve Com
m
ons At t r i but i on Li c ens e,
w
hi c h per m
i t s unr es t r i c t ed us e, di s t r i but i on,
and r epr oduc t i on i n any m
edi um
, pr ovi ded t he
or i gi nal aut hor and s our c e ar e c r edi t ed.
U
RL
ht t p: / / hdl . handl e. net / 2241/ 00150657
Changes in social capital and depressive
states of middle-aged adults in Japan
Shin Nakamine1,2*, Hirokazu Tachikawa3, Miyuki Aiba4, Sho Takahashi3, Haruko Noguchi5, Hideto Takahashi6, Nanako Tamiya7
1Faculty of Human Sciences, University of Tsukuba, Tsukuba, Ibaraki, Japan,2JSPS Research Fellow, Chiyoda-ku, Tokyo, Japan,3Department of Psychiatry, University of Tsukuba, Tsukuba, Ibaraki, Japan, 4Faculty of Human Sciences, Toyo Gakuen University, Bunkyo-ku, Tokyo, Japan,5School of Political Science and Economics, Waseda University, Shinjuku-ku, Tokyo, Japan,6Natinal Institute of Public Health, Wako, Saitama, Japan,7Faculty of Medicine, University of Tsukuba, Tsukuba, Ibaraki, Japan
Abstract
The present study examines the relationships between changes in bonding and bridging types of social capital and depressive states among middle-aged adults in Japan using a nationally representative sample. Data was collected from a nationwide, population-based survey conducted from 2005 to 2013 in nine annual waves. A total of 16,737 middle-aged men and 17,768 middle-aged women provided data. They reported about depressive states, measured by Kessler 6 scores, and bonding and bridging types of social capital, measured by reported participation in different social activities. Latent growth modeling was conducted to examine relations between changes in bonding and bridging types of social capital and depressive states within individuals across the nine waves. The results showed that, for both men and women, increases in bonding social capital were associated with decreases in depressive states, while changes in bridging social capital were not related to changes in depressive states. In addition, the results showed that changes in bonding social capital, but not bonding social capital at the baseline, affected changes in depressive states. Future studies should take changes in social capital as an independent variable into consideration.
Introduction
Depression is one of the most prevalent of all psychiatric disorders [1]. Depression was ranked as the single most burdensome disease in the world in terms of disability-adjusted life years (DALY) among middle-aged adults [2]. It adversely affected not only physical health [3] but also the quality of interpersonal relationships [4,5]. Thus, depression significantly influences individual well-being.
Depression in older adults is different from depression earlier in the lifespan in that the for-mer is more closely associated with risk factors such as suicide, which are in turn related to increased mortality [6]. Among older adults, the prevalence rate of depression in middle-aged adults was higher than in the elderly [7,8]. In addition, the prevalence rate scarcely declined
a1111111111 a1111111111 a1111111111 a1111111111 a1111111111 OPEN ACCESS
Citation:Nakamine S, Tachikawa H, Aiba M, Takahashi S, Noguchi H, Takahashi H, et al. (2017) Changes in social capital and depressive states of middle-aged adults in Japan. PLoS ONE 12(12): e0189112.https://doi.org/10.1371/journal. pone.0189112
Editor:Enzo Pasquale Scilingo, Universita degli Studi di Pisa, ITALY
Received:December 23, 2016
Accepted:November 20, 2017
Published:December 7, 2017
Copyright:©2017 Nakamine et al. This is an open access article distributed under the terms of the Creative Commons Attribution License, which permits unrestricted use, distribution, and reproduction in any medium, provided the original author and source are credited.
with age [7]. Therefore, it is important to examine the factors that prevent and treat depression in middle-aged adults.
In Japan, the prevalence rate of mental disorders has been increasing recently [9]. The total number of people with mood disorders was estimated as 1,116,000 in 2014, of whom 274,000 (about 25%) were middle-aged adults aged 50 to 64 [10]. Preventing depression is important to enhance the quality of life not only among the current middle-aged cohort, but also the future generation aged 65 and older, which will compose more than 30% of the entire Japanese population in the next several decades [11].
Concern about social capital as an important factor for preventing depression has been growing over the past few decades. Social capital refers to social networks, and the trust and norms derived from them [12]. Many research studies have shown that greater social capital at the individual level is associated with less depression [13,14], although social capital is often treated as a collective-level concept [12].
According to Oshio, prior studies examining the association between individual-level social capital and health can be divided into cross-sectional studies and prospective cohort studies [15]. Cross-sectional studies address the contemporaneous association between social capital and health [16,17]. In contrast, prospective cohort studies focus on how social capital in the baseline year explains health outcomes or changes in the follow-up years [14,18]. Murayama et al. have pointed out that longitudinal studies are required to understand the causal effect of social capital on health [18].
Most longitudinal studies addressing the association between individual-level social capital and depression have also examined the causal effect of social capital in the baseline year on depression or changes in the follow-up years, similar to Oshio [15]. However, individual-level social capital, as well as depression, change over time [19,20]. Nevertheless, there has been few studies examining the association between changes in both individual-level social capital and depression.
This study examined the association between changes in individual-level social capital and depression among middle-aged adults, using nationally representative data in Japan. Espe-cially, we focused on individual-level bonding and bridging aspects of social capital. Bonding social capital is derived from relationships among homogenous people who are similar in terms of sociodemographic or social characteristics (e.g., age, ethnicity, and social class), whereas bridging social capital is derived from relationships among heterogeneous people who do not necessarily share similar identities [12,21]. Previous studies have demonstrated that bonding social capital negatively affected depression and bridging social capital was not associated with depression in Japan [15,18]. Based on these results, it is likely that increases in bonding social capital over time are associated with decreases in depression, while changes in bridging social capital are not related to depression.
Method
Study population and procedure
This study used nine-wave panel data obtained from a nationwide, population-based survey, the “Longitudinal Survey of Middle-aged and Elderly Persons (LSMEP)”, which has been con-ducted since 2005 by the Japanese Ministry of Health, Labour and Welfare (MHLW) in Japan. Respondents to the survey were extracted randomly through a stratified two-stage sampling. First, 2,515 districts in 2005 were selected at random from the entire 5,280 districts surveyed by the population-based “Comprehensive Survey of the Living Conditions of People on Health and Welfare” conducted by the MHLW in 2004. Second, 40,877 residents were chosen Japan. Those who want to use the data for any
purposes should contact to the Statistics and Information Department of the MHLW. Please refer following URL:http://www.mhlw.go.jp/toukei/ sonota/chousahyo.html.
Funding:This study was financially supported by Research on Policy Planning and Evaluation (H27-Seisaku-Senryaku-012) under the aegis of the MHLW (PI: Prof. Nanako Tamiya at Tsukuba University). This research was supported by a grant-in-aid from the Ministry of Health, Labour and Welfare; Health and Labour Sciences Research Grant, Japan; Comprehensive Research on Life-Style Related Diseases including Cardiovascular Deseases and Diabetes Mellitus (H28-junkankitou-ippan-009). This research project has received official approval to use the secondary data from the Statistics and Information Department of the MHLW under Tohatsu-1218-1 as of December 18, 2015. The funders had no role in study design, data collection and analysis, decision to publish, or preparation of the manuscript.
randomly from those aged 50 to 59 living in each selected district in proportion to the popula-tion size.
In 2005 the questionnaires were dropped off at the respondents’ homes by enumerators. Then, the enumerators collected the self-completed questionnaire several days later from 34,240 (response rate: 83.8%). As of 2006, the method had changed from a drop-off to a mail survey and the questionnaires were mailed only to those who had responded to the first survey in 2005. No new respondents were added after the first year of the survey, and response rate at the latest year of 2013 declined to 58.0%.
This research project received official approval to use secondary data from the Statistics and Information Department of the MHLW under Tohatsu-1218-1 on December 18, 2015. An eth-ical review of the LSMEP is not required according to the Etheth-ical Guidelines for Epidemiologi-cal Research of the Japanese government [22]. In addition, this study was approved by the official ethical review board of the University of Tsukuba (I No Rinri Iinkai, Document No. 1009).
Measures
Please seeS1 Appendixfor more detailed information about the survey question used in the study.
Depressive state. Depressive state was assessed using the Japanese version of the Kessler 6
(K6) scale [23]. Respondents were asked to rate six items on a five-point scale (0 =none of the timeto 4 =all of the time): During the past 30 days, about how often did you feel (1) nervous, (2) hopeless, (3) restless or fidgety, (4) so depressed that nothing could cheer you up, (5) that everything was an effort, and (6) worthless? Then, the sum of the reported scores (range: 0–24) was calculated and defined as the K6 score. Higher K6 scores reflect higher levels of depressive state. The Cronbach’s alpha coefficient throughout the nine waves wasα>.88 for both men and women.
Social capital. To construct social capital measures, this study used questions about
family members or friends, workplace colleagues, or in a neighborhood association was con-sidered equivalent to bonding social capital, whereas the number of social activities they partic-ipated in a non-profit organization or a public-service corporation was considered equivalent to bridging social capital.
Demographic and socioeconomic status and chronic disease diagnosis. Demographic
and socioeconomic status included gender, age (calculated from the month and year of birth), marital status (1 = married, 0 = unmarried), educational achievement (1 = college graduate or above, 0 = high school graduate or below), working hours of a week, and house ownership (1 = yes, 0 = no). These variables measured at Wave 1 were used.
The survey asked respondents whether they suffered from each of the following diagnoses: diabetes, heart disease, stroke, hypertension, hyperlipidemia, and cancer. A binary variable for chronic disease diagnosis was constructed by allocating 1 to respondents who reported at least one of the diagnoses and 0 to otherwise. These variables measured at Wave 1 were used.
Statistical analysis
All statistical analyses were conducted separately according to gender because depression was not likely to decline with age in women compared with men [7] and social capital had a more significant effect on depression in women compared to men [25]. Descriptive analyses were performed using SPSS 21.0 for Windows. For the descriptive statistics and the construction of depressive status and social capital variables, we used pairwise deletion of missing data.
To examine changes in depressive states and social capital across the nine waves, Latent Growth Modeling (LGM) with Mplus version 7.4 was used, based on full information maxi-mum-likelihood parameter estimation to handle missing data. First, we compared a linear growth model and a quadratic growth model of depressive state and social capital with LGM. We used Comparative Fixed Index (CFI), Root Mean Square Error of Approximation (RMSEA), and Akaike’s Information Criterion (AIC) to evaluate the goodness of fit for the tested models. CFI assumes that all latent variables are uncorrelated (null/ independence model) and compares the sample covariance matrix with this null model. The CFI ranges between 0.0 and 1.0 with values closer to 1.0 indicating a good fit. A value of CFI0.95 is rec-ommended as indicative of a good fit [28]. RMSEA indicates how well the model would fit the population’s covariance matrix. RMSEA favors parsimony in that it will choose the model with the lesser number of parameters [28]. A value of RMSEA0.07 is recommended [28]. AIC is used to compare plural models, which comprise the same variables. The model which has a smaller value for AIC has a better fit than the other models.
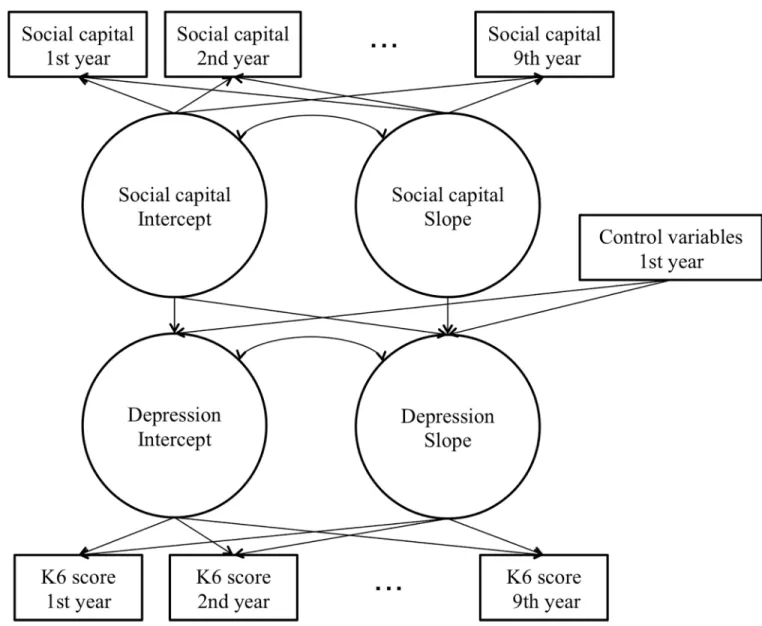
To examine relations between changes in depressive state and social capital, we regressed the latent variables of depressive state that reflected the baseline (intercept) and the growth fac-tor (slope) on age, marital status, educational achievement, working hours, house ownership, chronic disease diagnosis, and the latent variable of social capital that reflected the baseline. In addition, we regressed the growth factor of depressive state on the growth factor of social capi-tal (Fig 1).
Results
Table 1summarizes the demographic and socioeconomic status and chronic disease diagnosis measures.
Changes in depressive state and social capital
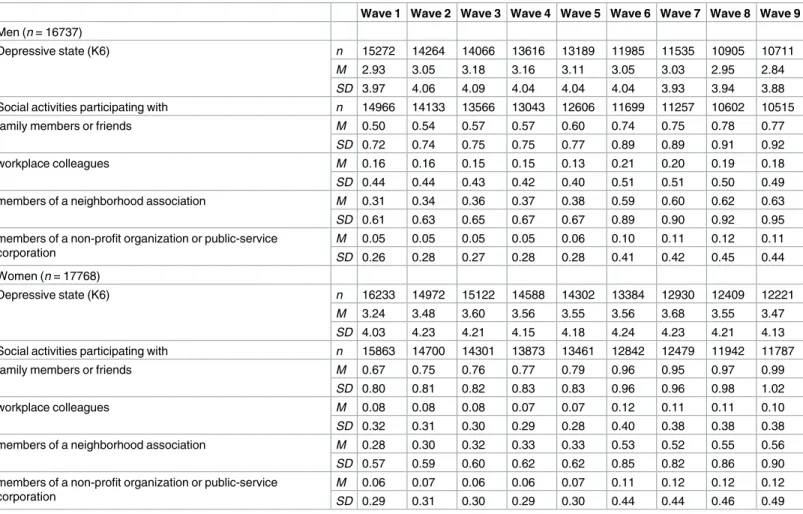
Descriptive statistics of depressive state and social capital across the nine waves are shown in
To examine changes in depressive state across the nine waves, LGMs were conducted by gen-der (Table 3). For men, the linear growth model had a fair to good fit, CFI = .979, RMSEA = .029, AIC = 583313.83. The intercept and linear slope means were 3.09 and 0.01. The quadratic growth Fig 1. Outline of the tested model using latent growth modeling.
https://doi.org/10.1371/journal.pone.0189112.g001
Table 1. Descriptive statistics on demographic status, socioeconomic status, and the diagnosis of chronic disease by gender.
Men (n= 16737) Women (n= 17768)
M(SD) n(%) Missing data M(SD) n(%) Missing data
Age (years) 54.83 (2.74) - 0 54.55 (2.75) - 0
Marital status (married) - 14240 (85.1) 352 - 14690 (82.7) 403
Educational achievement (college or above) - 3647 (21.8) 1389 - 1388 (7.8) 1436
Working hours 43.25 (16.82) - 808 23.08 (20.28) - 937
House ownership (yes) - 13768 (82.3) 417 - 14769 (83.1) 465
Chronic disease diagnosis (yes) - 5494 (32.8) 321 - 4712 (26.5) 369
model also had a fair to good fit, CFI = .994, RMSEA = .016, AIC = 582526.86. The intercept, lin-ear slope and quadratic slope means were 2.96, 0.12, and -0.01. For women, the linlin-ear growth model had a fair to good fit, CFI = .976, RMSEA = .034, AIC = 639711.75. The intercept and linear slope means were 3.42 and 0.04. The quadratic growth model also had a fair to good fit, CFI = .992, RMSEA = .021, AIC = 638693.30. The intercept, linear slope and quadratic slope means were 3.28, 0.16, and -0.02. Since the quadratic slope means were quite small for men and women, the linear growth models were adopted because they were more straightforward to interpret than the quadratic growth models.
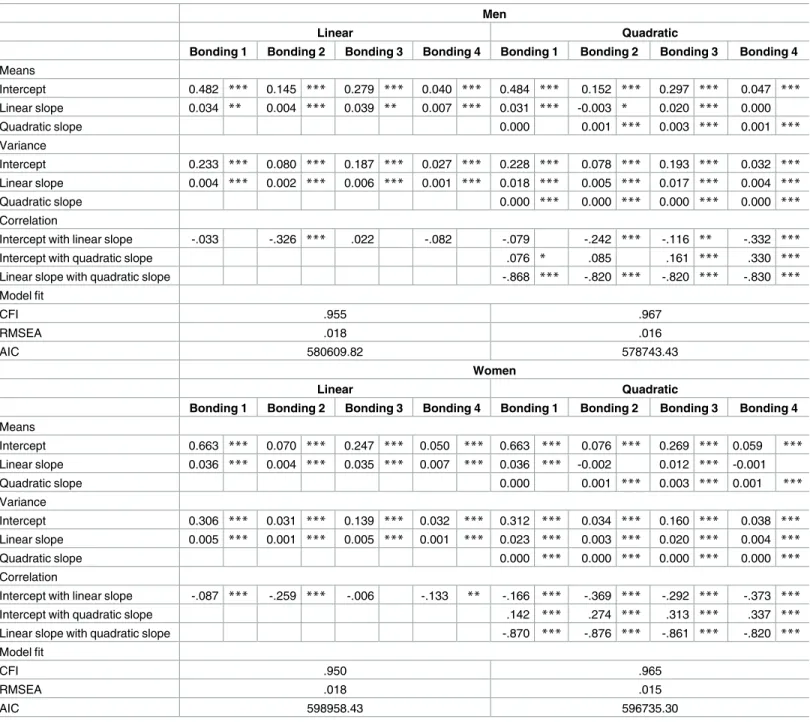
To examine changes in social capital across the nine waves, LGMs were conducted by gender (Table 4). For men, the linear growth model had a fair to good fit, CFI = .955, RMSEA = .018, AIC = 580609.82. The quadratic growth model also had a fair to good fit, CFI = .967, RMSEA = .016, AIC = 578743.43. For women, the linear growth model had a fair to good fit, CFI = .950, RMSEA = .018, AIC = 598958.43. The quadratic growth model also had a fair to good fit, CFI = .965, RMSEA = .015, AIC = 596735.30. Although the qua-dratic growth models had a slightly better goodness of fit than the linear growth models for both men and women, the quadratic slope means were quite small. Thus, the linear growth models were adopted because the models were more straightforward to interpret than the quadratic growth models.
Table 2. Descriptive statistics about depressive state across the nine waves by gender.
Wave 1 Wave 2 Wave 3 Wave 4 Wave 5 Wave 6 Wave 7 Wave 8 Wave 9
Men (n= 16737)
Depressive state (K6) n 15272 14264 14066 13616 13189 11985 11535 10905 10711
M 2.93 3.05 3.18 3.16 3.11 3.05 3.03 2.95 2.84
SD 3.97 4.06 4.09 4.04 4.04 4.04 3.93 3.94 3.88
Social activities participating with n 14966 14133 13566 13043 12606 11699 11257 10602 10515
family members or friends M 0.50 0.54 0.57 0.57 0.60 0.74 0.75 0.78 0.77
SD 0.72 0.74 0.75 0.75 0.77 0.89 0.89 0.91 0.92
workplace colleagues M 0.16 0.16 0.15 0.15 0.13 0.21 0.20 0.19 0.18
SD 0.44 0.44 0.43 0.42 0.40 0.51 0.51 0.50 0.49
members of a neighborhood association M 0.31 0.34 0.36 0.37 0.38 0.59 0.60 0.62 0.63
SD 0.61 0.63 0.65 0.67 0.67 0.89 0.90 0.92 0.95
members of a non-profit organization or public-service corporation
M 0.05 0.05 0.05 0.05 0.06 0.10 0.11 0.12 0.11
SD 0.26 0.28 0.27 0.28 0.28 0.41 0.42 0.45 0.44
Women (n= 17768)
Depressive state (K6) n 16233 14972 15122 14588 14302 13384 12930 12409 12221
M 3.24 3.48 3.60 3.56 3.55 3.56 3.68 3.55 3.47
SD 4.03 4.23 4.21 4.15 4.18 4.24 4.23 4.21 4.13
Social activities participating with n 15863 14700 14301 13873 13461 12842 12479 11942 11787
family members or friends M 0.67 0.75 0.76 0.77 0.79 0.96 0.95 0.97 0.99
SD 0.80 0.81 0.82 0.83 0.83 0.96 0.96 0.98 1.02
workplace colleagues M 0.08 0.08 0.08 0.07 0.07 0.12 0.11 0.11 0.10
SD 0.32 0.31 0.30 0.29 0.28 0.40 0.38 0.38 0.38
members of a neighborhood association M 0.28 0.30 0.32 0.33 0.33 0.53 0.52 0.55 0.56
SD 0.57 0.59 0.60 0.62 0.62 0.85 0.82 0.86 0.90
members of a non-profit organization or public-service corporation
M 0.06 0.07 0.06 0.06 0.07 0.11 0.12 0.12 0.12
SD 0.29 0.31 0.30 0.29 0.30 0.44 0.44 0.46 0.49
Relationship between changes in depressive state and social capital
across the nine waves
To examine the relationship between changes in depressive state and social capital, LGMs were conducted separately for men and women (Table 5). We regressed the intercept and lin-ear slope of depressive state on age, marital status, educational achievement, job status, house ownership, chronic disease diagnosis, and the intercept of social capital. In addition, we regressed the linear slope of depressive state on the linear slope of social capital.
For men, the intercepts of bonding social capital (bonding 1, bonding 2, and bonding 3) were negatively related to the intercepts of depressive state,bs = -0.844, -0.596, and -0.203,ps<.01. The intercept of bridging social capital was not related to the intercept of depressive state,b= 0.147,p= .487. This indicates that depressive state was lower at the baseline while bonding social capital was higher at the baseline. The results also showed that the slopes of bonding social capital negatively affected the slope of depres-sive state, while the intercept and slope of bridging social capital did not affect the slope of depressive state. In addition, the intercept of bonding social capital (bonding 3: the number of social activities participating in a neighborhood association) positively affected the slope of depressive state. Thus increases in bonding social capital were asso-ciated with decreases in depressive state, while depressive state increased when bonding social capital was higher at the baseline.
For women, the same results were found. In other words, depressive state was lower at the baseline when bonding social capital was higher at the baseline. In addition, increases in bond-ing social capital were associated with decreases in depressive state, while depressive state increased when bonding social capital was higher at the baseline.
Table 3. Estimated values of the linear growth model (linear) and the quadratic growth model (quadratic) for depressive state with latent growth modeling by gender.
Men Women
Linear Quadratic Linear Quadratic
Means
Intercept 3.087 *** 2.964 *** 3.416 *** 3.281 ***
Linear slope 0.014 ** 0.124 *** 0.044 *** 0.163 ***
Quadratic slope -0.014 *** -0.015 ***
Variance
Intercept 10.063 *** 9.738 *** 11.143 *** 11.073 ***
Linear slope 0.099 *** 0.600 *** 0.107 *** 0.709 ***
Quadratic slope 0.008 *** 0.009 ***
Correlation
Intercept with linear slope -.227 *** -.132 *** -.201 *** -.168 ***
Intercept with quadratic slope .024 .075 **
Linear slope with quadratic slope -.909 *** -.916 ***
Model fit
CFI .979 .994 .976 .992
RMSEA .029 .016 .034 .021
AIC 583313.83 582526.86 639711.75 638693.30
**p<.01 ***p<.001.
Table 4. Estimated values of the linear growth model (linear) and the quadratic growth model (quadratic) for social capital by gender.
Men
Linear Quadratic
Bonding 1 Bonding 2 Bonding 3 Bonding 4 Bonding 1 Bonding 2 Bonding 3 Bonding 4 Means
Intercept 0.482 *** 0.145 *** 0.279 *** 0.040 *** 0.484 *** 0.152 *** 0.297 *** 0.047 *** Linear slope 0.034 ** 0.004 *** 0.039 ** 0.007 *** 0.031 *** -0.003 * 0.020 *** 0.000
Quadratic slope 0.000 0.001 *** 0.003 *** 0.001 ***
Variance
Intercept 0.233 *** 0.080 *** 0.187 *** 0.027 *** 0.228 *** 0.078 *** 0.193 *** 0.032 *** Linear slope 0.004 *** 0.002 *** 0.006 *** 0.001 *** 0.018 *** 0.005 *** 0.017 *** 0.004 ***
Quadratic slope 0.000 *** 0.000 *** 0.000 *** 0.000 ***
Correlation
Intercept with linear slope -.033 -.326 *** .022 -.082 -.079 -.242 *** -.116 ** -.332 ***
Intercept with quadratic slope .076 * .085 .161 *** .330 ***
Linear slope with quadratic slope -.868 *** -.820 *** -.820 *** -.830 ***
Model fit
CFI .955 .967
RMSEA .018 .016
AIC 580609.82 578743.43
Women
Linear Quadratic
Bonding 1 Bonding 2 Bonding 3 Bonding 4 Bonding 1 Bonding 2 Bonding 3 Bonding 4 Means
Intercept 0.663 *** 0.070 *** 0.247 *** 0.050 *** 0.663 *** 0.076 *** 0.269 *** 0.059 *** Linear slope 0.036 *** 0.004 *** 0.035 *** 0.007 *** 0.036 *** -0.002 0.012 *** -0.001
Quadratic slope 0.000 0.001 *** 0.003 *** 0.001 ***
Variance
Intercept 0.306 *** 0.031 *** 0.139 *** 0.032 *** 0.312 *** 0.034 *** 0.160 *** 0.038 *** Linear slope 0.005 *** 0.001 *** 0.005 *** 0.001 *** 0.023 *** 0.003 *** 0.020 *** 0.004 ***
Quadratic slope 0.000 *** 0.000 *** 0.000 *** 0.000 ***
Correlation
Intercept with linear slope -.087 *** -.259 *** -.006 -.133 ** -.166 *** -.369 *** -.292 *** -.373 ***
Intercept with quadratic slope .142 *** .274 *** .313 *** .337 ***
Linear slope with quadratic slope -.870 *** -.876 *** -.861 *** -.820 ***
Model fit
CFI .950 .965
RMSEA .018 .015
AIC 598958.43 596735.30
Bonding 1: the number of social activities participating with family members or friends. Bonding 2: the number of social activities participating with workplace colleagues. Bonding 3: the number of social activities participating in a neighborhood association. Bridging: the number of social activities participating in a non-profit organization or public-service corporation.
*p<.05 **p<.01 ***p<.001.
Discussion
The purpose of this study was to examine the association between changes in bonding and bridging types of social capital and depressive states among middle-aged adults in Japan using a nine-wave nationally representative data. Unlike most previous studies, we focused on changes in social capital and confirmed that changes in social capital, especially bonding social capital, are important for preventing depressive states.
Regarding changes in social capital and depressive states across the nine waves, linear growth models were adopted, regardless of gender. The results indicated that bonding and bridging types of social capital and depressive states slightly increased on average for both men and women as time went on.
For associations between bonding social capital and depressive state at the baseline, which corresponded to the contemporaneous association between bonding social capital and depres-sion, we confirmed that bonding types of social capital at the baseline (intercepts) were nega-tively associated with depressive state at the baseline for both men and women. These results Table 5. Estimated associations between social capital and depressive state.
K6 (depressive state)
Men Women
Intercept Slope Intercept Slope
b SE b SE b SE b SE
Bonding1
Intercept -0.879 0.067 *** 0.013 0.010 -1.011 0.063 *** 0.003 0.009
Slope -0.801 0.102 *** -0.823 0.086 ***
Bonding 2
Intercept -0.716 0.115 *** 0.033 0.017 -0.548 0.214 * 0.027 0.029
Slope -0.571 0.138 *** -0.427 0.216 *
Bonding 3
Intercept -0.217 0.071 ** 0.025 0.010 * -0.188 0.093 * 0.034 0.013 *
Slope -0.309 0.071 *** -0.228 0.078 *
Bridging
Intercept 0.169 0.215 0.050 0.031 -0.362 0.188 0.029 0.029
Slope -0.064 0.157 -0.148 0.154
Control variables
Age -0.101 0.011 *** 0.000 0.002 -0.092 0.011 *** -0.003 0.002 *
Married -0.590 0.104 *** 0.025 0.014 -0.441 0.094 *** 0.023 0.012
Education 0.025 0.069 -0.037 0.009 *** 0.170 0.103 -0.006 0.015
Working hours -0.015 0.002 *** 0.000 0.000 -0.009 0.002 *** 0.000 0.000
House ownership -0.351 0.090 *** -0.019 0.013 -0.270 0.098 ** 0.012 0.013
Diagnosis 0.607 0.063 *** -0.013 0.009 0.668 0.070 *** -0.009 0.009
Model fit
CFI .954 .950
RMSEA .019 .019
Bonding 1: the number of social activities participating with family members or friends. Bonding 2: the number of social activities participating with workplace colleagues. Bonding 3: the number of social activities participating in a neighborhood association. Bridging: the number of social activities participating in a non-profit organization or public-service corporation.
*p<.05 **p<.01 ***p<.001.
support previous findings [15,16,29]. Bonding social capital refers to aspects of “inward-look-ing” social networks that reinforce homogeneous groups [21]. As described in detail in previ-ous study [18], the similarity among local residents is of greater benefit than dissimilarity, because shared personal characteristics elicit perceptions of trust and social resemblance that might foster the development of a social support system in the community [30]. It is known that social support buffers against stress [31] and therefore, it was expected that bonding social capital would be negatively related to depression.
On the other hand, bridging social capital at the baseline was not associated with depressive state at the baseline for either men or women, as has been described in previous studies [16,
29]. Bridging social capital refers to “outward-looking” social networks with different mem-bers that do not necessarily share similar identities [21]. Bridging social capital is considered important for gathering diverse information and obtaining outside assistance for addressing significant challenges [32], whereas dissimilarities in bridging tie may impede improvements in health outcomes by hindering the development of social support and mutual respect [16,
30]. Consequently, it is likely that there was no association between bridging social capital and depressive state at the baseline.
For associations between changes in social capital and depressive state, changes in bridging social capital were not related to changes in depressive state, while changes in bonding social capital were negatively related to changes in depressive state for both men and women. Only increases in bonding social capital were related to a decrease in depressive state within individ-uals. As mentioned above, bonding social capital may foster the development of a social sup-port system in a community [18,30], which buffers stress [31]. It is likely that an increase in bonding social capital leads to the development of a social support system, which leads to a decrease in the depressive state. On the other hand, bridging social capital refers to “outward-looking” social networks with different members that do not necessarily share similar identi-ties [21]. Such differences could be important for gathering diverse information and obtaining outside assistance for addressing significant challenges [32], which might positively affect mental health. On the other hand, dissimilarities among people in heterogeneous groups might impede improvements in health outcomes by hindering the development of social sup-port and mutual respect [16,30]. Also, dissimilarities could lead to interpersonal conflicts if individuals cannot accept a diversity of social characteristics. Demerits such as these might also negatively affect mental health. Therefore, the positive effects of bridging social capital on mental health might be offset by its negative effects, and therefore, it is possible that changes in bridging social capital were not associated with changes in the depressive state.
Bridging social capital at the baseline did not affect changes in depressive state among men and women. This result supports the previous findings [12,15]. However, bonding social capi-tal at the baseline mostly did not affect changes in depressive state among men and women, which does not support the previous findings [15,18]. This result suggests that it is necessary to focus on not only change in depressive state but also change in social capital. Since most longitudinal studies examined the effect of social capital in the baseline year on depression or change in follow-up years [15], it is not clear whether individuals with higher bonding social capital in the baseline year become less depressive in the follow-up years or whether there is an increase in bonding social capital within individuals which affected a lower depressive state. Our results support the latter. In other words, it suggests that advancing or maintaining bond-ing social capital is important for preventbond-ing depression.
a neighborhood association is an institutionalized organization because there are institutional-ized agreements, a specified structure and enterprises, as well as rules about elections and an account keeping [34,35]. On the other hand, institutionalized agreements and rules do not exist in relationships such as those between family, friends, and workplace colleagues. There-fore, neighborhood associations are more formal relationships than family, friends, and work-place colleagues. Such formal relationships often impose obligations on members to obey group norms, and such obligations often prevent people from expressing their opinions [36,
37]. Moreove people that do not fulfill obligations sometimes experience social exclusion [38]. Therefore, obligations such as these might have a negative influence on mental health [39,40]. As a result, the number of social activities in a neighborhood association might have affected the increase in the depressive state.
In summary, the results showed that increases in bonding social capital were related to a decrease in depressive state within an individual, while a change in bridging social capital was not related to changes in depressive state. However, the results also showed that a certain type of bonding social capital at the baseline affected an increase in depressive state. This study extended knowledge regarding the effect of social capital on depression by indicating that it was important to focus not only on change in depression but also on change in social capital. Furthermore, the present study clarified the dark side of bonding social capital by showing the effect of one type of social capital that increased depression.
This study has some limitations. First, it is not clear whether depressive state decreases because of increases in social capital or social capital increases because of a decrease in depres-sive state. So, future studies are needed to examine the direction of this causality. Second, the K6 (depressive state) mean was very low. According to Kessler et al., the cut-point on the K6 is 13 or more to detect serious mental illness [41]. Thus, the participants in this study might be psychologically distressed, not depressive state. However, Kawakami et al. indicated that the optimal cut-point was 5 or more for screening for depression to prevent suicide [42]. Thus, although our findings are important for preventing some depression, more evidence is needed to judge whether the results in our study can be applied to middle-aged adults with serious depressive disorders. Third, there are several components of the multidimensional concept of social capital that were not captured in this study (e.g., trust, sense of belonging). Although our study constructed social capital measures following the example of previous studies [15,24–
27], it is necessary to examine the effect of social capital including more components on depression to understand the effect more exactly. Finally, factors such as retirement, which affect social capital was not examined in this study. For example, the average age of partici-pants in our study was about 55 years at the baseline. During the nine years of the survey, there must have been some people that retired, and retirement must affect the daily life activities of retired people. Therefore, it is suggested that future studies should examine relationships between social capital and mental health while taking other factors such as retirement into consideration.
Despite these limitations, our study suggests the importance of change in social capital. It is hoped that future studies would take change in social capital as an independent variable into consideration. Moreover, an increase in bonding types of social capital would be effective to decrease a depressive state. These findings may be useful for preventing depression in middle-aged adults in Japan, which may contribute to improving their quality of life.
Supporting information
Author Contributions
Conceptualization:Shin Nakamine, Hirokazu Tachikawa, Miyuki Aiba, Sho Takahashi,
Nanako Tamiya.
Data curation:Shin Nakamine, Hirokazu Tachikawa, Miyuki Aiba.
Formal analysis:Shin Nakamine.
Funding acquisition:Nanako Tamiya.
Methodology:Shin Nakamine, Hideto Takahashi.
Project administration:Hirokazu Tachikawa, Nanako Tamiya.
Supervision:Hirokazu Tachikawa, Haruko Noguchi, Hideto Takahashi, Nanako Tamiya.
Writing – original draft:Shin Nakamine.
Writing – review & editing:Shin Nakamine, Hirokazu Tachikawa, Miyuki Aiba, Sho
Takaha-shi, Haruko Noguchi.
References
1. Gotlib IH, Joormann J. Cognition and depression: Current status and future directions. Annu Rev Clin Psychol. 2010; 27: 285–312.https://doi.org/10.1146/annurev.clinpsy.121208.131305PMID:20192795 2. Murray CJL, Lopez AD. Evidence-based health policy: Lessons from the global burden disease study.
Science. 1996; 274: 740–743.https://doi.org/10.1126/science.274.5288.740PMID:8966556 3. Carney RM, Freedland KE. Treatment-resistant depression and mortality after acute coronary
syn-drome. Am J Psychiatry. 2009; 166: 410–417.https://doi.org/10.1176/appi.ajp.2008.08081239PMID:
19289455
4. Joormann J, Eugène F, Gotlib IH. Parental depression: Impact on offspring and mechanisms underlying transmission of risk. In: Nolen-Hoeksema S, editor. Handbook of Adolescent Depression. New York: Guilford; 2008. pp. 441–471.
5. Wade TJ, Cairney J. Major depressive disorder and marital transition among mothers: Results from a national panel study. J Nerv Ment Dis. 2000; 188: 741–750. PMID:11093376
6. Fiske A, Wetherell JL, Gatz M. Depression in older adults. Annu Rev Clin Psychol. 2009; 5: 363–389.
https://doi.org/10.1146/annurev.clinpsy.032408.153621PMID:19327033
7. Byers AL, Yaffe K, Covinsky KE, Friedman MB, Bruce ML. High occurrence of mood and anxiety disor-ders among older adults. Arch Gen Psychiatry. 2010; 67: 489–496.https://doi.org/10.1001/
archgenpsychiatry.2010.35PMID:20439830
8. Ivan SZ, Koyanagi A, Tyrovolas S, Haro JM. The association of relationship quality and social networks with depression, anxiety, and suicidal ideation among older married adults: Findings from a cross-sec-tional analysis of the Irish Longitudinal Study on Ageing (TILDA). J Affect Disord. 2015; 179: 134–141.
https://doi.org/10.1016/j.jad.2015.03.015PMID:25863909
9. Takeda F, Noguchi H, Monma T, Tamiya N. How possibly do leisure and social activities impact mental health of middle-aged adults in Japan? An evidence from a national longitudinal survey. PLoS ONE. 2015; 10: e0139777.https://doi.org/10.1371/journal.pone.0139777PMID:26431536
10. Ministry of Health, Labour and Welfare. 2014 Summary of patient survey [internet]. Ministry of Health, Labour and Welfare. 2015 [cited 2016 Nov 24]. Available: http://www.mhlw.go.jp/english/database/db-hss/sps_2014.html
11. Ministry of Health, Labour and Welfare. Annual health, labour and welfare report 2016 [internet]. Minis-try of Health, Labour and Welfare. 2016 [cited 2016 Nov 24]. Available:http://www.mhlw.go.jp/wp/ hakusyo/kousei/16/. Japanese.
12. Putnam RD. Bowling Alone: The Collapse and Revival of American Community. New York: Simon and Schuster; 2000.
13. Forsman AK, Nyqvist F, Schierenbeck I, Gustafson Y, Wahlbeck K. Structural and cognitive social capi-tal and depression among older adults in two Nordic regions. Aging Ment Health. 2012; 16: 771–779.
14. Fujiwara T, Kawachi I. A prospective study of individual-level social capital and major depression in the United States. J Epidemiol Community Health. 2008; 62: 627–633.https://doi.org/10.1136/jech.2007. 064261PMID:18559446
15. Oshio T. The association between individual-level social capital and health: Cross-sectional, prospec-tive cohort and fixed-effects models. J Epidemiol Community Health. 2016; 70: 25–30.https://doi.org/ 10.1136/jech-2015-205962PMID:26219887
16. Beaudoin CE. Bonding and bridging neighborliness: An individual-level study in the context of health. Soc Sci Med. 2009; 68: 2129–2136.https://doi.org/10.1016/j.socscimed.2009.04.015PMID:19410346 17. Valencia-Garcia D, Simoni JM, Alegria M, Takeuchi DT. Social capital, acculturation, mental health,
and perceived access to services among Mexican-American women. J Consult Clin Psychol. 2012; 80: 177–185.https://doi.org/10.1037/a0027207PMID:22329824
18. Murayama H, Nishi M, Matsuo E, Nofuji Y, Shimizu Y, Taniguchi Y, et al. Do bonding and bridging social capital affect self-rated health, depressive mood and cognitive decline in older Japanese? A prospective cohort study. Soc Sci Med. 2013; 98: 247–252.https://doi.org/10.1016/j.socscimed.2013.09.026
PMID:24331905
19. Kawachi I, Subramanian SV, Kim D. Social Capital and Health. New York: Springer; 2008. 20. Kawachi I, Takao S, Subramanian SV. Global Perspectives on Social Capital and Health. New York:
Springer; 2013.
21. Szreter S, Woolcock M. Health by association? Social capital, social theory, and the political economy of public health. Int J Epidemiol. 2004; 33: 650–657.https://doi.org/10.1093/ije/dyh013PMID:
15282219
22. Ministry of Education, Culture, Sports, Science and Technology, Ministry of Health, Labour and Welfare. Ethical Guidelines for Epidemiological Research [internet]. National Institute of Public Health. 2002 [cited 2017 Apr 24]. Available:http://www.niph.go.jp/wadai/ekigakurinri/ethical-gl/guidelines.htm 23. Furukawa TA, Kawakami N, Saitoh M, Ono Y, Nakane Y, Nakamura Y, et al. The performance of the
Japanese version of the K6 and K10 in the World Mental Health Survey Japan. Int J Methods Psychiatr Res. 2008; 17: 152–158.https://doi.org/10.1002/mpr.257PMID:18763695
24. Iwase T, Suzuki E, Fujiwara T, Takao S, Doi H, Kawachi J. Do bonding and bridging social capital have differential effects on self-rated health? A community based study in Japan. J Epidemiol Community Health. 2012; 66: 557–562.https://doi.org/10.1136/jech.2010.115592PMID:21172798
25. Kishimoto Y, Suzuki E, Iwase T, Doi H, Takao S. Group involvement and self-rated health among the Japanese elderly: An examination of bonding and bridging social capital. BMC Public Health. 2013; 13: 1189.https://doi.org/10.1186/1471-2458-13-1189PMID:24341568
26. Harpham T, Grant E, Thomas E. Measuring social capital within health surveys: Key issues. Health Pol-icy Plan. 2002; 17: 106–111. PMID:11861592
27. Islam MK, Merlo J, Kawachi I, Lindstro¨m M, Gerdtham UG. Social capital and health: does egalitarian-ism matter? A literature review. Int J Equity Health. 2006; 5: 3.https://doi.org/10.1186/1475-9276-5-3
PMID:16597324
28. Hooper D, Coughlan J, Mullen M. Structural equation modeling: Guidelines for determining model fit. Ele J Bus Res Methods. 2008; 6: 53–60.
29. Daoud N, Haque N, Gao M, Nisenbaum R, Muntaner C, O’Campo P. Neighborhood settings, types of social capital and depression among immigrants in Toronto. Soc Psychiatry Psychiatr Epidemiol. 2016; 51: 529–538.https://doi.org/10.1007/s00127-016-1173-zPMID:26831491
30. Kawachi I, Berkman LF. Social cohesion, social capital, and health. In Berkman LF, Kawachi I, editors. Social Epidemiology. New York: Oxford University Press; 2000. pp. 174–190.
31. Cohen S, Wills TA. Stress, social support, and the buffering hypothesis. Psychol Bull. 1985; 98: 310– 357. PMID:3901065
32. Mitchell CU, LaGory M. Social capital and mental distress in an impoverished community. City Commu-nity. 2002; 1: 199–222.https://doi.org/10.1111/1540-6040.00017
33. De Silva MJ, McKenzie K, Harpham T, Huttly SRA. Social capital and mental illness: A systematic review. J Epidemiol Community Health. 2005; 59: 619–627.https://doi.org/10.1136/jech.2004.029678
PMID:16020636
34. Kikuchi M. What is Chounaikai. Bulletin of Teikyo Sociology. 2002; 15: 63–101. Japanese. 35. Ministry of Internal Affairs and Communications. [What is a residents’ association/ a neighborhood
36. Asch SE. Effects of group pressure upon the modification and distortion of judgments. In Guetzkow H, editor. Groups, leadership, and men: Research in human relations. Oxford, England: Carnegie Press; 1951. pp. 177–190.
37. Deutsch M, Gerard HB. A study of normative and informational social influences upon individual judg-ment. J Abnorm Soc Psychol. 1955; 51: 629–636. PMID:13286010
38. Schachter S. Deviation, rejection, and communication. J Abnorm Soc Psychol. 1951; 46: 190–207. PMID:14841000
39. Paterson CR, Dickson AL, Layne CC, Anderson HN. California psychological inventory profiles of peer-nominated assertives, unassertives, and aggressives. J Clin Psychol. 1984; 40: 534–538. PMID:
6725576
40. Eisenberger NI, Lieberman MD, Williams KD. Does rejection hurt? An fMRI study of social exclusion. Science. 2003; 302: 290–292.https://doi.org/10.1126/science.1089134PMID:14551436
41. Kessler RC, Barker PR, Cople LJ, Epstein JF, Gfroerer JC, Hiripi E, et al. Screening for serious mental illness in the general population. Arch Gen Psychiatry. 2003; 60: 184–189. PMID:12578436 42. Kawakami N, Kondo K, Yanagida K, Furukawa T. [Mental health research regarding taking measures
about suicide prevention in adulthood] [internet]. Ministry of Health, Labour and Welfare grant system. [cited 2016 Nov 24]. Available from:https://mhlw-grants.niph.go.jp/niph/search/NIDD00.do?