sustainability
ISSN 2071-1050www.mdpi.com/journal/sustainability
Article
A Site Selection Model for a Straw-Based Power Generation
Plant with CO
2Emissions
Hao Lv 1,2, Hao Ding 1,2,*, Dequn Zhou 1,2 and Peng Zhou 1,2
1 College of Economics and Management, Nanjing University of Aeronautics and Astronautics,
29 Jiangjun Avenue, Nanjing 210016, China; E-Mails: [email protected] (H.L.); [email protected] (D.Z.); [email protected] (P.Z.)
2 Research Centre for Soft Energy Science, Nanjing University of Aeronautics and Astronautics,
29 Jiangjun Avenue, Nanjing 210016, China
* Author to whom correspondence should be addressed; E-Mail: [email protected]; Tel.:+86-156-5175-6806.
External Editor: Yongrok Choi
Received: 28 August 2014; in revised form: 24 September 2014 / Accepted: 15 October 2014 / Published: 23 October 2014
Abstract: The decision on the location of a straw-based power generation plant has a great influence on the plant’s operation and performance. This study explores traditional theories for site selection. Using integer programming, the study optimizes the economic and carbon emission outcomes of straw-based power generation as two objectives, with the supply and demand of straw as constraints. It provides a multi-objective mixed-integer programming model to solve the site selection problem for a straw-based power generation plant. It then provides a case study to demonstrate the application of the model in the decision on the site selection for a straw-based power generation plant with a Chinese region. Finally, the paper discusses the result of the model in the context of the wider aspect of straw-based power generation.
1. Introduction
Straw-based power generation is a kind of stable and reliable method to utilize co-product energy sources. Bioenergy now makes up most part of the total renewable energy consumption in the world [1]. The total electricity generated from renewable energy in 2012 was 992 TWh (except hydro-power); the electricity generated from biomass was 424 TWh, and it accounts for nearly 9.5% of the whole electricity generated [2].
In China, biomass resources from agriculture and the forestry are quite rich. The total production of straw crop in 2010 was about 720 million tons. It is expected to reach 800 million tons by 2020. The research and appliance of technologies related to biomass utilization are listed as the key scientific research projects continuously in the recent four Five-year Plans of China. By the end of 2013, the cumulative capacity of biomass power generation checked and approved by the Chinese government (checked and approved capacity) was 12,226.21 MW, and the capacity of straw-based power generation connected to the grid (on-grid capacity) reached 7790.01 MW, which accounts for about 63.72% of the total checked and approved capacity. Among the on-grid capacity, agricultural and forestry biomass-based power generation accounted for 53.85%, whose installed capacity was 4195.3 MW [3].
Straw-based power generation is a kind of resource-oriented power generation form, which means that the resource has a great influence on the operation and performance. In richer areas for agriculture and forestry biomass resources, the electricity generation cost could be less, because of economies of scale. Operation is also affected by factors related to the resource endowment and production characteristics of different areas. At present, the total installed capacity in Eastern China is 3514.84 MW, accounting for 45.12% of the whole country. The installed capacities in Central China and the southern area of China are 1438 MW and 1096 MW, respectively [3].
In the operation process of straw-based power generation, the fuel cost takes up more than 60% of the total electricity cost [4]. Compared with traditional energy, the fuel purchasing cost, warehousing cost and transportation expense, which dominate straw-based power generation plants’ fuel cost, are all influenced by the location of the plant. However, currently, most of the studies on straw-based power generation have been concentrated on assessing the technologies and related public policies, and research studies on the location problems are lacking, especially in China. Liuqin Chen discussed the current problems for biomass power generation in China, including the technology problems, the policy problems, and so on [5]. Tianyu Qi et al. adopted the optimized cost calculating methods to analyze the electricity costs of biomass power generation in different provinces and areas in China. They identified the provinces and areas whose electricity costs are less than others [6]. Lin Zhao applied fuzzy synthetic evaluation techniques in her analysis of planning and site selection for straw-based power generation plants to compare the characteristics of different regions and introduced the concept of regional suitability [7].
transporting cost greatly. Zhimei Guo et al. used a conditional logit model (CLM) to make a straw-based power generation plant’s location decision. They assumed that each firm screens locations based on a latent profit function that is dependent on a variety of state attributes where it plans to locate. They use the function πij = β’Xj + μij as the latent profit function, where πij are the expected profits of firm i if
locating the new plant in state j, Xj is a vector of the observable characteristics of state j, β’ is a vector of estimated coefficients and μij is the random disturbance term. According to the model, the economic
benefit of biomass power generation is determined by the decision of the location problem [8].
Traditional solutions of site selection problems include the iterative gravity method and the linear programming method [7–13]. Matt Kocoloski et al. used a mixed-integer program (MIP) to locate ethanol refineries and connected these refineries to biomass supplies and ethanol demands in a way that minimizes the total cost [11]. Cong Dong et al. and Cong Chen et al. introduced the concept of uncertainty into the program method and use a mixed-integer interval program model to solve the location decision for biomass power generation. They replaced the imprecise integer number with the interval to deal with the uncertainties [12,13].Lin Zhao analyzed the cost of the electricity generated from biomass resources [7]. She used an iterative gravity method for biomass power generation that has no candidate sites to obtain the optimal location with the least total cost for a straw-based power generation plant to generate electricity over the whole life cycle.
All of the studies discussed above take the economic benefit optimization as the objective. Based on the traditional theory of project site selection, most of them are conducted by dealing with the optimization of the total electricity cost. Some of them considered the uncertainties of the system and combined methods to deal with these uncertainties with the traditional linear program method to obtain a location model that accords with reality. On the basis of current research, this paper further talks about the objectives of the model. It introduces the objective of the minimization of carbon emissions during the whole life of the project, which is of equal importance to the economic benefit. It gives a multi-objective mixed-integer linear programming model to solve the site selection problem for a straw-based power generation plant and considers the model’s application.
2. The Regional Distribution of Biomass Power Generation in China
The first straw-based power generation plant in China was built in 2006. Since then, straw-based power generation has been growing at a rapid speed. From the end of 2013, the regional distribution of agricultural and forestry biomass power generation is shown in Table 1.
From the perspective of the regional electricity demand distribution, the cumulative annual electricity consumption of the nine provinces takes up about 45.3% of China’s annual electricity consumption. However, the percentage of the nine provinces’ accumulative installed capacity with respect to the whole country is far more than that. Then, it will also cost money to transport electricity from the plant to the whole country. Therefore, we can observe that the biomass power generation’s regional distribution is not in accordance with the regional demand distribution of the electricity.
In Table 1, the regional straw-based power generation’s annual equivalent full load operation hours reflect the utilization efficiency of a straw-based power generation plant’s production ability: the more hours the straw-based power generation can operate annually, the more efficiently the generation’s capacity is used. On the perspective of site selection, the project’s annual equivalent full load operation hours are mostly influenced by the straw fuel’s supply and collection. If the supply of straw is sufficient, the straw-based power generation is expected to operate for many hours, and the utilization of equipment is great. As a result, we can take straw-based power generation’s annual equivalent full load operation hours as an indicator to assess the regional biomass resource supply ability.
Table 1. The agricultural and forestry biomass resource distribution in some regions of China.
Province Electricity consumption
(100 million kWh)
Annual equivalent full load operation
hours (h)
Total installed capacity (MW)
Percentage that this province’s straw resource makes up in
China (%)
Henan 2988 4940 422 10.24%
Shandong 4083 6018 616 9.98%
Heilongjiang 845 4987 465 8.44%
Hebei 3251 5436 218 7.53%
Jiangsu 4956 - 380 5%
Anhui 1528 6166 406 4.76%
Hunan 1423 5396 242 4.63%
Hubei 1629 5157 374 4.27%
Zhejiang 3453 5897 65 1.46%
Others 29,067 - 1007.3 43.51%
Cumulative 53,223 - 4195.3 1
Data resources: National Bureau of Statistics of China, renewable energy database [14], Science and technology education department of Ministry of Agriculture of the People’s Republic of China, 2010. The report on national straw crop resource survey and assessment.
3. Methodology
3.1. Candidate Sites Selection for Straw-Based Power Generation
During the candidate site selection for straw-based power generation, some important factors need to be considered. They are general site requirements, community impacts, environmental impacts, economic impacts and land use impacts.
located near rivers, as it will consume large amounts of water in its operation. The selected site for straw-based power generation should have access to municipal service facilities, such as fire-fighting service and road service, because of the storage and transportation of straw. These are all the general site requirements.
During the site selection, the straw-based power generation plant’s community impacts have to be taken into consideration. Located in areas where people’s attitudes toward straw-based power generation are friendly, the plant’s construction and operation will be smooth. Otherwise, it would come up against many impediments from local residents [7].
The environmental impacts of straw-based power generation plants include the carbon emissions, water pollution and ash [7]. The water pollution and ash can be controlled by specific methods and technologies; while carbon emissions can be minimized during the site selection period of the plant. The straw-based power generation plant should be located in places where the price of straw and the labor costs are both low, to reduce the construction and operation costs. The transportation cost for straw can also be minimized with a reasonable location decision. These economic factors are the most frequently used ones in recent research studies [6–13].
Land occupation is a specific characteristic of straw-based power generation, for it needs large amounts of land to store straw resources. In the location decision of straw-based power generation plants, the land cost would be an important factor. The plants should be located in places with low land costs. Meanwhile, the selected sites need to be open spaces without construction or residences, so that the construction and operation of the plants will not cause the removal and relocation of residents. Another requirement is that straw-based power generation plants should try not to occupy farmland or to take up as little as possible; because the occupation of farmland may influence the farmers’ production, which could causes community impacts.
3.2. Mathematical Model
from the candidate sites in a chosen region. The given region is divided into some sub-regions (see Figure 1). Every sub-region is a straw supplier for straw-based power generation. It then translates the location decision problem of the biomass power generation into a transportation planning problem.
Figure 1. The candidate sites of the biomass power generation and the division of the region.
Note: the number 1 to 5 represents the five sub-regions.
As show in Figure 1, there are three candidate sites for the biomass power generation from which to select. The region can be divided into five sub-regions, and the straw crop collection is in the five sub-regions independently. However, the straw resources can be translated across different sub-regions to a large degree. During the collection process of straw resource in sub-regions, the acquisition range is limited to less than 10 kilometers for the economic benefits. The transportation machines include small-sized agricultural trucks and electro-tricycles. When the straw is transported across the sub-regions, the machines used are usually trucks, whose full load is between 20 tons and 25 tons to minimize the transportation cost.
Here, it is defined that xij (i = 1,2,3…, j = 1,2,3…) is the number of straw resources transported from
sub-region i to site j.
0 1 j y
j1, 2, 3.... When yi = 0, this means that straw-based power generation will not be located in site j. In this scenario, other sub-regions seem not to transport their straw resources to this site and this sub-region (x.j = 0). When yi = 1, this means that in site j, there will be straw-based power generation, so that other sub-regions can transport the straw resources to this site.
Objective 1: optimizing the economic benefit of straw-based power generation. The scale of the plant is given. Here, we assume that in the selected region, the on-grid price of the electricity is determined. Therefore, the optimization of the economic benefit is the same as the minimization of the total cost of the generation.
Mohammad Asadullah assessed the economic benefit of biomass gasification power generation. In the assessment, he pointed out that the cost of biomass gasification power generation contains the initial investment of the plant and the operation and maintenance costs [15]. The operation and maintenance costs of the plant are calculated by summing up the biomass fuel cost, the labor cost and the fossil fuel cost. Daniel G. Wright et al. said that the total cost of biomass power generation is calculated by using the sum of the initial investment, the operation and maintenance cost and the fuel cost minus the sum of the economic incentives and the benefits from supplying heat [16]. Then, they made a mathematical model to calculate the levelized cost of electricity generated from biomass resource. Almost 60% of the unit cost of the electricity generated in the biomass power generation is the biomass fuel cost, including the purchasing price of the straw in the field, the transportation cost, the pre-processing cost and the storage cost [17–21]. Lihuan Chen et al. adopted the activity-based cost method to calculate the straw resources’ transportation cost. They took the straw purchase center belonging to the biomass power generation as the activity center in the study and analyzed the transportation cost of different straw crops in Jiangsu, Henan, Hebei, etc. According to the research, the total transportation cost for the rice straw is 226 RMB yuan/ton, and the total transportation costs for the wheat straw, the corn straw and the cotton straw are 228 RMB yuan/ton, 217 RMB yuan/ton and 192 RMB yuan/ton, respectively [22].
Rogers, J.G. and Brammer, J.G. claimed to set pre-disposing points in the collection field of the biomass resource when analyzing the electricity cost of the biomass gasification power generation [23]. They made a model to estimate the average logistic cost per GJ for a given plant to calculate the total transportation cost of the biomass resources.
As described by Ruiz, J.A. et al., 75% of the transportation cost of the biomass from the temporary acquisition points to the plant is the cost of the trucks, including their purchasing cost, their operation and maintenance costs, the fossil fuel cost, the drivers’ salary, and so on [24]. At the same time, the two key factors that influence the straw’s total transportation cost are the travel distances and the travel durations for the trucks. The travel distance mainly affects the fossil fuel consumption of the truck. Therefore, this has effects on the total transportation cost. Meanwhile, travel duration has a greater influence on the total transportation cost, as it determines the salary paid to the drivers. It seems to be true that the labor cost is the most important factor of the biomass resource’s total transportation cost [25].
We give the empirical function of the total cost of the biomass power generation as Equation (1).
TC = Cinvestment + CO&M + CF − Rincentive (1)
economic level of the selected region and the technology level of the agricultural crops’ harvest. The differences in purchase costs among different sub-regions are so small, that they can be ignored. Therefore, we can reduce the objective of minimizing the total cost of the biomass power generation into the minimization of the total transportation cost of the straw.
The total transportation cost of the biomass power generation contains the cost to transport the straw in the sub-region and the cost to transport the straw from the supplying sub-region to the selected site. The first part of the total transportation cost can be calculated by Equation (2).
transporting,i
C ij
j
x
(2)where λ is the collection cost ratio on the supply side (RMB yuan/ton).
The cost to transport the straw from the supply side to the selected site can be calculated by Equation (3).
,
transport ij ij ij
C x (3)
where αij is the cost to transport per ton of straw from sub-region i to selected site j (RMB yuan/ton).
Objective 1 is then described by Equation (4). Objective 1:
1
min ij ij ij
i j i j
z
x
x(4)
According to Chao Feng and Xiaoxi Ma, burning 100 kg of rice straw directly to generate electricity will emit 164.24 kg CO2, during the transportation of the straw, consume about 0.07 L diesel and emit
nearly 1.7 g CO and 0.03 kg CO2 during the burning process of the straw; it will emit almost 136.77 kg
CO2 [28]. Yin Li and Jing Li analyzed the appliance of the CDM (Clean Development Mechanism)
method’s ACM0006 technique, which is designed to calculate the projects’ real carbon emissions [29]. Amit Thakur et al. listed the energy consumption of related machines when analyzing the total carbon emissions during the full life cycle of forestry biomass power generation. In that study, a truck with a load capacity of 25 tons is the main transportation machine for the biomass resource [30].
The total carbon emissions during the whole life cycle of the biomass power generation mostly comes from the consumption of fossil fuels. Fossil fuels’ consumption usually happens in the straw resource transportation process. Most of the fossil fuels are consumed by the transportation machines and some of the pre-processing machines. The total fossil energy consumption during the whole life cycle of the biomass power generation can be calculated by Equation (5).
sin
_ proces g transporting
Total EnergyEnergy Energy (5)
where Energyprocessing is the fossil energy consumed to pre-process the straw, which is mainly determined by the amount of biomass resources demanded by the plant and the biomass resources’ characteristics.
Energytransporting is the fossil energy consumed during the transportation of the biomass resources, and it is mainly related to the straw fuel’s travel distance. We can calculate the total carbon emissions by multiplying the total energy consumption with the corresponding emission coefficients of the fossil fuels. Therefore, Objective 2 can be described as Equation (6).
Objective 2:
1
min ij ij ij
i j i j
z
x
x(6)
where η is the carbon emission coefficient during the collecting process of the biomass in the sub-regions.
βij is the carbon emission coefficient for transporting the biomass resources between different
sub-regions; it can be described as the carbon emissions from transportation per ton of biomass per kilometer from sub-region i to selected site j.
The constraints of the model include:
(1) Straw fuels collected from the whole region and transported to the selected site of the biomass power generation are sufficient to meet the demand of the straw-based power generation plant to generate the electricity planned. It can be described as Equation (7).
ij j
i
x D y
(7)where D is the annual demand of the straw-based power generation plant, which is only related to the capacity of the plant.
ij i j
x R
(8)where Ri is the amount of biomass resources that can be utilized as the energy resource and that can be collected in sub-region i. It can be calculated by multiplying the total production of straw crop with the use ratio of biomass as energy.
(3) The plant can only choose one site from the candidate sites as its location, and there must be one site to be selected as the result. This can be described as Equation (9).
1 j j
y
(9)In conclusion, we present Equation (10) as the whole model.
1 2
1
min (1 ) z z
2
1
0 1
ij ij ij
i j i j
ij ij ij
i j i j
ij i i ij i j j j w z x x
z x x
x D y
x R y
(10)where φ is the weight of Objective 1. When φ is larger than 0.5, the weight of Objective 1 is larger than Objective 2, vice versa. Through solving this model, we can get the optimal location of the straw-based power generation plant.
4. Case Study and Discussion
129 thousand tons every year. Rugao County can supply about 102 thousand tons every year, and Hai’an County can supply about 90 thousand tons of straw every year. Meanwhile, because there are two counties that are next to these three sub-regions, but outside Nantong (these two counties are Dongtai and Taixing), the total straw production for them is 1.33 million tons and 0.98 million tons, respectively. Their straw supply ability is, respectively, 133 thousand tons and 98 thousand tons. The distances between the sub-regions and the other coefficients related to the system can be found in Table 3.
Assume that crop straw is collected and transported in the sub-region mainly by small agricultural machines whose load abilities are less than 10 tons; the machines used to transport the straw from the sub-regions to the biomass power generation plant are trucks with load abilities between 20 tons and 25 tons. During the collecting process of the straw in the sub-regions, the cost coefficient for the transportation is about 1.5 RMB yuan/(ton·km), and the energy consumption coefficient and carbon emission coefficient for the transportation are almost 0.15 L/(ton km) and 0.24 kgC/(ton km), respectively. When the straw is transported from the sub-regions to the plant side, the cost coefficient for the transportation is nearly 1 RMB yuan/(ton km); the fossil energy consumption coefficient and carbon emission coefficient for the transportation are nearly 0.02 L/(ton km) and 0.03 kgC/(ton km), respectively [4,27,32].
Table 2. The cultivated area and crop production in the sub-regions of Nantong.
Sub-region
The grain plantation area
(1000 ha)
The production of the crops (10,000 tons)
The cotton plantation area
(1000 ha)
The production of cotton (tons)
The total production of biomass straw
˄10,000 tons˅
Municipal
area 92.2 59.53 6.78 7535 84.6
Hai’an
County 79.19 64.43 0.14 171 90.4
Rugao
County 110.53 72.81 0.21 200 102.2
Rudong
County 131.87 90.8 12.55 17,281 129.8
Haimen
County 40.97 17.83 11.43 12,859 26.8
Qidong
County 70.85 24.09 14.73 16,349 36.2
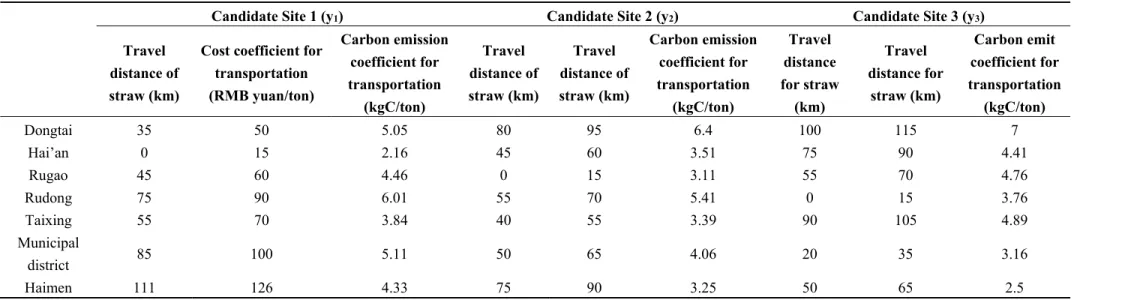
Table 3. The parameters related to this case.
Candidate Site 1 (y1) Candidate Site 2 (y2) Candidate Site 3 (y3)
Travel distance of straw (km)
Cost coefficient for transportation (RMB yuan/ton)
Carbon emission coefficient for transportation
(kgC/ton)
Travel distance of straw (km)
Travel distance of straw (km)
Carbon emission coefficient for transportation
(kgC/ton)
Travel distance for straw
(km)
Travel distance for
straw (km)
Carbon emit coefficient for transportation
(kgC/ton)
Dongtai 35 50 5.05 80 95 6.4 100 115 7
Hai’an 0 15 2.16 45 60 3.51 75 90 4.41
Rugao 45 60 4.46 0 15 3.11 55 70 4.76
Rudong 75 90 6.01 55 70 5.41 0 15 3.76
Taixing 55 70 3.84 40 55 3.39 90 105 4.89
Municipal
district 85 100 5.11 50 65 4.06 20 35 3.16
Haimen 111 126 4.33 75 90 3.25 50 65 2.5
According to the assumptions presented above and the model given in this paper, we present results as shown in Table 3, making the number of φ 0.5. The minimum transportation cost of the plant is estimated to be about 8735 thousand RMB yuan. The price of straw at the plant is nearly 200 RMB yuan/ton. The total carbon emission during the transportation is about 963.04 ton C (carbon). Candidate Site 3 is the best choice for the straw-based power generation plant to be built. Therefore, the electric power group should build the straw-based power generation plant at the candidate site in Rudong County to get the best economic benefits and the least carbon emissions.
Table 4. The result of the model for the case study (units: 10,000 tons). Candidate Site 1
(y1 = 0)
Candidate Site 2 (y2 = 0)
Candidate Site 3 (y3 = 1)
Dongtai x11 = 0 x12 = 0 x13 = 0
Hai’an x21 = 0 x22 = 0 x23 = 0
Rugao x31 = 0 x32 = 0 x33 = 3.1
Rudong x41 = 0 x42 = 0 x43 = 12.9
Taixing x51 = 0 x52 = 0 x53 = 0
Municipal District x61 = 0 x62 = 0 x63 = 8.4
Haimen x71 = 0 x72 = 0 x73 = 2.6
The demand of the site D1 = 0 D2 = 0 D3 = 27
Compared with the model given by Matt Kocoloski et al., in which the optimal site for the straw-based power generation plant in this case is also Site 3, the model presented in this paper considers the impacts of carbon emissions. In these two models’ results, Site 1 is preferable to Site 2. However, if taking Objective 2 as the only objective of the model, we would choose Site 2 as the optimal selection for the plant. When the weight of Objective 1 (φ) is less than 0.4 in this case, Site 2 would be preferable to Site 1 by the results of our model.
One of the key parameters having an influence on the total cost of the straw-based power generation plant is the price of straw. Take the municipal district as an example. The price of straw could be higher than other sub-regions. When the price of straw in the municipal district is 25 RMB yuan/ton higher than those in other sub-regions, the optimal site will remain as Site 3. When the price of straw in the municipal district is 26 RMB yuan/ton higher than in other sub-regions, the optimal site will be Site 1.
5. Conclusions
Biomass power generation is currently a mature and reliable technology for utilizing this renewable energy source. A biomass power generation plant’s economic benefit and carbon emission are both influenced by the supply of straw fuel. Without sufficient straw supply, the plant’s performance may be quite poor, the economic benefit may be negative and the carbon emissions may be larger than expected. This problem can be avoided by the location decision of the plant. This paper studied a solution to site selection for a biomass power generation plant. It introduces the objective of minimizing the total carbon emissions into the traditional site selection model. A linear multi-objective integer program model was then developed to get the best location for the plant. Through the case study, an example shows how to apply the model to make the location decision. We find that when the weight of the carbon emission optimization objective is large enough, the results of our model will be different from those of models considering only economic benefits. This further demonstrates that carbon emissions really have a great influence on the site selection of the straw-based power generation plant. We also find from the results that the transportation of straw between sub-regions has more influence on the straw-based power generation total cost and total carbon emissions than the straw’s collection and transportation in sub-regions. This conclusion also demonstrates that the straw acquisition range is a determining factor for the straw-based power generation plant’s performance. During the location decision, we need to take full consideration of the straw fuel supply abilities of the sub-regions.
Acknowledgment
The authors gratefully acknowledge the financial support provided by the Natural Science Foundation of China (No. 71203151 and 71373122), the Jiangsu Natural Science Foundation for Distinguished Young Scholar (No. BK20140038), the Ph.D. Programs Foundation of the Ministry of Education of China (No. 20123218110028), the NUAA fundamental research fund (No. NE2013104), and the major project in college’s key research base for Philosophy and Social Science in Jiangsu Province (No. 2010JDXM012).
Author Contributions
All of the authors made contributions to the work in this paper. Hao Lv proposed the idea and partly contributed to the model development. Hao Ding contributed to model development, data collection and analysis. Dequn Zhou contributed to policy analysis and formulation. Peng Zhou provided guidance for writing this paper. Hao Lv and Hao Ding were the main authors for the writing of this paper.
Conflicts of Interest
References
1. World Energy Council (WEC). World Energy Resources (2013 survey). Available online: http://www.worldenergy.org/publications/2013/world-energy-resources-2013-survey/ (accessed on 24 September 2014).
2. International Energy Agency (IEA). World Energy Outlook 2013-Chapter 6: Renewable Energy Outlook. Available online: http://www.worldenergyoutlook.org/publications/weo-2013/ (accessed on 24 September 2014).
3. China Renewable Energy Engineering Institute, China National Renewable Energy Center. Statistic Report on China’s Biomass Power Generation Development in 2013; China Renewable Energy Engineering Institute & China National Renewable Energy Center: Beijing, China, 2014.
4. Zhang, Q.; Zhou, D.Q.; Zhou, P.; Ding, H. Cost Analysis of Straw-based Power Generation in Jiangsu Province, China. Appl. Energy2013, 102, 785–793.
5. Chen, L. Analysis on the problems of biomass power generation power generation in China.
Decision-Making Consult.2012, 1, 18–24. (In Chinese)
6. Qi, T.; Zhang, X.; Ou, X.; Liu, Z.; Chang, S. The regional cost of biomass direct combustion power generation in China and development potential analysis. Renew. Energy Resour.2011, 29, 115–124. (In Chinese)
7. Zhao, L. Research of Planning and Site Selection Method of Straw Burning Power Plant. Master’s Thesis, North China Electric Power University, Beijing, China, 2012.
8. Guo, Z.; Hodges, D.G.; Young, T.M. Woody biomass policies and location decisions of the woody bioenergy industry in the southern United States. Biomass Bioenergy2013, 56, 268–273.
9. Leduc, S.; Schwab, D.; Dotzauer, E.; Schmid, E.; Obersteiner, M. Optimal location of wood gasification plants for methanol production with heat recovery. Int. J. Energy Res. 2008, 32, 1080–1091.
10. Shabani, N.; Sowlati, T. A mixed integer non-linear programming model for tactical value chain optimization of a wood biomass power plant. Appl. Energy2013, 104, 353–361.
11. Kocoloski, W.M.; Griffin, H.M.; Matthews, S. Impacts of facility size and location decisions on ethanol production cost. Energy Policy2011, 39, 45–76.
12. Dong, C.; Li, W.; Li, Y.; Xie, Y.; Cui, L. Establishment of optimization model for location of biomass power plants and its application. Acta Energy Sol. Sin.2012, 33, 1732–1737. (In Chinese) 13. Chen, C.; Li, W.; Li, Y.; Zhu, Y. Biomass power plant site selection modeling and decision
optimization. Trans. CSAE2011, 27, 255–230. (In Chinese)
14. Renewable Energy Database. National Bureau of Statistics of China. Available online: http://red.renewable.org.cn:9080/RED/index.action (accessed on 28 August 2014).
15. Asadullah, M. Biomass gasification gas cleaning for downstream applications: A comparative critical review. Renew. Sustain. Energy Rev.2014, 40, 118–132.
16. Wright, D.G.; Dey, P.K.; Brammer, J. A barrier and techno-economic analysis of small-scale Bchp (biomass combined heat and power) schemes in the UK. Energy2014, 71, 332–345.
18. Wang, X.; Cai, Y.; Dai, C. Evaluating China’s biomass power production investment based on a policy benefit real options model. Energy2014, 73, 751–761.
19. Algieri, A.; Morrone, P. Techno-economic analysis of biomass-fired ORC systems for single-family combined heat and power (CHP) applications. Energy Procedia2014, 45, 1285–1294.
20. Bouchard, S.; Landry, M.; Gagnon, Y. Methodology for the large scale assessment of the technical power potential of forest biomass: Application to the province of New Brunswick, Canada.
Biomass Bioenergy2013, 54, 1–17.
21. Nikolaos, G.T.; Petros, A.P.; Apostolos, L.P. An economic comparison assessment of lignite and biomass IGCC power plants. Appl. Therm. Eng.2012, 38, 26–30.
22. Chen, L.; Li, Y.; Ding, W.; Liu, J.; Shen, B. Analysis on straw logistics cost of direct-fired power generation using activity-based costing. Trans. CSAE2012, 28, 199–203. (In Chinese)
23. Rogers, J.G.; Brammer, J.G. Analysis of transport costs for energy crops for use in biomass pyrolysis plant networks. Biomass Bioenergy2009, 33, 1367–1375.
24. Ruiz, J.A.; Juárez, M.C.; Morales, M.P.; Muñoz, P.; Mendívil, M.A. Biomass logistics: Financial & environmental costs. Case study: 2 MW electrical power plants. Biomass Bioenergy 2013, 56, 260–267.
25. Delivand, M.K.; Barz, M.; Gheewala, S.H. Logistics cost analysis of rice straw for biomass power generation in Thailand. Energy2011, 36, 1435–1441.
26. Cao, G.; Zhang, X.; Wang, Y.; Zheng, F. Estimation of regional carbon emissions from the crop straw’s open firing in agriculture field in China. Chin. Sci. Bull.2007, 52, 1826–1831.
27. He, Z.; Wu, C.; Yin, X. Carbon cycle analysis of biomass power generation system. Acta Energiae Sol. Sin.2008, 29, 705–710. (In Chinese)
28. Feng, C.; Ma, X. Life cycle assessment of the straw generation by direct combustion.
Acta Energ. Sol. Sin.2008, 29, 711–715. (In Chinese)
29. Li, Y.; Li, J. A study on calculation method of carbon emission in power generation with biomass.
Energy Environ. Prot.2012, 26, 5–8. (In Chinese)
30. Amit, T.A.; Canter, C.E.; Kumar, A. Life-cycle energy and emission analysis of power generation from forest biomass. Appl. Energy2014, 128, 246–253.
31. Zhang, Q.; Zhou, D. Analysis on Present Situation of Generating Electricity by Burning Straw in Jiangsu Province. China Soft Sci.2010, 10, 104–111. (In Chinese)
32. Rentizelas, A.A.; Tolis, A.J.; Tatsiopoulos, I.P. Logistics issues of biomass: The storage problem and the multi-biomass supply chain. Renew. Sustain. Energy Rev.2009, 13, 887–894.