A study on depletion of the upper stratospheric ozone in the
Antarctic from Umkehr ozone profile
Koji Miyagawa
DOCTOR OF
PHILOSOPHY
Department of Polar Science
School of Multidisciplinary Science
The Graduate University for Advanced Studies
2010
A study on depletion of the upper stratospheric ozone in the Antarctic
from Umkehr ozone profile
By
Koji Miyagawa
Aerological Observatory, Japan Meteorological Agency
1-2 Nagamine, Tsukuba, Ibaraki 305-0052, Japan
Ph. D. Thesis
Department of Polar Science
School of Multidisciplinary Science
The Graduate University for Advanced Studies
2010
III
Table of Contents
ACKNOWLEDGMENTS ... 1
ABSTRACT ... 2
GENERAL INTRODUCTION ... 5
REFERENCES ... 12
CHAPTER 1 ... 14
REEVALUATION OF LONG-TERM UMKEHR DATA AND OZONE PROFILES AT JAPANESE STATIONS... 15
Abstract ... 15
1. Introduction ... 15
2. Data ... 16
3. Reevaluation of N-value ... 17
3.1 Shift correction of N-value ... 19
3.2 SZA correction of N-value ... 19
3.3 Total ozone correction of N-value ... 21
4. Validation of retrieved ozone profile ... 21
4.1 Effects of N-value reevaluation on derived ozone profiles ... 21
4.2 Effects of the retrieval algorithm on derived ozone profiles ... 21
4.3 Comparison with ozonesonde and with ozone lidar profile ... 24
4.4 Comparison in time series profile ... 24
4.5 Comparison of profiles profile ... 29
4.6 Long-term ozone trend profile ... 29
5. Conclusions ... 29
Acknowledgments ... 34
References ... 34
CHAPTER 2 ... 36
VERTICAL OZONE PROFILE BY UMKEHR MEASUREMENTS AT SYOWA STATION ... 37
Abstract ... 37
1. Introduction ... 37
2. Data ... 38
3. Results ... 38
4. Conclusions ... 44
Acknowledgments ... 46
References. ... 46
CHAPTER 3 ... 48
LONG-TERM OZONE TRENDS IN UMKEHR MEASUREMENTS AT JAPANESE STATIONS ... 48
Abstract ... 49
1. Long-term variations ... 51
2. Discussion and Conclusion ... 55
Acknowledgments ... 55
References ... 55
Supplement: Ozone and temperature changes in the upper stratosphere ... 56
GENERAL SUMMARY ... 60
ANNEX A: Reference papers on ozone depletion………. 1
A-1 Ozonesonde measurements at Syowa Station (69°00'S, 39°35E); Preliminary result ………..3
A-2 Depletion of Antarctic Ozone: Height of Ozone Lose Region and its Temporal Changes ……….15
A-3 Re-evaluation of long-term Dobson Umkehr N-data by intercomparison………..21
A-4 Ozone Decrease in 1998/99 Winter and Spring around 23 km over Japan……….25
A-5 Apparent stratospheric ozone loss rate over Eureka in 1994/95, 1996/96, and 1996/97 inferred from ECC ozonesonde observations………37
B: Publication papers on the Dobson international-standards automatic observation system development for the high precision of Umkehr measurement……….. 55
B-1 Development of automated measuring system for Dobson ozone Spectrophotometer….57 B-2 Upgraded automatic Dobson ozone spectrophotometer with Windows PC for ozone observation network in Japan……….63
B-3 Upgrading of Automated Dobson Spectrophotometers Windows System -Transition to Compact-PCI Controlled System (WINDOBSON 2006)-……….…67
B-4 Introduction of Zenith Sky Cloud Detector for Umkehr Measurement in Dobson Spectrophotometer………..83
1 Acknowledgments
I express my heartfelt thanks to Dr. Irina Petropavlovskikh of CIRES/ESRL
(Cooperative Institute for Research in Environmental Sciences , University of Colorado),
and Dr. Robert D. Evans of NOAA/OAR/ERSL (National Oceanic and Atmospheric
Administration, Oceanic and Atmospheric Research, Earth System Research Laboratory) for
their valuable comments and discussions throughout this work.
I am much obliged to Professor Takashi Yamanouchi of National Institute of Polar
Research for guidance throughout this dissertation. I also would like to thank Professor
Yasunobu Iwasaka of Kanazawa University for discussion with the Antarctic ozone
depletion. I also thank Head Yukio Makino of former the Meteorological Research Institute,
Dr. Shigeru Chubachi of Chiba Institute of Science, Professor Makoto Wada and Professor
Yoshihiro Tomikawa of National Institute of Polar Research for their help and discussions.
I would like to thank the World Ozone and UV radiation Data Centre (WOUDC)
for the ozone data and the Network for the Detection of Atmospheric Constituent Change
(NDACC) for providing an access to the lidar. In addition I also thank the member of
Japanese Antarctic Research Expedition, and Ozone Layer Monitoring Office / Japan
Meteorological Agency for the continuous long-term ozone field observations.
ABSTRACT
Long-term measurements of the total ozone by ground-based and satellite instruments show a large decrease from the 1980s to the middle of 1990s over mid-high latitude. A
record-breaking depletion of the ozone layer over the Antarctic region was observed during the springtime in 2006. The principal causes of ozone destruction are attributed to the ozone-depleting substances (ODS) including chlorofluorocarbon compounds (CFCs). Inside the polar vortex the ozone destruction rate is accelerated through complicated heterogeneous chemical reactions under the atmospheric condition with extremely low stratospheric temperature. Ozone observation in the upper stratosphere has been globally (about 60N-60S latitude) made by various satellites (SAGE: Stratospheric Aerosol and Gas Experiment, SBUV: Solar Backscatter Ultraviolet, HALOE: Halogen Occultation Experiment) since 1979. The long-term trend of ozone decrease is enhanced at higher latitude, and that decrease is larger in the Southern Hemisphere than the Northern Hemisphere.
The Dobson ozone spectrophotometer is the primary ground-based instrument making measurements of stratospheric ozone. The Umkehr observations made prior to the satellite measurements gave highly valuable information on the past vertical distribution of ozone in the atmosphere that guided the current understanding of changes in stratospheric ozone. The Umkehr observations made now provide a baseline to augment the various satellite measurements. However, the problem of the shift error related to replacement of the instrument at a station is known from the long-term Umkehr N-value (intensity ratio) measurement record archived in the World Ozone and Ultraviolet Data Centre (WOUDC) in Toronto, Canada. With regards to the issue of uncertainty of the long-term Umkehr ozone profile dataset, we investigate various measurement errors such as the N-value shift, and discuss a long-term record of ozone depletion over Antarctica. Multiple shifts in the Japanese network Umkehr data record have been associated with instrument replacements. Therefore, N-value data were reevaluated based on instrument intercomparisons. The newest UMK04 (Umkehr Retrieval Algorithm 2004) ozone profile retrieval algorithm is applied in the processing of all reevaluated N-value time-series. The UMK04 provides a profile Averaging Kernel that is applied to other independent observational data for vertical smoothing, and helps to minimize vertical-resolution related differences in data comparisons. The reprocessed Umkehr profile dataset is analyzed for the long-term trend change in troposphere and through the entire stratosphere. It is found that the upper stratospheric ozone level over the Antarctic station Syowa (69.0S, 39.6E) stayed consistently low since 1990s. Extremely low values can be seen in the record over the last few years. On the other hand the international automation observation system was developed, which is
dedicated to the long-term observation, while making reliable measurements at many atmospheric conditions with high quality of operational Umkehr data acquisition in the springtime. The outline of the paper in each chapter is shown as the following.
In Chapter 1, the issue of ambiguity in the Umkehr calibration process that affects retrieved ozone vertical profiles is investigated for each station. Although well-maintained Umkehr data
3
record is considered a valuable source of information of long-term changes in the ozone vertical profile, the Umkehr record at Japanese stations has obvious shifts. Majority of the shifts are related to the exchange of instruments for calibration (for total ozone measurements) and the replacement of Shimatzu instruments by Dobson ozone spectrophotometers. N-value data were recently reevaluated based on the results of instrument intercomparisons. The data analysis revealed systematic errors that depend on solar zenith angle, total ozone, and other instrumental factors. The quality and error of ozone profile retrieved with the newest algorithm (UMK04) is investigated. The difference in the results depends on the deployed retrieval algorithm (UMK92 vs. UMK04), where UMK04 uses non-varying monthly averaged ozone profile for a priori, while the UMK92 algorithm uses the a priori ozone profile that has total ozone dependency. The Umkehr Averaging Kernel (AK) is applied to other independent observational data to vertically smooth highly resolved ozone profiles such as available from balloon borne instruments (Ozonesonde soundings) or lidar measurements. The results show that the revised Umkehr ozone profiles show improved consistency with both types of ozone observations as compared to the old datasets, especially with regards to ozonesonde
observations (difference of less than 5%). The reprocessed Umkehr profile data set is used for trend analysis. This analysis shows decrease of upper stratospheric ozone layer derived from the Antarctic Umkehr observation taken over Syowa station for the last 30 years, since 1977.
In Chapter 2, we present vertical ozone profiles from Dobson Umkehr measurements conducted at Syowa station in Antarctica since 1977. Introduction of highly automated measuring system to the Dobson instrument in 1994 at Syowa resulted in high quality data acquisition of Umkehr measurements. Short Umkehr measurement (A, C, and D pairs) has been routinely
conducted at Syowa, with the exception of the polar summer when solar zenith angle is too small. In this study we discuss features of reevaluated N-value record at Syowa and the UMK04 retrieved ozone profiles. In the ozone record analysis, seasonal variation, effects of solar activity, QBO and aerosol, etc. signals are removed from the data. From 1977 to 2007, the springtime ozone values in layers 8 and 9 showed decrease of 9.6%/decade, and the layer 4 ozone shows decrease at
16.6%/decade. The ozone hole in 2006 developed to the largest size ever observed, and at Syowa total ozone of 114 DU was recorded. This is the lowest total ozone value since the beginning of observation in 1977. The Umkehr measurements also show extremely low ozone amount in all layers above Syowa. Especially, the record low ozone (close to complete ozone destruction) is found in layer 4 on September 27, 2006 and in layer 3 on October 15.
In Chapter 3, we discuss a long-term ozone trend determined from the newly re-processed Umkehr ozone profiles at Japanese stations. The long-term trend in upper stratospheric ozone from 1977 to 2008 is assessed, whereas the seasonal variation, effects of solar activity, QBO and aerosol, etc. are accounted for. Long-term variations of UMK04 retrieved ozone in the combined layer 8+ (8, 9 and 10) are shown for Sapporo, Tsukuba, Naha and Syowa stations. Linear trends for two time periods, prior to 1996 (from 1970 or 1977 till 1996) and after (1996-2008), are also shown for each station. Trend analyses suggest a significant decrease in the upper stratosphere over Japan during the 1980s. The upper stratospheric ozone levels at Tsukuba Station have shown a steady increase at 5%/decade rate after 1996. At the same time, a 7.7%/decade decrease in ozone is found in Umkehr
data taken at Sapporo Station, which indicates an even stronger ozone depleting rate as compared to ozone depletion rates prior to 1996. Over the Antarctic Syowa station, upper stratospheric ozone has been at the lowest level since 1990s. Especially low values can be seen in the last few years.
Observed difference in the upper stratospheric ozone changes among several stations may be
exhibiting the latitude dependence of ozone depletion. In order to assess the linear long-term trend in ozone over the Antarctic Syowa station, we conducted analysis of data collected during the first half (from 1977 to 1996) and the second half (from 1996 to 2008) of the record, and also separated data in austral springtime (from September to November) and summer (from December to March) seasons. The years 1988 and 2002 that had episodes of large-scale stratospheric sudden warming were removed prior to analysis. The result of the upper stratosphere analysis is the following. The long-term trend of annual average (springtime and summer), during the first half is -7.9%/decade, while during the second half the Syowa record shows decrease at -5.2%. When the long-term trends of stratospheric ozone are compared between the springtime and summer seasons, the decrease in the first half of the record is found to be slightly larger in the summer than in the springtime, while in the second half of the record the springtime trend decreases even further, whereas the summer trend is leveled out. As one of the characteristics of the Syowa record, a linear trend tends to flatten out in the 1996-2005 time period after a significant decrease in 1977-1996, although recent data show a decreasing trend again. The result of lower stratosphere is the following. The long-term trend in the annual averaged ozone data appears to decrease rapidly in the first half (-31.9%/decade) of the record, while it shows much smaller decrease in the second half (-5.1%/decade). The seasonally separated long-term trends show the strongest decrease in low stratospheric ozone in the springtime of the first half (-35.3%/decade) and still significant decrease in the second half (-17.5%/decade), whereas the summer time ozone does not show any long-term changes in both the first and second halves of the record.
In this paper, we considered the ozone and temperature changes in the upper stratosphere using the re-analysis station data of NCEP/NCAR (National Centers for Environmental Prediction / National Center for Atmospheric Research) and JRA-25 (Japanese Re-Analysis 25 years). The main characteristics from 1992 to 2008 are as follows.
(1) In the late spring (October and November) when the solar elevation angle in the Antarctic region is higher, the clear negative correlation between ozone and the monthly mean temperature variability at 100 hPa and 5 hPa is shown.
(2) The monthly averages of the ozone (layer 8) and temperature (at 5 hPa atmospheric pressure level) for the month of November show high correlation (correlation coefficient is 0.9) between a decline of temperature, and the increase in ozone.
(3) This suggests the relation of temperature dependence (about 2%/1 degree C) to the ozone change in the upper stratosphere (about 40 km in height).
The impact of the Montreal protocol is already seen in mid-latitude ozone, whereas the ozone change relevant to ODS in the upper stratosphere has not been observed due to the ODS still in transport to the Antarctic region.
5 GENERAL INTRODUCTION
The ozone hole was originally discovered by the Japanese researcher [Chubachi; 1984] in the 1980s, and depletion of ozone has accelerated rapidly after that. In 1974, Molina and Roland [1974] predicted depletion of ozone layer by the photochemical reaction with the man-made CFCs, which were transported to the stratosphere (height of about 40 km). In the upper stratosphere, ozone destruction occurs through the gas phase catalytic reaction with chlorine atom. On the other hand, ozone depletion in the lower stratosphere (height of about 15 km) takes place through the heterogeneous reaction on the surface of polar stratospheric cloud (PSCs: Polar Stratospheric Clouds) [Solomon et al., 1986]. PSCs contain particles of water vapor (H2O), nitric acid (HNO3), and sulfuric acid (H2SO4), created under the specific climate condition (low temperature) in the Antarctic region. The ozone layer where the depletion was first discovered has recently shown a sign of recovery beginning in 1997 as a result of the Montreal Protocol initiated control of CFCs [Newchurch et al., 2003]. Although the first stage of ozone recovery described as a slowdown of an ozone reduction has been already observed, the second stage of the statistically significant ozone increase has not yet been reached [WMO, 2007]. Even at the current stage of enhanced control of CFCs production, the Antarctic region shows a delay in ozone recovery as
compared to the mid-low latitude trends. Therefore, good surveys of the continuous data in ground-based observations, especially observation of high quality are required. The major concern is that global warming will affect depletion of the ozone layer.
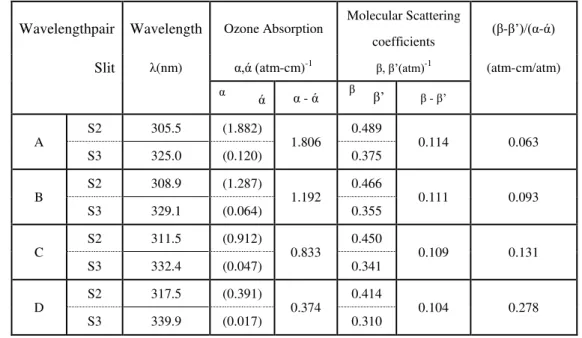
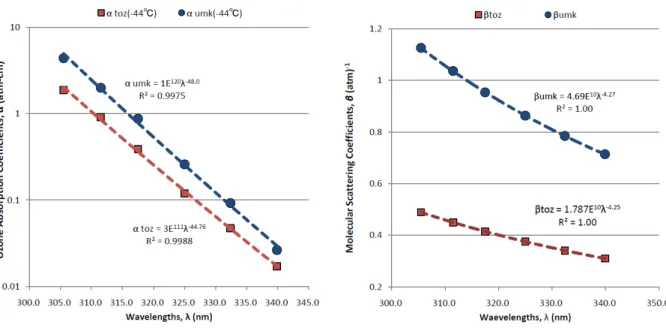
The Dobson ozone spectrophotometer was developed in the mid-1920s to measure stratospheric ozone, to assist in investigations of atmospheric circulation. The Dobson instrument and the method of operation are well documented [Dobson, 1931; Evans, 2008]. The Dobson's optical system is shown in Figure 1. The instrument measures the differential intensity of Solar light at selected wavelength pairs (traditionally called A, C, and D) in the ultraviolet spectral region. Table 1 shows ozone absorption and molecular scattering coefficients selected for Dobson measurements following the recommendation of the International Ozone Commission (IOC) in 1992. The molecular scattering coefficients β is proportional to a wavelength as λ-4.27. The ozone absorption and molecular scattering coefficients for Total ozone and Umkehr retrieval algorithm are shown in Figure 2. Additional valuable information describing the accuracy of Dobson spectrophotometer observations is published by Dobson and Normand [1962]. The instruments remain the same optically, but advances in electronics and computer data acquisition and control have improved quality of data collection by automated instruments.
The Dobson ozone spectrophotometer is used in order to produce not only a measurement of total ozone amounts but an ozone vertical profile. The Umkehr technique has been used since the 1930s [Götz et al., 1934] to estimate the vertical ozone profile from zenith sky measurements. The radiances are taken by the Dobson spectrophotometer [Dütsch, 1959] at a pair of wavelengths Ultra Violet wavelengths (C-pair band-passes are centered at 311.5 and 332.4 nm). Gradual changes in the radiance ratio with sun elevation including reversal of the slope at ~85 degrees solar zenith angles are called the “Umkehr curve”. A standard Umkehr observation consists of a series of C-pair wavelength measurements made under the
clear zenith sky conditions during a morning or an afternoon. The Umkehr curve measurements are related to the effective scattering height in the atmosphere that depends on the wavelengths at which observations are made (See Figure 3). In the standard Umkehr data for C wavelength pair processing the intensity NC value is recorded at specific solar zenith angles (60°, 65°, 70°, 74°, 75°, 77°, 80°, 83°, 84°, 85°, 86.5°, 88°, 89°, and 90°). The Umkehr technique has an advantage of not requiring the absolute radiation calibration in order to infer ozone profile information. The ground-based Umkehr method technique is very similar to the satellite backscatter ultraviolet (BUV) technique. Currently,
measurements of the Umkehr observations are made routinely by automated Dobson spectrophotometers at a number of stations, primarily in the United States’, Europe, and Japanese networks. Also, the JMA developed the international automation observation system, which is aimed at the long-term observation, maintaining stable and high quality data acquisition of Umkehr observation (See Annex B).
Table 1. Ozone absorption and molecular scattering coefficients for use with Dobson ozone Spectrophotometers beginning on 1 January 1992, where α and ά is ozone absorption cross-section recommended by the IOC letter in 1967.
Wavelengthpair Wavelength Ozone Absorption
Molecular Scattering
coefficients (β-β’)/(α-ά) Slit λ(nm) α,ά (atm-cm)-1 β, β’(atm)-1 (atm-cm/atm)
α ά α - ά β β’ β - β’
A
S2 305.5 (1.882)
1.806
0.489
0.114 0.063
S3 325.0 (0.120) 0.375
B
S2 308.9 (1.287)
1.192
0.466
0.111 0.093
S3 329.1 (0.064) 0.355
C
S2 311.5 (0.912)
0.833
0.450
0.109 0.131
S3 332.4 (0.047) 0.341
D
S2 317.5 (0.391)
0.374
0.414
0.104 0.278
S3 339.9 (0.017) 0.310
7
Figure 1. Optical system of the Dobson Spectrophotometer [Evans, 2008]
Figure 2. Ozone absorption and molecular scattering coefficients for the total ozone and Umkehr observation by Dobson Spectrophotometer.
Figure 3. Umkehr C-curve taken from measurement
Figure 4. Umkehr retrieval ozone profile in 16-layers from Figure 3.
9
The long-term trend in ozone profiles is estimated for each station. Profiles are derived by the UMK04 algorithm [Petropavlovskikh et al., 2005b]. The development of the Umkehr retrieval (UMK04) has played an important role for the monitoring of the SBUV derived ozone drifts and cross calibration of the BUV instrument [Fioletov et al., 2006; Petropavlovskikh et al., 2005a]. The forward model of the algorithm simulates Umkehr measurements based on the first-guess ozone profile, while inverse model uses a maximum likelihood estimation procedure and is based on Rodgers [2000], optimum estimation method, also used in the UMK92 retrieval [Mateer and DeLuisi, 1992]. The forward model is configured for 61 atmospheric layers with specified optical properties (including ozone absorption and molecular scattering) to simulate Umkehr curve. The ozone profile retrieval of the inverse method is also done at higher resolution, which is consistent with the vertical resolution of the forward model, and effectively eliminates interpolation errors embedded in the UMK92 code. The vertical profiles retrieved from two Umkehr measurements are shown as function of 16 Umkehr layers in Figure 4. The 61 and 16 layer systems are explained in Figure 5 and Table 2.
The Umkehr measurements, along with satellite and lidar measurements have robust information about ozone variability in the 40-km region, which is above the level at which the typical ozonesonde balloon bursts. Numerous studies have addressed accuracy of the ozone vertical distribution by Umkehr observation. The REVUE (REconstruction of Vertical ozone distributions from Umkehr Estimates) project of European Commission and World Meteorological Organization (WMO) was established to evaluate the role and results of Umkehr observations. In this project, continuity and
consistency of Umkehr data of more than 40 years were analyzed [Godin et al., 2000; Bojkov et al., 2002]. Petropavlovskikh et al. [2001] showed that discontinuities found in Umkehr data worsen the quality of retrieved ozone profile and proposed the statistical way to correct shift error that also show SZA dependency. Using this method, Bojkov et al. [2002] reevaluated Umkehr data from many stations including Japanese stations. In Japanese Dobson network, a field instrument at each station had been frequently replaced by a different instrument in the network. Discontinuities or errors found in Umkehr data of Japanese network seem to be related to the difference in characterization of each instrument before and after replacement. Detailed information about each instrument replacement allows for appropriate correction of Japanese stations records [Bojkov et al, 2002].
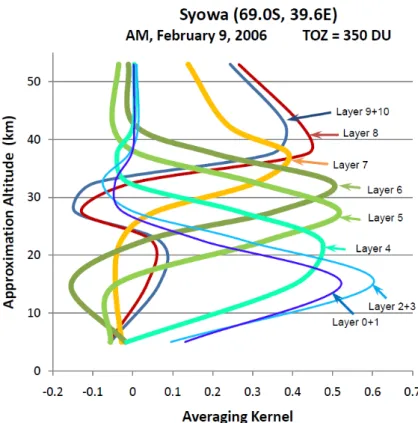
Comparisons of ozone profiles with different vertical resolution require application of a smoothing function to the highly resolved ozone profile to match the of lower resolution profile. The concept of Averaging Kernels (AK) was introduced by Rodgers [1976, 1990]. Figure 6 shows
information content (or AK) for several individual and combined Umkehr layers. It is clear from the plot that vertical resolution for Umkehr retrieval is twice as large in the lower (0+1 and 2+3) or upper layers (8 and9+10) as compared to the middle atmospheric layers (4, 5, 6, and 7).
Table 2. Layers used for Umkehr ozone profile retrievals [Mateer and DeLuisi, 1992]
Layers
Layer Base Approx. Height (km)
Layer Base Pressure (hPa)
1 0.0 1013.2
2 10.3 253.3
3 14.7 126.7
4 19.1 63.3
5 23.5 31.7
6 28 15.8
7 32.6 7.9
8 37.5 3.96
9 42.6 1.98
10 47.9 0.99
Figure 5. Division of the atmosphere by forward model and inverse model
11
Figure 6. Each line shows algorithm’s response (AK) to ozone change in layers
The ground-based ozone profile observations that use the Umkehr technique have been well established over the long history of ozone measurements, and have consistently provided data for the trend analysis [WMO, 2007]. However, Umkehr observations contain an issue that was uncovered by several comparison campaigns. Whenever multiple instruments take simultaneous Umkehr observations slightly different results are found that also depend on both the SZA and total ozone column. The contribution of the out-of-band stray light in the measurement becomes significant in case of the enhanced atmosphere extinction (high total ozone amount, low sun elevation) especially at the shorter wavelength in the pair. The short term variability in total ozone requires multiple observations for correction of SZA dependence in the stray light contribution. This is a time-consuming and expensive process. The measurement of stray light inside of a specific Dobson instrument can be used to develop the stray-light correction for that instrument, which could to be applied to other, inter-compared instruments [Petropavlovskikh et al., 2008, 2009]. The comparison of the measured N-value to a reference can be used to estimate the stray-light for an instrument, where the reference is simulated from auxiliary information from the ozone profile taken by co-incident and co-located ozonesonde and satellite observations. The improvement of several percent is shown in comparison of stray-light corrected Umkehr ozone profiles with ozonesonde in the troposphere and lower stratosphere [Petropavlovskikh et al., 2009]. The stray-light model correction to the Umkehr observation network would require further research.
References
Bojkov, R. D., E. Kosmidis, J. J. DeLuisi, I. Petropavlovskikh, V. E. Fioletov, S. Godin, and C. Zerefos (2002), Vertical ozone distribution characteristics deduced from 40,000 re-evaluated Umkehr profiles (1957– 2000), Meteorol. Atmos. Phys., 79, 127– 158.
Chubachi S. (1984), Preliminary result of ozone observations at Syowa station from February 1982 to January 1983. Memoirs of National Institute of Polar Research Special Issue, 34, pp. 13.19. Dobson, G.M.B. (1931), A photoelectric spectrophotometer for measuring the amount of atmospheric
ozone, in Proc. Phys. Soc (London), 43, 324-337.
Dobson, G. M. B., and C. W. B. Normand (1962), Determination of the Constants etc. used in the
Calculation of the Amount of Ozone from Spectrophotometer Measurements and of the Accuracy of the Results, ibid., XVI, Part II, 161-191, Pergamon Press.
Dütsch H. U. (1959), Vertical ozone distribution from Umkehr observations, Arch. Meteorol. Geophys. Bioklimatol., Ser. A, 11, 240-251.
Evans, R. (2008), Operations Handbook - Ozone Observations with a Dobson Spectrophotometer Revised 2008, GAW Rep. 183, 74 pp., Geneva, Switzerland.
Evans R., G. McConville, S. Oltmans, I. Petropavlovskikh, and D. Quincy (2009), Measurement of internal stray light within Dobson ozone spectrophotometers, Int. J. Remote Sens., in press. Fioletov V. E., D. W. Tarasick, and I. Petropavlovskikh (2006), Estimating ozone variability and
instrument uncertainties from SBUV(/2), ozonesonde, Umkehr, and SAGE II measurements: Short-term variations, J. Geophys. Res., 111, D02305, doi:10.1029/2005JD006340.
Godin S., et al. (2000), Reconstruction of vertical ozone distributions from Umkehr estimates (REVUE), in Quadrennial Ozone Symposium, edited by C. S. Zerefos and A. Ghazi, pp. 69-70, Hokkaido Univ., Sapporo, Japan.
Götz F. W. P., A. R. Meetham, and G. M. B. Dobson (1934), The vertical distribution of ozone in the atmosphere, Proc. R. Soc. London, Ser. A, 145, 416-443.
Mateer, C. L. and J. J. DeLuisi (1992), A new Umkehr inversion algorithm, J. Atmos. Ter. Phys., 54, 537.556. Molina M. J., and F. S. Rowland (1974), Stratospheric sink for chlorofluoromethanes: Chlorine atom
catalyzed destruction of ozone, Nature, June 28, pp. 810-12.
Newchurch M. J., E.-S. Yang, D. M. Cunnold, G. C. Reinsel, J. M. Zawodny, J. M. Russell III (2003), Evidence for slowdown in stratospheric ozone loss: First stage of ozone recovery, J. Geophys. Res., 108 (D16), 4507, doi:10.1029/2003JD003471.
Petropavlovskikh I., C. Ahn, P. K. Bhartia, and L. E. Flynn (2005a), Comparison and covalidation of ozone anomalies and variability observed in SBUV(/2) and Umkehr northern midlatitude ozone profile estimates, Geophys. Res. Lett., 32, L06805, doi:10.1029/2004GL022002.
Petropavlovskikh I., Bhartia, P.K. and Deluisi, J., (2005b), New Umkehr ozone profile retrieval algorithm optimized for climatological studies. Geophysical Research Letters, 32, L16808,
doi:10.1029/2005GL023323.
13
Petropavlovskikh I., R. D. Evans, G. L. Carbaugh, E. Maillard, and R. Stubi (2008), Towards a better knowledge of Umkehr measurements: A detailed study of data from thirteen Dobson
intercomparisons, GAW, 180, 46 pp., World Meteorol. Org., Geneva, Switzerland.
Petropavlovskikh I., R. Evans, G. Mcconville, K. Miyagawa, S. Oltmans (2009), Effect of the out-of-band stray light on the retrieval of the Umkehr Dobson ozone profiles, International Journal of Remote Sensing, 30, 24, 6461-6482.
Rodgers, C. D. (1976), Retrieval of atmospheric temperature and composition from remote measurements of thermal radiation, Re. Geophys. Space Phys., 14, 609-624.
Rodgers, C. D. (1990), Characterization and error analysis of profiles retrieved from remote sensing measurements. J.Geophys. Res., 95, 5587 - 5595.
Solomon, S., R. R. Garcia, F. S. Rowland, and D. J. Wuebbles (1986), On the depletion of Antarctic ozone, Nature, 321, 755-758.
World Meteorological Organization (2007), Scientific assessment of ozone depletion: 2006, WMO Ozone Rep. 50, 572 pp., Geneva, Switzerland.
Chapter 1
Reevaluation of long-term Umkehr data and ozone profiles at Japanese stations
Koji Miyagawa, Toru Sasaki, Hideaki Nakane, Irina Petropavlovskikh and R. Evans
Miyagawa, K., T. Sasaki, H. Nakane, I. Petropavlovskikh, and R. D. Evans (2009), Reevaluation of long-term Umkehr Data and Ozone profiles at Japanese stations, J. Geophys. Res., 114, D07108, doi:10.1029/2008JD010658
15
Reevaluation of long-term Umkehr data and ozone profiles at Japanese stations
Abstract
1. Introduction
2. Data
17 3. Reevaluation of N-value
19 3.1 Shift correction of N-value
3.2 SZA correction of N-value
21 3.3 Total ozone correction of N-value
4. Validation of retrieved ozone profile
4.1 Effects of N-value reevaluation on derived ozone profiles 4.2 Effects of the retrieval algorithm on derived ozone profiles
23
4.3 Comparison with ozonesonde and with ozone lidar profile 4.4 Comparison in time series profile
25
27
29 4.5 Comparison of profiles profile
4.6 Long-term ozone trend profile 5. Conclusions
31
33
Acknowledgments References
35
Chapter 2
Vertical Ozone Profile by Umkehr Measurements at Syowa Station
Koji Miyagawa and Toru Sasaki
Koji Miyagawa and Toru Sasaki (2009), Vertical Ozone Profile by Umkehr Measurements at Syowa Station, International Journal of Remote Sensing, 30, Issue 15 & 16, 4043-4053.
37
Vertical Ozone Profile by Umkehr Measurements at Syowa Station
Abstract 1. Introduction
2. Data
3. Results
39
41
43
4. Conclusions
45
Acknowledgments References.
47
Chapter 3
Long-term Ozone Trends in Umkehr Measurements at Japanese stations
K. Miyagawa, T. Sasaki, and C. Kobayashi
Koji Miyagawa, T. Sasaki, and C. Kobayashi (2009), Long-term Ozone Trends by Umkehr
Measurements at Japanese stations, NOAA ESRL 2009 Global Monitoring Annual Conference, Boulder USA.
49
NOAA ESRL 2009 Global Monitoring Annual Conference
LONG-TERM OZONE TRENDS IN UMKEHR MEASUREMENTS AT JAPANESE STATIONS
K. Miyagawa1, T. Sasaki2, and C. Kobayashi3
1Japan Meteorological Agency, Aerological Observatory, Tsukuba, Ibaraki, 305-0052, Japan; +81-29-851-2572, Fax: +81-29+851+5765, E-mail: [email protected]
2Japan Meteorological Agency, Utsunomiya, Japan
3Japan Meteorological Agency, Tokyo, Japan
Abstract
Umkehr observations have been made routinely at Japanese stations at Sapporo, Tsukuba, and Naha, and at the Antarctic station, Syowa, for more than 50 years. The discontinuous gaps in Japanese Umkehr data record have been associated with instrument replacements. Therefore, N-value data were recently reevaluated based on instrument intercomparisons. The data
analysis revealed systematic errors that depend on solar zenith angle, total ozone, and other instrumental factors. The UMK04 ozone profile retrieval algorithm is applied in the processing of all reevaluated N-value time-series. We present a long-term ozone trend determined from the newly re-processed Umkehr ozone profiles.
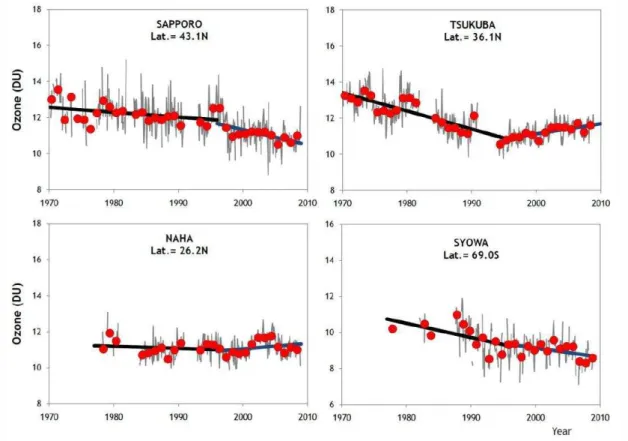
The long-term trend in upper stratospheric ozone is discussed in this paper. Long-term variations of the ozone amount derived by UMK04 algorithm in the combined 8 and 9 layers at Sapporo, Tsukuba, Naha and Syowa are shown in the Figure 1. Linear trends in two separate periods 1970 (or 1977)-1996 and 1996-2008 are also shown for each station. Trend analyses suggest a significant decrease in the upper stratosphere over Japan during 1980s. The upper stratospheric ozone levels at Tsukuba station have shown a steady increase at 5%/decade rate after 1996. At the same time, a 7.7%/decade decrease in ozone is found in Umkehr data taken at Sapporo station, which indicates an even stronger ozone depleting rates as compared to ozone depletion rates prior to 1996. Over the Antarctic station Syowa, upper stratospheric ozone has been at a low level since 1990s. Especially low values can be seen in the last few years. Observed difference in the upper stratospheric ozone changes may be reflecting the latitude dependence of ozone depletion.
NOAA ESRL 2009 Global Monitoring Annual Conference
Figure 1. Long-term variations of ozone amount in 8 and 9 layers.
Linear trend fit is derived after removing effects such as solar activity, QBO, and atmosphere turbidity. A gray line shows monthly average and red circle shows average of the year. Solid lines show linear trends from 1970 (or 1977) to 1996 and from 1996 to 2008. Periods interfered by volcanic eruptions, El Chichon (1982-1983) and Mt. Pinatubo (1992-1993), were removed from the analysis.
51
NOAA ESRL 2009 Global Monitoring Annual Conference
1. Long-term variations
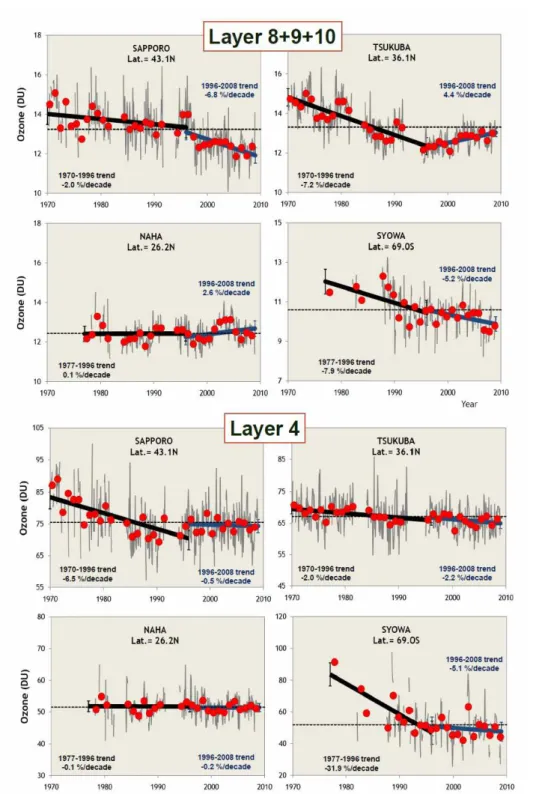
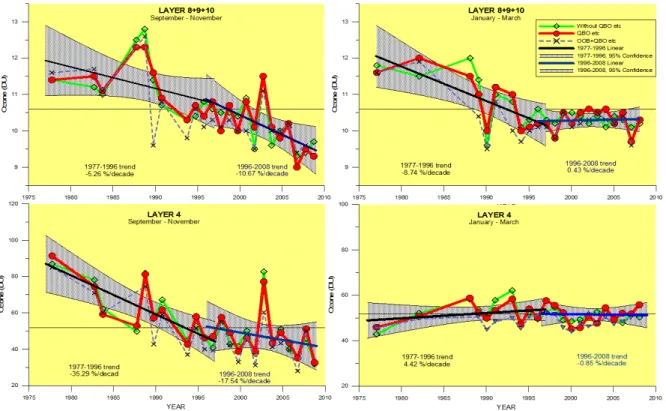
Figure 1a. Long-term variations of ozone amount in layer 8+9+10, and layer 4.
Linear trend fit is derived after removing effects such as the seasonal variation, solar activity, QBO and atmospheric turbidity. A gray line shows monthly average and red circle shows average of the year. Solid lines show linear trends from 1970 (or 1977) to 1996 and from 1996 to 2008. Periods interfered by volcanic eruptions, El Chichon (1982-1983) and Mt. Pinatubo (1992-1993), were removed from the analysis.
NOAA ESRL 2009 Global Monitoring Annual Conference
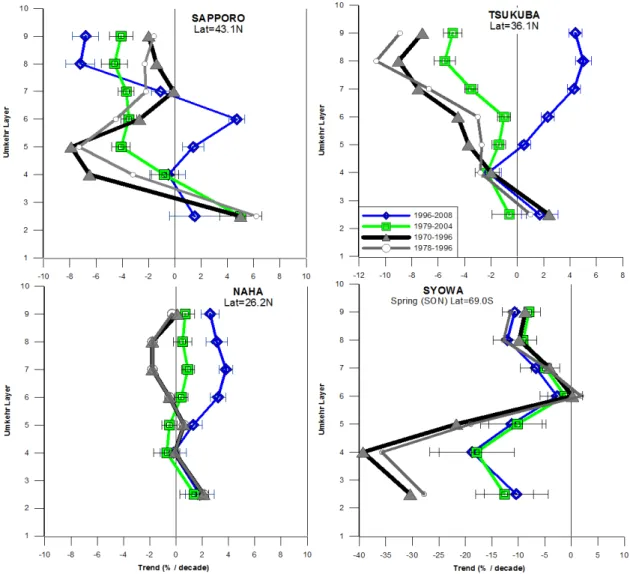
Figure 2. Ozone trends (% per decade) for four period statistics at Sapporo, Tsukuba, Naha, and Syowa. Error bars show the 95% confidence limits.
53
NOAA ESRL 2009 Global Monitoring Annual Conference
Figure 3. Same as Figure 1a, but for spring and summer time data at Syowa.
A red line shows a result removing seasonal variation, solar activity, QBO and atmospheric turbidity, and a green line shows a result of removing only seasonal variation. A dashed line shows a result including stray-light correction (OOB) in measurement data. Shaded area shows 95% confidence limit and a value shows a linear trend after removing all variation components such as QBO.
Figure 4. Same as Figure 3, but for the three-year running average for spring and summer time.
In the analysis of layer 4, data of 2002 are removed, when the stratospheric temperature was high and remarkable Antarctic ozone depletion was not observed.
NOAA ESRL 2009 Global Monitoring Annual Conference
Figure 5. Seasonal and long-term variations of ozone amount in each layer by Umkehr measurement are shown from 1977 to 2007.
Total ozone variation is also shown in the bottom line. Left: The seasonal ozone variation in 2006 and 1977-2007 for each layer is shown. A dashed line shows the day when total ozone is the lowest of the year 2006 (1 October). Right: The long-term ozone variation sorted by total ozone (red dots for less than 220 and blue dots for more than 220DU) are shown. The value in figure shows a difference in decreasing ratio of two cases.
55 2. Discussion and Conclusion
In the upper stratosphere over Japan, the long-term ozone depletion is seen in higher latitudes (Sapporo and Tsukuba). Decreasing rate at Sapporo is even stronger (-6.8%/decade) after 1997 than before. At Tsukuba, a trend turned positive (4.4%/decade) after a long-term decreasing in the period 1970-1996 (Fig.1 and 3). Trends by SBUV/2 for 1979-2004 are generally consistent with that by Umkehr data over Japan (Fig. 2 and 3).
At Syowa in the Antarctica, a linear trend became flattened in the period 1996-2005 after a decreasing (-7.9%/decade) in 1977-1996, though recent data show a decreasing trend again. Very low ozone in the higher latitude upper stratosphere (Sapporo and Syowa) is noticeable in recent years. In the lower stratosphere, clear ozone decreases were found at Sapporo and Syowa (-6.5, -31.9%/decade, respectively) from 1970s to 1996, however, trends became almost flattened after that. These features correspond to the changes in total ozone. The trend analyses in the upper and lower stratosphere in spring and summer at Syowa show that a decreasing trend is generally found except in the lower stratosphere (layer 4) in summer. Especially a large ozone decrease is found in last 3 years (2006-2008) in layer 8+9+10 in spring, which lasted in the following summer. The 2006 was the “unusual” year, when extremely low ozone concentration was observed in most layers (except for layer 1) accompanied with low temperature. Total ozone above and below 220 DU generally corresponds outside and inside of the polar vortex, respectively. The difference in trends between outside and the inside of the polar vortex is large in the layers 2-5 (the lower stratosphere) and 7-9 (the upper stratosphere). It is said that ozone depletion in the upper stratosphere is caused by only gas phase chemistry while in the lower stratosphere it is driven by heterogeneous chemistry. The Umkehr observation provides useful data for these studies.
Acknowledgments
We would like to thank I. Petropavlovskikh of CIRES/ESRL, and R. Evans of NOAA/OAR/ERSL Boulder, USA regarding the analysis of Umkehr observation.
References
Miyagawa, K., T. Sasaki, H. Nakane, I. Petropavlovskikh, and R. D. Evans (2009), Reevaluation of long-term Umkehr Data and Ozone profiles at Japanese stations, J. Geophys. Res., 114, D07108,
doi:10.1029/2008JD010658.
Miyagawa Koji and Toru Sasaki (2009), Vertical Ozone Profile by Umkehr Measurements at Syowa Station, International Journal of Remote Sensing, 30, Issue 15 & 16, 4043-4053.
Supplement: Ozone and temperature changes in the upper stratosphere
In this paper, we considered the ozone and temperature changes in the upper stratosphere using the re-analysis station data of NCEP/NCAR (National Centers for Environmental Prediction / National Center for Atmospheric Research) and JRA-25 (Japanese Re-Analysis 25 years). The main
characteristics from 1982 to 2008 are as follows. For the ozone record analysis, seasonal variation, effects of solar activity, QBO and aerosol, etc. signals are removed from the data.
1. Temperature of the upper stratosphere and lower stratosphere
Figure 1 shows seasonal change of the stratosphere temperature for two specific years: 2002, when the extend of ozone destruction has receded, and 2006, when the record-breaking depth and area of ozone hole loss was recorded in the Antarctica. In the late spring ( October and November) when the solar elevation angle in the Antarctic region is higher, variation in ozone and monthly mean
temperature of 100 hPa and 5 hPa show high negative correlation (see Figure 2). This relation is seen in the Antarctic region and is not obvious in the Umkehr ozone record at Lauder, NZ station located at mid-latitudes in the Southern hemisphere. This late spring time period in Antarctica features the highest temperature in the upper stratosphere.
2. Relation between ozone and temperature
Figure 3 shows the annual change of layer 8 ozone of Syowa and 5hPa temperature at several Southern high latitude stations. Long term records of ozone and temperature monthly averages
measured in November show high correlation where a decline of temperature and the increase in ozone is observed. The scatter diagrams and linear trends for ten years (1999-2008) are shown in Figure 4. The ozone in Syowa shows high correlation (correlation coefficient is 0.94), as do other stations in the Antarctic region. Slope at the three stations is -0.135DU per degree C.
The above analyses suggest the temperature dependence of ozone change in the upper stratosphere at 40 km altitude is about 2% per1 degree C.
3. Conclusions
The monthly averages of the ozone (layer 8) and temperature (at 5 hPa level atmospheric pressure) for the month of November show high correlation between a decline in temperature and the increase in ozone. The increase in the greenhouse gases in the troposphere raises surface temperatures, while it also reduces temperatures in the stratosphere. The Antarctic ozone hole in lower stratosphere becomes more active; however it will play a role in the reduction of ozone near 40 km altitude. Temperatures at the upper stratosphere at mid-latitudes remain constant, and at lower temperature after the 1990s [WMO, 2007; Steinbrecht et al., 2009]. In the Antarctic region, it appears that a decline of temperature still continues with the increased inter-annual variability observed in the past ten years. Continuous study of chemical reaction coefficients, temperature dependence and transport, etc. is needed. Our research is based on Umkehr observations from the Dobson ozone spectrophotometers of high precision that is
57
required for detection of significant ozone change (recovery) in relation to the decrease in the ODS concentrations.
Figure 1 Seasonal change of the stratosphere temperature of two stations in the Antarctic region.
Figure 2 Annual change of the average temperature in November (100 hPa and 5 hPa) at each stations
59
Figure 3 Annual change in November of layer 8 ozone (Syowa) and 5-hPa temperature (Syowa, Dome C and Mc Murdo)
Figure 4 Linear trends of ozone and temperature as well as Figure 3.
GENERAL SUMMARY
The reevaluation of the optical characteristics of individual instruments and correction of Umkehr observations helped to reduce effects of the shifts in the long-term Japanese network data. The re-evaluated Umkehr ozone profiles were verified against independent observational data. Moreover, the use of an a-priori profile independent of the total ozone variability in the Umkehr retrievals (UMK04 algorithm) has optimized ozone dataset for analysis of the long-term trend in stratospheric ozone.
In Chapter 1, the Umkehr measurement data were discussed by introducing new techniques to remove instrumental uncertainty in measured N values by assessing each instrument’s characteristics on the basis of intercomparisons with a reference Dobson instrument. Reevaluated and original N values were processed by the Umkehr retrieval algorithm UMK04 as well as by UMK92 to derive vertical ozone profiles. It was found that the ozone profile retrieved by UMK04 shows a clear decreasing trend in the 1980s in the lower stratosphere. Vertical ozone profiles retrieved from revised N-value data sets were compared with coincident ozonesonde and lidar measurements on a daily basis. The results show that the Umkehr deviation from ozonesonde profile is less than 5% in layers 4 to 6, which suggests that
reevaluated Umkehr data provide high-quality ozone profiles available for long-term trend analyses. However, more than 10% difference between sonde and Umkehr ozone is found in the lowermost layer. This is considered to be due to KC ozonesondes characteristics (though limited information in this Umkehr layer may be part of the disagreement). Recent colocated data comparisons with the tropospheric lidar system in Tsukuba, display improved agreement with the Umkehr results. Long-term ozone trends in Umkehr measurements show the largest decreases in the upper stratosphere (layers 7 and 8 for Sapporo and Tsukuba). Decreases in the lower stratosphere (layer 4) between 1979 and 1996 are also detected at Tsukuba and Sapporo stations. A decrease in total ozone in this period reflects a decrease in the layer 4 ozone. Results of this study show that the new intercomparison procedure of Umkehr measurements with the fixed reference standard (such as 083 and 116), as introduced in this paper, can provide the
international Dobson network with a great improvement of data quality.
In Chapter 2, the long-term ozone trends in re-evaluated Umkehr datasets were discussed in detail. The ozone hole in 2006 was the largest depletion ever observed due to the remaining high concentration of ozone depleting substances in the stratosphere and the lower than usual stratospheric temperatures in the Antarctic region related to the weaker than usual planetary wave activity. In this analysis, components of natural ozone variations related to solar activity and QBO are removed. Ozone in spring season shows clear and steady decreasing both in the upper (9.6%/decade) and the lower
(16.6%/decade) stratosphere. On the contrary, ozone in the summer shows only small decreasing in the upper stratosphere and no clear decreasing in the lower stratosphere. Umkehr data are expected to provide important information about stratospheric ozone trends in the Antarctic region in addition to the satellite data. The independent data source from Umkehr measurements is also expected to validate satellite observations. Re-evaluated new Umkehr datasets contributes to the ozone layer assessment in regards to the Montreal Protocol success.
61
In Chapter 3, the long-term trend and the seasonal characteristic in upper stratospheric ozone is discussed. In the upper stratosphere over Japan, the long-term ozone depletion is seen at higher latitudes (Sapporo and Tsukuba). At Syowa in the Antarctica, a linear trend flattened in the period 1996-2005 after a decrease (-7.9%/decade) in 1977-1996, though recent data show a decreasing trend again. Very low ozone in the higher latitude upper stratosphere (Sapporo and Syowa) is noticeable in recent years. In the lower stratosphere, clear ozone decreases were found at Sapporo (-6.5%/decade) and Syowa
(-31.9%/decade) from 1970s to 1996, however, after 1996 trends had been reduced to close to zero. These features agree with changes in total ozone. The trend analyses in the upper and lower stratosphere in spring and summer at Syowa show that a decreasing trend is generally found except in the lower
stratosphere (layer 4) in summer season. Especially a large ozone decrease is observed in the last 3 years (2006-2008) in layer 8+9+10 in spring, which continues in the following summer. The year 2006 was
“unusual” as extremely low ozone concentration was observed in most layers (except for layer 1)
accompanied by low stratospheric temperatures. The difference in trends for ozone measured outside and the inside of the polar vortex is large in layers 2-5 (the lower stratosphere) and 7-9 (the upper
stratosphere). It has been shown [Solomon et al., 1986] that ozone depletion in the upper stratosphere is caused by only gas phase chemistry while in the lower stratosphere it is driven by heterogeneous
chemistry. Moreover, a seasonal dependence of the ozone depletion in the upper stratosphere is observed since 1995, where about 10%/decade decrease is detected in spring, and ozone recovery is still very low.
In conclusion, we described the re-evaluation technique used for the Umkehr observations, and updated the ozone trends, especially in the upper stratosphere over the middle latitudes. The continuing long-term ozone destruction in the Antarctic region is described in detail, which provides new
information about the ozone loss process in the Antarctic region. The measurement re-analysis technique developed by this study for the analysis of a long-term Umkehr measurements can be used to further study the decline of stratosphere temperature, changes in atmospheric circulation field by climate change, and influence of radiation-forcing for more complete understanding of the complicated ozone variation mechanism in the Antarctic region.

![Table 2. Layers used for Umkehr ozone profile retrievals [Mateer and DeLuisi, 1992]](https://thumb-ap.123doks.com/thumbv2/123deta/6143465.101552/14.892.215.701.182.522/table-layers-umkehr-ozone-profile-retrievals-mateer-deluisi.webp)