Black-Hole Mass Measurements
in Nearby Galaxies Using Molecular Gas Dynamics
Kyoko Onishi
DOCTOR OF PHILOSOPHY
Department of Astronomical Science
School of Physical Sciences
The Graduate University for Advanced Studies (SOKENDAI)
2016 (Academic Year)
学位論文
Black-Hole Mass Measurements
in Nearby Galaxies Using Molecular Gas Dynamics
平成 29 年 1 月博士(理学)申請
総合研究大学院大学 物理科学研究科 天文科学専攻
大西 響子
Abstract
Galaxy evolution is one of the key topics in contemporary astronomy. Gaining a full un- derstanding of it is however challenging, because of the myriad of processes involved. A key result of the 1990s was the realization that supermassive black holes (SMBHs; MBH = 106−10M⊙) are present in the centres of massive stellar spheroids. More impor- tantly, direct mass measurements of SMBHs in centres of galaxies have become gradually possible in these 2 decades, by using several dynamical methods thanks to both developed observing facilities and mass modelling methods. The derived SMBH masses are reveal- ing a couple of empirical correlations between SMBH mass and host galaxy properties (e.g., stellar velocity dispersion σ km s−1, thusMBH −σ relation). The exact form of the correlation is still under debate, but its implication is clear – black holes and galax- ies grow hand-in-hand, and the evolutionary process possibly involves a self-regulating mechanism. The idea is now broadly accepted (and debated) as a co-evolutionary process of galaxy and black hole, which has been motivating many theoretical and observational studies of galaxies from nearby to high redshift.
Dynamical measurements of SMBH masses in nearby galaxies have been reported so far, by using ionized gas, stars, and masers to trace the rotational motions in galaxies. We here report an establishment and applications of a new dynamical method uses molecular gas to trace the circular motion of a cold disc inside the galaxy. This new method was first used in 2013, which observed a CO (J = 2 − 1) disc in a nearby quiescent early-type galaxy. We first examine the method by using two different molecular species for a barred- spiral galaxy. Both of the molecular species, HCN (J = 1 − 0) and HCO+ (J = 1 − 0), show very similar rotational motion that requires the same SMBH mass. We thus confirm
the flexibility of this method to use multiple molecular species and to target various types of galaxies.
We then extend this method to implement multiple parameters when fitting the model. So far in previous works SMBH mass and stellar mass-to-light ratio were the only free parameters to describe the mass model. We add free parameters to describe the properties of the disc and fit the model to a data cube of regularly rotating CO (J = 2 − 1) disc observed in a nearby early-type galaxy. The refinement on this method allows one to measure SMBH masses with less assumption, but with better confidence.
We then apply this method to another nearby galaxy imaged with a ∼ 30 pc spatial resolution, three times as high as the first two. The molecular gas distribution in a form of a thick disc is newly considered to model a realistic gas disc in this spiral galaxy.
Results from our method are finally added to the empirical MBH −σ relation. We comment that the results do not conflict with the existing relation, while the number of plots is too small to give a statistically meaningful conclusion. It is necessary to im- prove the statistics by investigating the origin of the scatter in order to discuss about the coevolutionary process from theMBH−σ relation.
Unlike other dynamical methods, the molecular gas method provides a broad range of target galaxy types and SMBH masses. Moreover, gas kinematics sometimes can be ob- served with a surprisingly short integration time (only a few to several tens of minutes of on-source time for CO detection). We examine and confirm the capability of the molecu- lar gas method to help dramatically increasing the sample for theMBH−σ relation. The dynamical method will thus be a powerful tool to help understanding the key question about the co-evolutionary process of galaxy and black hole.
Contents
1 General Introduction 1
1.1 Coevolution of Galaxy and Black Hole . . . 1
1.1.1 Dynamical Evolution of Galaxy . . . 2
1.1.2 Star Formation and its Quenching – Feedback Processes . . . 3
1.1.3 Formation and Evolution of Black Hole . . . 6
1.1.4 Correlations between SMBH Mass and Host Galaxy Properties . . 9
1.2 Supermassive Black Hole Mass Estimates . . . 12
1.2.1 The nearest case – our galaxy . . . 12
1.2.2 Dynamical modelling of nearby galaxies – megamaser systems . . 17
1.2.3 Dynamical modelling of nearby galaxies – stellar dynamcis . . . 19
1.2.4 Dynamical modelling of nearby galaxies – ionized gas dynamics . 20 1.2.5 Dynamical modelling of nearby galaxies – molecular gas dynamics 21 1.2.6 SMBH Mass Estimates at High Redshift . . . 22
1.2.7 Cross Checks Between SMBH Mass Measuring Methods . . . 24
1.3 Road Map . . . 27
2 A Development of SMBH Mass Measuring Method 28 2.1 Abstract of the Chapter . . . 28
2.2 Introduction . . . 29
2.2.1 The Target – NGC 1097 . . . 30
2.3 Observation . . . 32
2.4 Method . . . 35
2.4.1 Dynamical Modelling . . . 35
2.4.2 Fitting and the Result . . . 39
2.5 Discussion . . . 41
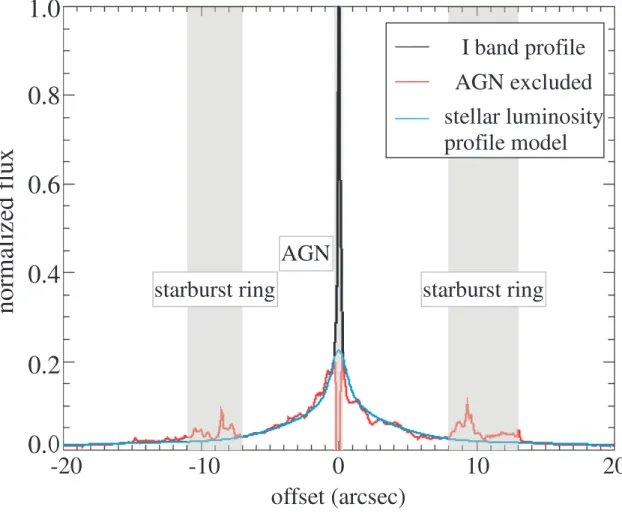
2.5.1 The Proper Stellar Luminosity Profile without the Dust Effect . . 41
2.5.2 Effect from the Inclination Angle . . . 45
2.5.3 SMBH Mass Estimation from Other Molecular Species . . . 48
2.6 Conclusion . . . 50
3 Some improvements on the method – application to NGC 3665 51 3.1 Abstract of this Chapter . . . 51
3.2 Introduction . . . 52
3.2.1 The target – NGC 3665 . . . 53
3.3 Observation and Data Reduction . . . 54
3.4 Method . . . 58
3.4.1 Velocity Model . . . 58
3.4.2 Creating the Model Data Cube . . . 61
3.4.3 Fitting . . . 62
3.4.4 Results . . . 64
3.5 Discussion . . . 68
3.5.1 CO Morphology . . . 68
3.5.2 AGN Properties . . . 69
3.5.3 Other Error Sources for the SMBH Mass . . . 70
3.5.4 Rotation Curve Fit . . . 72
3.6 Conclusions . . . 77
4 SMBH mass measurement in NGC 5064 79
4.1 Abstract of this Chapter . . . 79
4.2 Introduction . . . 79
4.2.1 The target – NGC 5064 . . . 80
4.3 Observations and Data Reduction . . . 81
4.4 Method . . . 83
4.4.1 The Mass Model . . . 83
4.4.2 Velocity Model Calculation and the Result . . . 83
4.5 Discussion – Velocity Dispersion of the Gas Disc . . . 92
4.6 Conclusion . . . 92
5 General Discussion –MBH−σ Relation and Future Prospects 94
6 General Conclusion 99
Acknowledgment 101
Bibliography 104
Chapter 1
General Introduction
1.1 Coevolution of Galaxy and Black Hole
Galaxies are the main visible building blocks in the universe. Formation and evolution of those is thus crucial to understand the progression of the universe to date. Observations for over many decades and theoretical researches have been done to search for this major topic in contemporary astronomy, while gaining a full understanding is challenging be- cause of the myriad of processes involved. A key result of the 1990s was the realisation that supermassive black holes (SMBHs; MBH = 106−10M⊙) are present in the centres of most massive galaxies. Following the galaxy formation scenarios involving galaxy mergers, growth of the SMBH can be expected to proceed together with the galaxy evo- lution. The idea of the coevolutionary process is supported by some observed evidence such as relations between SMBH mass and properties of their host galaxy. Here I sum- marize a known scenario of galaxy evolution and the role of SMBH, studied both from observational and theoretical aspects.
1.1.1 Dynamical Evolution of Galaxy
The theory of cold dark matter (CDM; see, e.g., Peebles, 1982; Blumenthal et al., 1984) has nowadays become the most accepted explanation for the origin and evolution of the universe. A rough sketch of this scenario is that a density fluctuation in the early universe evolves into dense core of baryon, and then eventually consist stars and thus galaxies.
Navarro et al. (1997) numerically simulated the collapse and growth of dark matter halo to show the profile that can be written as in equation 1.1, regardless of dark matter mass, initial density fluctuation spectrum, or of cosmological parameters.
ρ(r)/ρcrit = δc
(r/rs)(1 + r/rs)2 (1.1)
Here rs is the scale radius, δc is the characteristic density, andρcrit = 3H2/8πG is the critical density of the dark matter halo.
As the dark matter halos merge and form larger halos, baryons condense and pro- vokes birth of dwarf galaxies at the centre of the halo. White & Rees (1978) analytically described a two-stage theory for galaxy formation and clustering. A density fluctuation in the gas cloud grows with an assumption of a self-similar clustering process. In this scenario, however, the clouds will be destroyed by relaxation effects and reform an amor- phous system within a short time scale. This explain the needs of gas cooling and dissi- pation, so to remain some gas in the surrounding and eventually fuel the luminous inner part of galaxies as seen in nearby universe.
More realistic approaches are nowadays taken by using semi-analytic modelling (SAM; see, e.g., White & Frenk, 1991; Springel et al., 2005; Baugh, 2006; Croton et al., 2016, and references therein). This computationally inexpensive technique allows to include star formation, black hole growth, supernova feedback, active galactic nuclei (AGN) feed- back and reionization process from the UV background radiation, in addition to the gas cooling in its model. N-body and hydrodynamic simulations also accurately compute the
galaxy formation process (see e.g., Somerville & Dav´e, 2015, for a review). Fundamental equations such as gravitation, hydrodynamics, radiative cooling and radiative transfer are normally considered to mitigate the assumption.
Although detailed formation and evolutionary process of galaxy is under debate, the implication is clear. Current universe cannot be explained with a mere dynamical collapse of a cloud. Additional effects such as gas cooling, feedbacks from inside and so on are crucial to reproduce the universe.
1.1.2 Star Formation and its Quenching – Feedback Processes
Aiming to shed light into the unknown process of galaxy formation and evolution, many studies have altogether revealed the importance of physical processes such as star for- mation and feedback processes. While the formation process itself cannot be directly observed, multi-wavelength observations allow us to study on galaxies at multiple dis- tances, so as multiple ranges of their age.
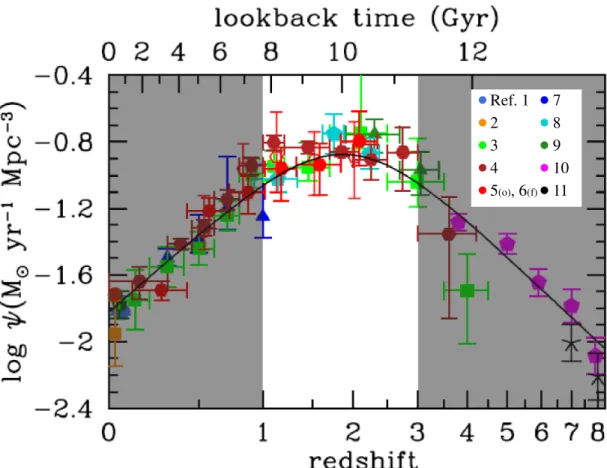
Evolution of galaxy star formation rate density is one of the key findings in the past two decades (see, e.g., Madau et al., 1996; Hopkins & Beacom, 2006; Madau & Dick- inson, 2014). The so-called Madau plot (see Figure 1.1) clearly shows the galaxy star formation to be very active at the epoch of redshiftz = 2 − 3. In this “cosmic noon”, the star formation rate density is ∼ 10 times higher than at present. The low star formation rate density at z > 3 can be explained when considering dwarf galaxies that are domi- nant at the epoch. Supernova explosion can blow the gas with a galactic wind to expand the gas, so as the star formation becomes inefficient. In order to stop the star formation activity atz < 2, the system needs to eject or use up the gas before z = 0.
Possible explanations for the quenching are: 1). gas stripping due to ram pressure in galaxy clusters (see, e.g., Abadi et al., 1999; McCarthy et al., 2008; Tecce et al., 2010;
Guo et al., 2011; Heß & Springel, 2012; Steinhauser et al., 2016); 2). gas ejection by galactic wind from a supernova explosion (see, e.g., Arimoto & Yoshii, 1987; Hopkins et al., 2012); and 3). gas ejection due to the active galactic nuclei (AGN) feedback process (see, e.g., Silk & Rees, 1998; Di Matteo et al., 2005; Sijacki et al., 2007; Di Matteo et al., 2008; Fabian, 2012; Barai et al., 2013; Heckman & Best, 2014).
Ram pressure stripping is one of the most commonly accepted processes to explain observed variation of galaxy morphologies between cluster and field galaxies. The strip- ping process itself is observationally confirmed by tens of kpc tails associated to several cluster galaxies (e.g., Crowl et al., 2005; Vollmer et al., 2005; Sun et al., 2007). Nu- merous hydrodynamic simulations and semi-analytic modellings have been done, both focused on stripping of cold gas discs (e.g., Abadi et al., 1999; Tecce et al., 2010) and of hot gas haloes (e.g., McCarthy et al., 2008; Guo et al., 2011). Overall the ram pressure stripping explains the observed lower star formation rates in cluster galaxies compared to field galaxies, but obviously does not explain the star formation rate density evolution for galaxies regardless of their environment.
Galactic wind occurs when energy of supernova explosion exceeds the binding en- ergy of the galaxy. The wind drives the gas out of the system to eventually quench the star formation. Arimoto & Yoshii (1987) calculated an evolution of spectra from ellipti- cal galaxies with various mass by considering the galactic wind. They reported the wind helps to reproduce the trend of the observed colour-magnitude diagram, that the elliptical galaxies become redder for higher luminosity. In recent studies, supernovae do not only eject gas but recycle, photoheat, or photoionize the gas to slow down the star formation (but not to completely quench). These effects are altogether called as star-formation feed- back or supernova feedback, that is well summarized in Hopkins et al. (2012). Hopkins et al. (2012) used numerical simulations of isolated galaxies and claimed that giant star-
forming clumps observed at high-redshift can be disrupted (as seen in low redshift), only when considering the stellar feedback mechanism. This feedback event can happen in every galaxy, while ram pressure stripping requires a specific environment. It is however difficult to eject gas from a heavy galaxy, hence high binding energy, by only considering this supernova feedback mechanism.
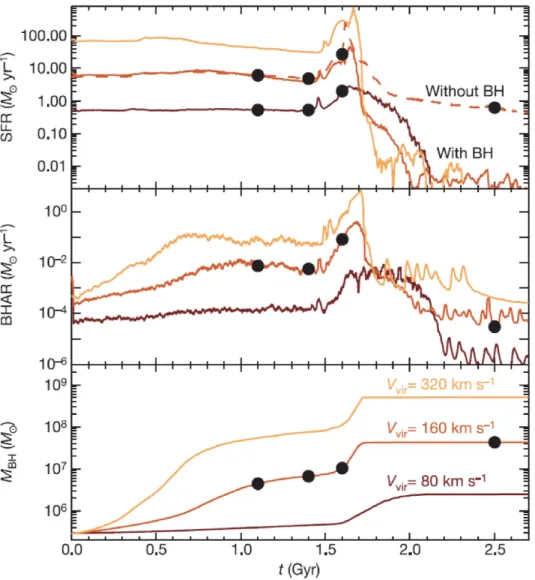
The amount of energy that can be released from a central SMBH well exceeds the binding energy of the host galaxy (Silk & Rees, 1998). This means the AGN feedback process is the possible explanation to eject enough amount of gas from a giant galaxy. AGNs are often observed as a very bright core in nearby giant galaxies at a broad range of wavelength. Although exact formation process of the AGN is yet to be observed, N- body and hydrodynamic simulations suggest an excessive gas fuelling to the supermassive black hole (SMBH) at the galaxy centre, provoked by galaxy merger (e.g., Di Matteo et al., 2005). Once the gas is transported to the galactic centre and form an accretion disc extends till tens of Schwarzschild radii around the SMBH, the gaseous disc becomes very luminous by releasing gravitational energy through friction and will be observed as a bright point source at the galaxy centre (AGN). After the luminosity becomes enhanced, its radiative pressure blows the gas out as often observed in a form of outflow. This AGN feedback process thus regulates the SMBH growth by itself, together with quenching the star formation of its entire galaxy. Di Matteo et al. (2005) shows a significant role of AGN feedback to decrease the star formation rate in their numerical simulation – a run with AGN feedback results in10−2 times smaller star formation rate compared to the run without AGN feedback (see Figure 1.2). In some of the studies, ejected gas eventually falls back into the host galaxy to form stars or to again fuel the central SMBH (see, e.g., Sijacki et al., 2007; Di Matteo et al., 2008; Barai et al., 2013). Same as the supernova feedback, this mechanism can slow down the star formation and gradually quench, rather than blowing all the gas away at once.
The first two quenching processes (ram pressure stripping and supernova feedback) do not require the central SMBH to affect their host galaxies. While these processes are promising for cluster galaxies and dwarf or low-mass galaxies, these would not be enough effective for field giant galaxies. AGN feedback process is thus necessary to explain the existence of field giant ellipticals. The process can couple high enough energy to the gas , while the efficiency of the energy transportation is still uncertain. As a consequence, all of the three processes likely occur in combination to gradually slow down the star formation and to form the universe at present.
1.1.3 Formation and Evolution of Black Hole
Although we are still not able to observe the black hole itself, much indirect evidence suggests the existence of black holes, particularly SMBHs at galaxy centres. For example, AGNs are observed at any epoch from local universe to high redshift (as quasars). The very bright source is known to be very compact, and has a spectral energy distribution quite different from that of stars. AGNs are required to be very massive not to be unbound by its energy emitted by its own, that is observed as high bolometric luminosity. Typically AGN sources are required to be heavier than106M⊙(see, e.g., Ferrarese & Ford, 2005), which is difficult to explain without a SMBH. Quiescent galaxies also have indications of SMBH existence. Firstly, the SMBH mass density falls from high redshift to local universe too quickly, by at least two orders of magnitudes, if we assume SMBHs only in active galaxies. The rest should reside in local quiescent galaxies, because it is quite unnatural for the SMBHs to disappear. Secondly, growing number of observations show galactic rotation curves which require a central compact massive object. The detection of Keplerian motion requires the target to be nearby, most of which are not powerful AGNs. Historical progress in SMBH indirect detection is reviewed in Kormendy & Ho (2013).
Ref. 1
5(o), 6(f)
4 3
7 8 9 10 11 2
Figure 1.1: The history of cosmic star formation rate density (SFRD):The grey shaded areas indicate epoch of lower star formation rate, suggesting the enhancement and quenching of such activity. The original figure is from Madau & Dickinson (2014), which assembled observations at UV and IR wavelength. The plots are taken by the references as follows. References: (1) Wyder & GALEX Science Team (2005), (2) Takeuchi et al. (2003), (3) Cucciati et al. (2012), (4)Gruppioni et al. (2013), (5)Magnelli et al. (2011) for open symbols, (6)Magnelli et al. (2013) for filled symbols, (7)Schiminovich et al. (2005), (8)Dahlen et al. (2007), (9)Reddy & Steidel (2009), (10)Bouwens et al. (2012a,b), (11)Schenker et al. (2013)
Figure 1.2: Time evolution of star formation rate (SFR; upper panel), black hole accretion rate (BHAR; middle panel), and SMBH mass (lower panel):These plots are calculated and presented in Di Matteo et al. (2005). The three lines correspond to models with galaxies of virial velocityVvir =80, 160, and 320 km s−1, as indicated in the lower panel. The SFR drops rapidly after the peak of BHAR when considering the SMBH (solid lines). The AGN feedback process decreases the SFR to around 100 times smaller compared to the model without SMBH (dashed line).
Formation of SMBHs is still an unresolved issue. Simulations normally assume rem- nants of Population III stars or direct collapse of very low angular momentum gas to cre- ate a seed black hole. These seed black holes can grow by accreting gas with its angular momentum negligible, or by yielding gas from an accretion disc that decreases angular momentum by its viscosity and gravitational torques (see, e.g., Somerville & Dav´e, 2015; Hopkins & Quataert, 2010). Observations for more than two decades at the SMBH in our galaxy (see, e.g., Genzel et al., 2010, for a review) still do not detect any feeding event so far. Observations towards other nearby galaxies sometimes show complex velocity structures of gas, which can be explained with inflowing and outflowing motion along the gas disc (Garc´ıa-Burillo et al., 2003; Riffel et al., 2006; Diniz et al., 2015; Smaji´c et al., 2015). These observations help to estimate inflow rates towards central few tens of parsecs by assuming disc morphology and gas density. Although the observing facilities are substantially improved to date, transportation of gas towards the central SMBH is not observed. The growing process of black hole is thus not well understood, while there are some clear indications of a connection between SMBH growth and galaxy evolution (see Section 1.1.4 for details).
1.1.4 Correlations between SMBH Mass and Host Galaxy Properties
In the nearby universe a variety of host galaxy properties are known to be correlated with the central SMBH mass. For instance there is a tight correlation between the SMBH mass and the bulge luminosity (MBH−Lbulgerelation, e.g., Kormendy & Richstone, 1995; McConnell & Ma, 2013; Kormendy & Ho, 2013), the galaxy total luminosity (MBH−Ltot
relation, e.g., L¨asker et al., 2014), the bulge mass (MBH−Mbulgerelation, e.g., Magorrian et al., 1998; Marconi & Hunt, 2003; Beifiori et al., 2012; Kormendy & Ho, 2013), and the central velocity dispersion (MBH −σ relation, e.g., Ferrarese & Merritt, 2000; G¨ultekin
et al., 2009; McConnell & Ma, 2013; Kormendy & Ho, 2013). van den Bosch (2016) shows not only SMBH, but all range of black holes from zero to10 billion solar masses falls into a fundamental plane of black hole mass, size of the host stellar spheroid, and its luminosity. These empirical correlations do have scatter, but the implication is clear– black holes and galaxies evolve together by influencing each other (coevolution of galaxy and black hole).
Recent studies are suggesting that the correlation between the SMBH mass and bulge/host galaxy properties are more complex than originally thought. For instance McConnell
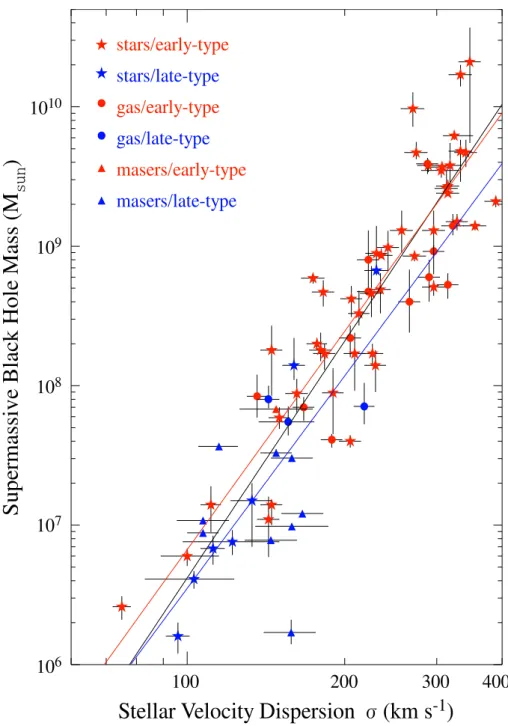
& Ma (2013) showed that different coefficients for the MBH − σ relation can be fit to early- and late-type galaxy samples (see Figure 1.3). Early-type MBH − σ relation (log10(MBH/M⊙) = 8.39 + 5.20 log10(σ/200 km s−1), red line in Figure 1.3) gives a
SMBH mass of typically two times larger than the late-typeMBH−σ relation (log10(MBH/M⊙) = 8.07 + 5.06 log10(σ/200 km s−1), blue line in Figure 1.3), at a given velocity dispersion.
Kormendy & Ho (2013) in contrast claimed that no such correlations are seen for galax- ies hosting psuedo-bulges. These claims are yet to be accepted nor declined, due to an insufficient amount of sample with their SMBH mass measured with small enough error. Motivated by the unobserved coevolutionary process and its suggestive evidence from the empirical relations such as theMBH −σ relation, many theoretical studies have been carried out (e.g., Silk & Rees, 1998; Di Matteo et al., 2005; Sijacki et al., 2007, etc.). Their models calculate the galaxy merger process under the assumption that seed black holes already exist in high redshift galaxies and grow self-consistently. When the black holes grow as the galaxies merge, it reaches a critical size expelling the surrounding gas by its radiation energy and quenching the growth (AGN/quasar mode feedback process). In this way the BH growth is self-regulated, gravitationally affecting the surrounding stel- lar spheroid. The numerical simulation of galaxy mergers by Di Matteo et al. (2005) takes
this AGN feedback process into account to successfully reproduce theMBH −σ relation in the local universe. Sijacki et al. (2007) extended the quasar mode feedback process to a simple model for radio mode feedback, which assumes an AGN-driven bubble to be cre- ated when SMBH mass increases by a certain fraction∆MBH/MBHlower than the quasar. The bubble energizes the surrounding gas thermodynamically, leading to the regulation of BH growth. In this simulation, the BH affects the surrounding gas and spheroid of stars with a smaller accretion rate than in model with only the quasar mode feedback. This simulation also reproduces the MBH −σ relation in the local universe. These numerical studies suggest the observed MBH −σ relation can be reproduced by a coevolutionary process that includes self-regulating mechanisms. Having said that, correlations between SMBH mass and host galaxy properties can evolve together with redshift, reflecting the evolutionary stage of galaxies at each age.
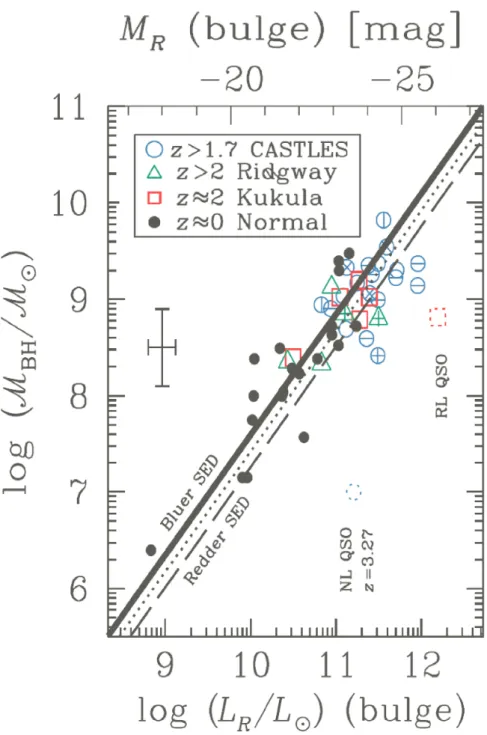
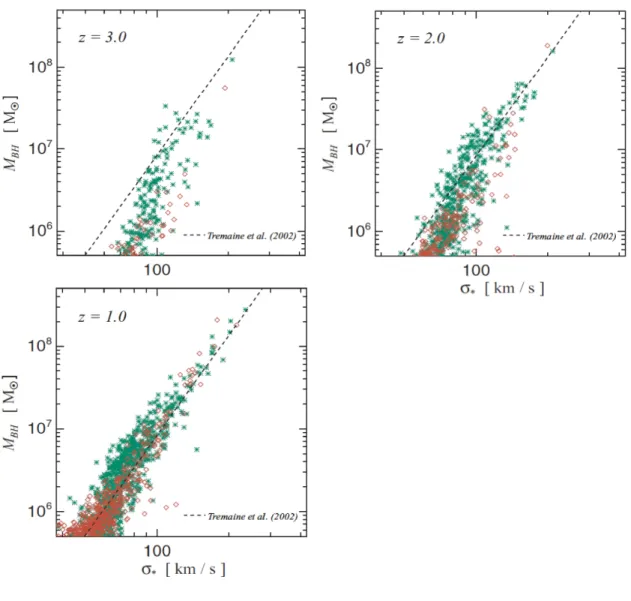
Observational studies on the redshift evolution of the correlations have not been done for the MBH −σ relation, but for others such as MBH −Lbulge relation. Observations towards high redshift galaxies makes it difficult to determine a central velocity dispersion σ, due to their complex structure and the observational constraints. Instead of that, Peng et al. (2006a,b) explored theMBH −Lbulgerelation for quasar host galaxies atz ≤ 2. They showed the MBH −Lbulge relation does not have a redshift evolution fromz = 1 to 2, although their galaxy samples are biased to the high mass SMBH hosts (MBH > 108M⊙) (see Figure 1.4). Numerical simulations are also used to show that theMBH −σ relation evolves fromz = 1 to 3 at the low BH mass end (MBH ∼ 106M⊙), while massive BHs (MBH larger than108M⊙) fromz = 1 to 3 stay close to the local MBH−σ relation (e.g., Sijacki et al., 2007, Figure 1.5).
Correlations between SMBH mass and host galaxy properties suggests a self-regulating coevolutionary mechanism of galaxy and black hole. It is, however, still unclear if these
correlations evolve along redshift, if different correlations exist for different galaxy types, or if these correlations can be applied for psudobulge hosts. These empirical correlations are discussed with 78 galaxies at this point. Increasing the number of SMBH mass mea- surements is thus of great importance to shed more light into this unknown coevolutionary process of galaxy and black hole.
1.2 Supermassive Black Hole Mass Estimates
After some convincing evidence for the existence of SMBHs in galaxy centres, mass es- timations of SMBHs have been done in many ways (see, e.g., Kormendy & Ho, 2013, for a review). Recent significant development of observing facilities gradually allowed one to dynamically measure the SMBH mass in nearby galaxies. The number of direct measurements of SMBH mass is now growing, giving us expectations for getting to the bottom of the coevolutionary process of galaxy and black hole. Here I summarize the di- rect measurements and other major methods to estimate SMBH mass in various galaxies.
1.2.1 The nearest case – our galaxy
Being the closest (distance of8.28 ± 0.33 kpc, Genzel et al., 2010), vicinity of the SMBH in our galaxy can be observed at the highest spatial resolution.
Historically the radio source Sgr A* was at first assumed to be the galactic centre, al- though it was uncertain (Genzel et al., 1994). Using the dynamics of neutral and ionized gas near the galactic centre, dynamical mass was already estimated to be 106M⊙ in the 1990s by assuming the observed velocity is a circular velocity (Genzel et al., 1994; Kor- mendy & Richstone, 1995). Ten years later to that, it has become gradually accepted that the mass distribution at the central few parsecs can be described by a combination of a
S upe rm as si ve B la ck H ol e M as s ( M )
Stellar Velocity Dispersion (km s
-1)
100 200 300 400
106 107 108 109 1010
stars/early-type stars/late-type
gas/late-type
masers/late-type gas/early-type
masers/early-type
Figure 1.3: EmpiricalMBH−σ relation: 78 galaxies with dynamical SMBH mass measurements, sum- marized by McConnell & Ma (2013). Elliptical and lenticular galaxies are plotted in red, and late-type spiral galaxies are in blue. Different symbols show different dynamical methods (see also Section 1.2) that are used to measure the SMBH masses. The black line (log10(MBH/M⊙) = 8.32+5.64 log10(σ/200 km s−1)) shows a fit to the entire sample. Separate fit for early-type and late-type galaxies are shown in red line (log10(MBH/M⊙) = 8.39 + 5.20 log10(σ/200 km s−1)) and blue line (log10(MBH/M⊙) = 8.07 + 5.06 log10(σ/200 km s−1)), respectively.
Figure 1.4: MBH−Lbulgerelation at high redshift:Observational results fromz ∼0 to z >2, as shown in Figure 8 of Peng et al. (2006b). The filled circles are the local comparison sample, and the solid line is the best-fit localMBH−Lbulgerelation. The high-redshift quasar hosts are shown with open blue circles (z >1.7), open green triangles (z >2), and open red squares (z ∼ 2). The dotted line and the dashed line shows the best-fit relation for the high-redshift galaxies. Two lines differ with the SED template to make thek− corrections (Sbc for the dotted line and E/S0 or Im for the dashed line).
Figure 1.5: Redshift evolution of theMBH−σ relation: MBH−σ relation from z = 1 to 3 are computed and shown in Figure 15 of Sijacki et al. (2007). Green points show galaxies without galactic winds. Galaxies with galactic winds are shown in red. LocalMBH−σ relation is shown in black dot line (Tremaine et al., 2002). The relation evolves at low mass end (MBH∼106M⊙), but massive black holes (MBHlarger than 108M⊙) do not seem to evolve fromz = 1 to 3.
Figure 1.6: Orbit of a star S2 around the Sgr A*:S2 on the sky (left panel) and in radial velocity (right panel) plotted in Figure 17 of Genzel et al. (2010). Observations with ESO New Technology Telescope (NTT) and Very Large Telescope (VLT) are plotted in blue. Red circles are the data observed with Keck. The grey crosses are the positions of Sgr A* IR flares.
compact massive object at the position of Sgr A* and a dense nuclear star cluster (Genzel et al., 2010, and references therein). The central compact mass is proved by observing motions of gas (Crawford et al., 1985; Serabyn et al., 1988; Roberts et al., 1996) and stars (Rieke & Rieke, 1988; Krabbe et al., 1995; Genzel et al., 1996), and the most clearly by tracing the stellar orbits(Genzel & Eckart, 1999; Ghez et al., 2008; Gillessen et al., 2009). The breakthrough of tracing more than one complete orbit (Figure 1.6, Genzel et al., 2010) defined the position of a compact massive object coincides with that of Sgr A* to 2 milliarcsecond. It gives the SMBH mass of (4.30±0.30)×106M⊙(Genzel et al., 2010), the error of which is dominated by the uncertainty of its distance.
1.2.2 Dynamical modelling of nearby galaxies – megamaser systems
Unlike the case of our galaxy, extragalactic objects do not allow one to resolve individual stars around the SMBH. The Keplerian rotation of a circumnuclear gas disc, however, can be observed by using very high-angular resolution observations realized with VLBI (Very Long Baseline Interferometer). Miyoshi et al. (1995) observed water maser emission from a circumnuclear disc at the centre of NGC 4258 to establish the method of SMBH mass measurement (MBH = 3.6 × 10⁷M⊙, see Figure 1.7). Herrnstein et al. (2005) reported a follow-up observation for this source and fitted a warped-disc geometry to the maser positions to find that the inclination varies from81.4 to 91 deg (see Fig 1.8). This slightly changed the measured SMBH mass to(3.81 ± 0.01) × 107M⊙. Both of these are a correct fit assuming the model is correct. Kormendy & Ho (2013) recalculated the error budget by considering the RMS of the mass determinations from the pure Keplerian fit, the central cluster model, thee massive disc model, and the preferred warp model. The result was reported to be MBH = (3.81 ± 0.04) × 107M⊙, the error budget of which is still very small.
Greene et al. (2010) and Kuo et al. (2011) expanded this method to other megamaser sources. Despite the amount of observations to search for relevant targets (see, e.g., van den Bosch et al., 2016), the number of galaxies with their SMBH mass measured from this method is only 10. Also, SMBH mass in megamaser systems are biased to low mass (less than 108M⊙) for unknown reason. Megamaser systems are quite rare, making this method not very helpful to increase the number of galaxies in the empirical MBH −σ relation (see Section 1.1.4).
Figure 1.7: A radial velocity profile of the water masers: The Keplerian motion of water masers, as shown in Figure 3 of Miyoshi et al. (1995). The black line shows the model and the black dots are the observation.
Figure 1.8: A warped disc model for NGC 4258: Masers (black dots) and continuum (contours), as shown in Figure 1 of Herrnstein et al. (2005).
1.2.3 Dynamical modelling of nearby galaxies – stellar dynamcis
The most powerful method at this point, in terms of increasing the number of direct SMBH mass measurements, is the stellar dynamical method. Over 65% of the whole sample in Figure 1.3 is measured by using this method. The sample ranges from relatively low-mass SMBH to the heaviest SMBH (ten-billion solar mass) discovered at present.
Details of this method is summarized in Kormendy & Ho (2013) and very well de- scribed in many of the works (see, e.g., Dressler & Richstone, 1988; van der Marel & van den Bosch, 1998; Cappellari et al., 2002; Gebhardt et al., 2003; Valluri et al., 2005; McConnell et al., 2011; van den Bosch et al., 2012; Rusli et al., 2013). The brief sum- mary is given below. In the method, line-of-sight velocity distributions (LOSVD) of stars are observed with ground-based two-dimensional spectroscopes. The orbit superposition model (Schwarzschild, 1979) is applied to model the galaxy. A gravitational potential is defined as a sum of central point mass and a stellar mass distribution, often modelled by a stellar luminosity distribution multiplied by stellar mass-to-light ratio (M/L). All possible orbits are then calculated within the potential, to give three-dimensional distribu- tion of densities, velocities, and velocity dispersions, all averaged over time. Comparing the result with the observed LOSVD, the best-fit potential field will be chosen, thereby determining the mass profile including the SMBH mass. Details of the method varies among studies. For example Gebhardt & Thomas (2009) considered a dark matter mass profile in addition to SMBH and stars, while McConnell et al. (2013) considered a spatial distribution for the stellarM/L by using observations at different band.
Although careful treatments for the accuracy is given for this established method, it does not help to complete the sample of theMBH−σ relation. The dynamical modelling tools are relatively complex and the model is often restricted to be axisymmetric. The sample for this method is heavily biased to early-type galaxies, due to this modelling
tools. Triaxial modelling is becoming popular after the development by van den Bosch et al. (2008) and known to be needed especially for core elliptical galaxies with near-face-on inclination (see, e.g., van den Bosch & de Zeeuw, 2010, for details). Triaxial models are however not often used due to its expensiveness.
1.2.4 Dynamical modelling of nearby galaxies – ionized gas dynamics
This method using dynamics of ionized gas has a larger number of potential targets com- pared to other methods. Other than its broad range of targets, this method has advantages on both observation and modelling. Ionized gas kinematics is relatively easy to trace, compared to observations of stellar absorption lines. Radial velocity distribution of the ionized gas ([N II] line, for example, in de Francesco et al. 2008) can be observed by taking spectra from multiple slits (de Francesco et al., 2008) or recently by using integral field units (IFUs; e.g., Neumayer et al., 2007). In nearby galaxies, an angular resolution required for this method is feasible with both ground-based facilities (e.g., Cappellari et al., 2002; Shields et al., 2007) and HST (e.g., Ferrarese et al., 1996; Barth et al., 2001; Dalla Bont`a et al., 2009; Walsh et al., 2010). Dynamics of ionized gas is relatively easy to model, compared to the expensive modelling used in stellar dynamics method (Sec- tion 1.2.3). If the gas is in a dynamically cold disc, as normally assumed, the circular motion can be simply calculated in an axisymmetric gravitational potential (see, e.g., Cappellari et al., 2002). The mass distribution is modelled to be a summation of SMBH (point mass) and surrounding stars, described by a luminosity distribution multiplied by a stellar M/L. Dark matter halos are normally neglected in the model. The best-fit is picked to match the observed velocity field and surface brightness distribution.
Despite the above advantages, the number of measured SMBH mass from this method is only 13 objects over 72 in Figure 1.3. The difficulty to measure SMBH mass by using
this method comes from a couple of requirements that are not practical for gas. First, gas must be distributed within the radius of the SMBH sphere of influence (SOI) and properly sampled. Further, the velocity distribution has to trace circular motion. Ionized gas in reality, is not dynamically settled to the rotating motion, but sensitively corresponds to the non-gravitational perturbations such as turbulence, shocks, radiation pressure, pressure gradient, and magnetic field, to show non-circular motions (see, e.g., Shapiro et al., 2006). The turbulence of gas made it quite difficult to correctly model the velocity structure from slit observations. Recent development of IFUs are solving this problem in some cases, although the observations still cannot avoid the uncertainty from dust extinction effect.
1.2.5 Dynamical modelling of nearby galaxies – molecular gas dy-
namics
Kinematics of molecular gas can be observed at millimeter/sub-millimeter wavelengths, which enables to avoid the dust extinction effect. SMBH mass measurement using its dynamics can be simply done by assuming a thin molecular gas disc at the galaxy centre, as observed in many nearby galaxies (Young et al., 2011). The method has its potential target across the Hubble sequence, and is straightforward. Molecular gas discs are known to be dynamically cold in most galaxies (see, e.g., Young et al., 2011; Alatalo et al., 2013), and this decreases the assumption of the dynamical modelling.
Nevertheless, this method was never possible before Davis et al. (2013). Recent im- provements of mm-wavelength interferometers reached an angular resolution and sen- sitivity high enough to trace the precise kinematics of molecular gas, allowing one to measure SMBH mass. After the first report, the dynamics of molecular gas probed at mm/sub-mm wavelengths has emerged as a very promising method (see, e.g., Davis et al., 2013; Onishi et al., 2015; Barth et al., 2016a,b; Onishi et al., 2016), particularly be-
cause of the exquisite angular resolution and sensitivity afforded by the Atamaca Large Millimeter/sub-millimeter Array (ALMA).
The major advantage of this method is the enormous potential for increasing the num- ber of sample in theMBH−σ relation. For instance, Davis (2014) showed ALMA with its full capability can measure SMBH masses in ≈ 35, 000 local galaxies. The sphere of influence (SOI;RSOI ≡ GMBH/σ2, where G is the gravitational constant) of the largest SMBHs (MBH ≥108.5M⊙) is spatially resolvable across the whole of cosmic time. Need- less to say, the molecular gas method also has a potential to redress the current bias against late-type galaxies inMBH−σ studies (now only ≈ 30% of the sample).
Given the potential and its advantages for this method, it is of great importance to first prove the method is valid in both early- and late-type galaxies, and to establish the method by well addressing its possible error sources.
1.2.6 SMBH Mass Estimates at High Redshift
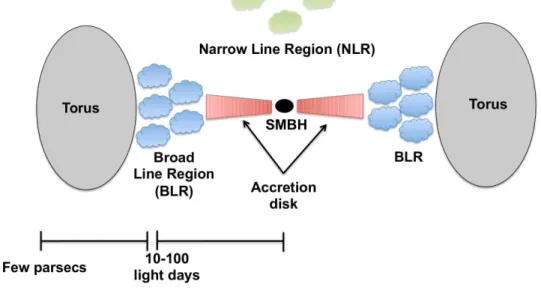
SMBH mass measurements of nearby galaxies can be done in several dynamical methods as described above, while it is crucial to know SMBH mass at high redshift in order to discuss on SMBH growth as a part of the coevolutionary process of galaxy and black hole. SMBH mass estimates for AGN hosts utilize a method called reverberation mapping. The method has been developed and originally used (see, e.g., Blandford & McKee, 1982; Netzer & Peterson, 1997) to measure the size of the broad-line region (BLR, see Figure 1.9 for a schematic view) around the central SMBH, for objects atz ≤ 0.5. The light-travel time delay is measured by taking light curves of continuum emission and broad emission line. By assuming the BLR geometry to be as sketched in Figure 1.9, the distance between the ionizing continuum source and the ionized gas, thus the characteris- tic size of the BLR can be calculated.
It is difficult to observe the light curve of sources at higher-redshift (z ≥ 2). Instead of that, the empirical correlation between the BLR radius and optical continuum luminosity (RBLR ∝L0.65−0.7
5100A˚ , Kaspi et al., 2005) is used to estimate the BLR size. With an assump- tion that the broad emission line width is showing the virial motion by the gravitational potential of a central massive object, the BLR size and the observed line width together gives an estimate of the SMBH mass (see, e.g., Peterson & Wandel, 1999; Vestergaard, 2002; Kaspi et al., 2005; Netzer et al., 2007).
The method is straightforward and allows to estimate a large number of SMBH masses for objects with unresolvable SMBH SOI. The estimated SMBH masses, however, require careful treatment. Lower-redshift sources (z ≤ 0.3), such as in Kaspi et al. (2005), are measured their gas velocity by using Hβ line width. Considering uncertainties on BLR size, variable source luminosity, BLR geometry and error of the line width, the derived SMBH masses have factor of ∼ 2 uncertainty (Netzer et al., 2007). In case of higher redshift sources (1 ≤ z ≤ 6), the gas velocity is measured from a line width of CIVλ1549 (e.g., Vestergaard, 2002; Park et al., 2013), MgII λ2798, (e.g., McLure & Jarvis, 2002; Shen et al., 2008; Trakhtenbrot & Netzer, 2012) and Hα (e.g., Greene & Ho, 2005; Shen
& Liu, 2012). A large uncertainty on the derived SMBH mass is pointed out when using CIVline in combination with a continuum emission at ∼1400 ˚A(see, e.g., Baskin & Laor, 2005; Sulentic et al., 2007). Precision of the results from these emission lines are still under discussion (e.g., Mej´ıa-Restrepo et al., 2016).
Another way to estimate the SMBH mass in high redshift galaxies is to use a grav- itational lens effect. Tamura et al. (2015) and Wong et al. (2015) used high-resolution ALMA observations and archival HST imaging to model a gravitational lens H-ATLAS J090311.6+003906 and independently derived the innermost mass distribution of the fore- ground lensing galaxy. Tamura et al. (2015) constrained the lower limit of the SMBH
Figure 1.9: A schematic view of an AGN:A typical structure of AGN, provided by a website of Dr. C. Ricci1. The BLR emits the broad optical/UV lines. The accretion disc is considered as the continuum emission source. The reverberation mapping technique measures the inner radius of the BLR to be typically 10-100 light days.
mass to be 3.0 × 10⁸M⊙, and Wong et al. (2015) ruled out the SMBH mass of less than 3.16 × 10⁸M⊙. An estimate of the SMBH mass by using the MBH − σ relation (Kormendy & Ho, 2013) and σ ∼ 265 km s−1 is given in Tamura et al. (2015) to be MBH ∼ 1.0 × 10⁹M⊙, and both of the results are consistent with this estimate. Upper limit of the SMBH mass can be given with deeper ALMA observations to detect the CO emission from the foreground galaxy.
1.2.7 Cross Checks Between SMBH Mass Measuring Methods
A couple of SMBH mass measuring methods are now being developed and used. The results needs to be verified by independent methods. The cross check has been done so far for 12 objects by using multiple SMBH mass measuring methods. The results can be
1http://www.isdc.unige.ch/˜ricci/Website/Active Galactic Nuclei.html
early-type late-type
log M
BH/M
sun(stars)
lo g M
BH/M
sun( g as )
Figure 1.10: Cross checks between SMBH mass measuring methods: 11 Examples of cross checks done so far between ionized gas dynamics method and stellar dynamics method. Red points represent early-type galaxies and late-types are in blue. The plots are also summarized in Table 1.1. Despite the scatter, most of the data are clearly below the line ofx = y, thus suggesting that ionized gas method derives systematically lower SMBH masses compared to stellar dynamics method.
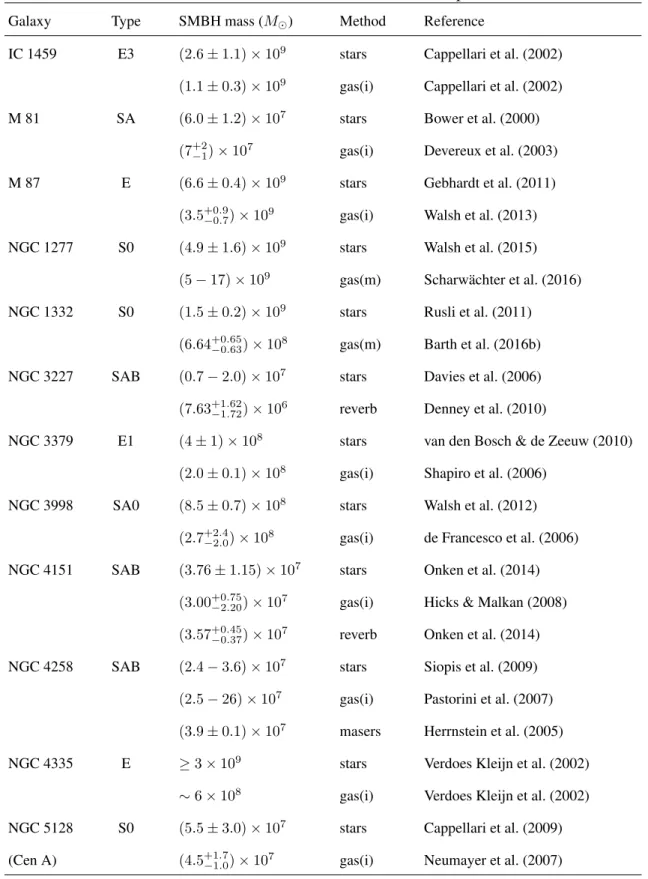
compared in Table 1.1 and Figure 1.10. As discussed and summarized in Kormendy & Ho (2013) with less plots, gas dynamical measurement seem to underestimate the SMBH mass, although the small sample prevents us from giving a statistically good enough con- clusion. The molecular gas method will not only increase the sample, but enables to give a cross check for all other methods. This supports the importance of developing the method, which will be described in Chapter 2 (see also Onishi et al., 2015), Chapter 3 (see also Onishi et al., 2016) and in Chapter 4 (Onishi et al. 2017 in prep.).
Table 1.1: SMBH mass measurements with multiple methods
Galaxy Type SMBH mass (M⊙) Method Reference
IC 1459 E3 (2.6 ± 1.1) × 109 stars Cappellari et al. (2002) (1.1 ± 0.3) × 109 gas(i) Cappellari et al. (2002)
M 81 SA (6.0 ± 1.2) × 107 stars Bower et al. (2000)
(7+2−1) × 107 gas(i) Devereux et al. (2003)
M 87 E (6.6 ± 0.4) × 109 stars Gebhardt et al. (2011)
(3.5+0.9−0.7) × 109 gas(i) Walsh et al. (2013) NGC 1277 S0 (4.9 ± 1.6) × 109 stars Walsh et al. (2015)
(5 − 17) × 109 gas(m) Scharw¨achter et al. (2016) NGC 1332 S0 (1.5 ± 0.2) × 109 stars Rusli et al. (2011)
(6.64+0.65−0.63) × 108 gas(m) Barth et al. (2016b) NGC 3227 SAB (0.7 − 2.0) × 107 stars Davies et al. (2006) (7.63+1.62−1.72) × 106 reverb Denney et al. (2010)
NGC 3379 E1 (4 ± 1) × 108 stars van den Bosch & de Zeeuw (2010) (2.0 ± 0.1) × 108 gas(i) Shapiro et al. (2006)
NGC 3998 SA0 (8.5 ± 0.7) × 108 stars Walsh et al. (2012) (2.7+2.4−2.0) × 108 gas(i) de Francesco et al. (2006) NGC 4151 SAB (3.76 ± 1.15) × 107 stars Onken et al. (2014)
(3.00+0.75−2.20) × 107 gas(i) Hicks & Malkan (2008) (3.57+0.45−0.37) × 107 reverb Onken et al. (2014) NGC 4258 SAB (2.4 − 3.6) × 107 stars Siopis et al. (2009)
(2.5 − 26) × 107 gas(i) Pastorini et al. (2007) (3.9 ± 0.1) × 107 masers Herrnstein et al. (2005)
NGC 4335 E ≥3 × 10⁹ stars Verdoes Kleijn et al. (2002)
∼6 × 10⁸ gas(i) Verdoes Kleijn et al. (2002) NGC 5128 S0 (5.5 ± 3.0) × 107 stars Cappellari et al. (2009) (Cen A) (4.5+1.7−1.0) × 107 gas(i) Neumayer et al. (2007)
Column 1 is the object name; Column 2 is the Hubble type; Column 3 is the SMBH mass measured with method shown in Column 4; Column 4 shows the method. gas(i) stands for ionized gas, and gas(m) means molecular gas. Column 5 is the reference for SMBH mass measurements.
1.3 Road Map
I have described so far the importance of the SMBH mass measurement to unveil the coevolutoinary process of galaxy and black hole. Dynamical measurements of SMBH masses have been done for ∼ 80 galaxies by using a handful of methods. Providing a broad range of target galaxy types and SMBH masses, the molecular gas method will help dramatically increasing the sample for the MBH − σ relation, and will thus be a powerful tool to help understanding the key question in contemporary astrophysics.
This work focuses on the method development to measure the SMBH mass in various nearby galaxies observed with radio interferometers. The first SMBH mass measurement from ALMA observation (Onishi et al., 2015) is described in Chapter 2. By utilizing a more sophisticated fitting procedure, another SMBH mass measurement by Onishi et al. (2016) is described in Chapter 3. Observing with higher angular resolution, we repeat the method at a different galaxy to measure the SMBH mass and included a velocity dispersion distribution in our model (Chapter 4, Onishi et al. 2017 in prep.).
As a general discussion, theMBH−σ relation is renewed and explored in Chapter 5. Possible discussions on the connection between the coevolutionary process of galaxy and black hole, and the relation itself is described in the section. I finally conclude our work in Chapter 6.
Chapter 2
A Development of SMBH Mass
Measuring Method
2.1 Abstract of the Chapter
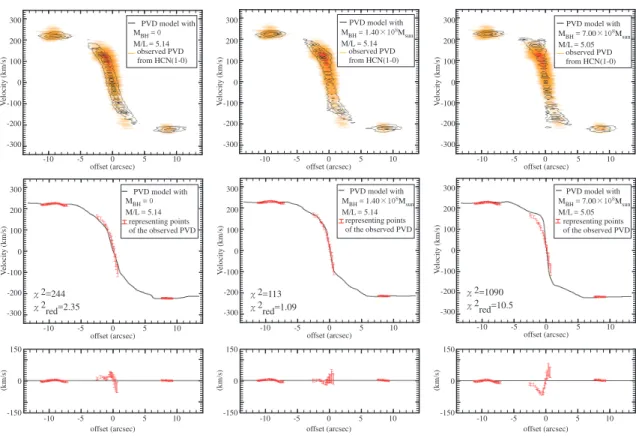
Citing from our work (Onishi et al., 2015), I here present a measurement of the mass of the supermassive black hole (SMBH) in the nearby type-1 Seyfert galaxy NGC 1097 using Atacamma Large Millimeter/Submillimeter Array (ALMA) observations of dense gas kinematics. Dense molecular gas dynamics are traced with HCN(J = 1 − 0) and HCO+(J = 1 − 0) emission lines. Assuming a host galaxy inclination of 46◦, we derive a SMBH mass, MBH = 1.40+0.27−0.32 × 10⁸M⊙, and an I-band mass to light ratio to be 5.14+0.03−0.04, using HCN(J = 1 − 0). The estimated parameters are consistent between the two emission lines. The measured SMBH mass is in good agreement with the SMBH mass and bulge velocity dispersion relationship.
This work established the SMBH mass measuring method using molecular gas dy- namics, and the result demonstrated ALMA’s potential for deriving accurate SMBH masses, especially for nearby late-type galaxies. Larger samples and accurate SMBH masses will
further elucidate the relationship between the black hole (BH) and host galaxy properties and will constrain the coevolutionary growth of galaxies and BHs.
2.2 Introduction
As discussed in Chapter 1, dynamical measurements of SMBH mass are done by ob- serving the kinematics of masers (see Section 1.2.2), stars (see Section 1.2.3), or ionized gas (see Section 1.2.4). Recent development of observing facilities, especially of mil- limeter/submillimeter interferometers have enabled to resolve the gravitational sphere of influence of a SMBH in nearby galaxies. This led to the first SMBH mass measurement using kinematics of CO gas in a nearby S0 galaxy NGC 4526, presented in Davis et al. (2013).
This new method is expected to give a broad range of sample, in terms of galaxy type, and to increase the number of sample. We therefore use the method initially em- ployed by Davis et al. (2013) and extend it to measure the SMBH mass in a barred spiral galaxy. Also, aiming to confirm the method, we use two different molecular gas species, HCN(J = 1 − 0) and HCO+(J = 1 − 0), to trace the gas kinematics and measure the SMBH mass from each. Our target here is a nearby barred spiral galaxy NGC 1097, observed with ALMA (Project code = 2011.0.00108.S; PI = K. Kohno).
The observations and data reduction are described in Section 2.3. The SMBH mass measurement method is explained in Section 2.4. Section 2.5 contains discussions about the effect of dust extinction on the derived SMBH mass (Section 2.5.1), how the inclina- tion angle of NGC 1097 affects the result (Section 2.5.2), the dependence of SMBH mass on the molecular gas species used to trace the dynamics (Section 2.5.3). The conclusions are summarized in Section 2.6.
2.2.1 The Target – NGC 1097
NGC 1097 is a nearby Type-1 Seyfert galaxy at a distance of 14.5 Mpc (Tully, 1988) (∼ 70 pc arcsecond−1). The position of the nucleus is determined by the peak position of the 6 cm continuum emission (Hummel et al., 1987): RA(J2000.0) = 02h46m18s.96, DEC(J2000.0) = −30◦16′28′′.9. The peak position of the 860 µm continuum emission coincides with the 6 cm peak (Izumi et al., 2013). Properties of NGC 1097 are summa- rized in Table 2.1.
The SMBH mass in NGC 1097 is estimated to be (1.2 ± 0.2) × 108M⊙by Lewis & Eracleous (2006) using the empiricalMBH−σ relation from Tremaine et al. (2002) with an observed σ = 196 ± 5 km s−1. The uncertainty in this estimate is large, depending on the assumed MBH −σ relation. The latest MBH − σ relation [log10(MBH/M⊙) = 8.32 + 5.64 log10(σ/200 km s−1), McConnell & Ma (2013)] would yield SMBH mass of (1.9 ± 0.3) × 108M⊙. Note that this relation is a fit to both late-type and early-type galaxies. When selecting only the late-type galaxies, the MBH − σ relation becomes log10(MBH/M⊙) = 8.07 + 5.06 log10(σ/200 km s−1) (McConnell & Ma, 2013) and the estimated SMBH mass becomes(1.1 ± 0.3) × 108M⊙.
The enclosed mass in 40 pc radius has been studied by (Izumi et al., 2013) to be 2.8 × 10⁸M⊙, using the dynamics fromHCN(J = 4 − 3) emission line. In contrast, Fathi et al. (2013) report a dynamical mass in40 pc radius as 8.0 × 10⁶M⊙from the same data of Izumi et al. (2013). The difference occurs because Fathi et al. (2013) assume a thin disc and extracts the non-circular motions of the gas while Izumi et al. (2013) assume a simple Keplerian rotation. Note but the dynamical mass of Izumi et al. (2013) includes all the mass within that radius, not showing the intrinsic SMBH mass. A more detailed study of NGC 1097 is thus necessary to precisely measure the SMBH mass.
Table 2.1: Properties of NGC 1097
Parameter Value Reference
Morphology SB(s)b de Vaucouleurs et al. (1991)
Nuclear activity Type 1 Seyfert Storchi-Bergmann et al. (1993)
Position of nucleus Hummel et al. (1987)
R. A.(J2000.0) 02h46m18s.96 DEC.(J2000.0) −30◦16′28′′.9
Systemic velocity (km s−1) 12531 Onishi et al. (2015)
Position angle (◦) 130 Onishi et al. (2015)
Inclination angle (◦) 46±5 Ondrechen et al. (1989)
Distance (Mpc) 14.5 Tully (1988)
Linear scale (pc arcsec−1) 70 Tully (1988)
I-band luminosity (mag) 8.09 Springob et al. (2007)
1Systemic velocity here is a heliocentric velocity determined with molecular lines. Koribalski et al. (2004) shows the heliocentric velocity to be 1271 km s−1determined with HIPASS observation.
2.3 Observation
NGC 1097 was observed with the band 3 receiver on ALMA using the two sideband dual- polarization setup as a cycle 0 observation (Project code = 2011.0.0108.S; PI = K. Kohno). The observations were conducted on 2012 Jul 29 and 2012 Oct 19 with an hour angle from
−4 to 2 and a total on-source time of 105.24 minutes. The antennas were in the Cycle 0 extended configuration (400m baselines) which resulted in a synthesized beam of1′′.60 × 2′′.20 at a position angle −81.2◦ (∼ 112 pc × 154 pc). The receivers were tuned to cover the frequency range from 87.275 GHz to 100.917 GHz with two spectral windows each in the upper sideband (USB) and the lower sideband (LSB). Each spectral window had a bandwidth of 1.875 GHz with 3840 channels. The channel separation was 0.488 MHz. Observational parameters are summarized in Table 2.2. The field of view (full width half maximum of the primary beam) at these frequencies was69′′. The data were reduced and imaged using CASA (Common Astronomy Software Applications) 4.0 with a robustness parameter of 0.5. We binned the data by 2 channels to improve the signal to noise ratio and our final resolution is 0.976 MHz or ∼3 km s−1. Molecular gas emission is detected over 560 km s−1 (HCN(J = 1 − 0) emission is seen from 88.1524-88.3467 GHz and HCO+(J = 1 − 0) from 88.7139-88.9082 GHz). The integrated intensity moment zero and intensity weighted velocity maps were made using Karma (Gooch, 1996). These are shown in Figure 2.1. The noise in the integrated intensity maps is 22 (mJy beam−1km s−1) in the HCN(J = 1 − 0) and 26 (mJy beam−1 km s−1) in theHCO+(J = 1 − 0) maps respectively. The peak flux is detected at52σ in the HCN(J = 1 − 0) map and at 29σ in theHCO+(J = 1 − 0) map respectively. The data clearly show the rotation dominated kinematics of the molecular gas around the SMBH.
1000
600
400
200
0
mJy/beam km/s
2h46m20.5s 20.0s 19.5s 19.0s 18.5s 18.0s
R.A. (J2000.0)
-30 16 20
-30
-40
Decl. (J2000.0) 800
HCN(1-0) moment 0
200
100
0
-100
-200 Vrad(km/s)
2h46m20.5s 20.0s 19.5s 19.0s 18.5s 18.0s
R.A.(J2000.0)
-30 16 20
-30
-40
Decl. (J2000.0)
HCN(1-0) moment 1
600
400
200
0
mJy/beam km/s
2h46m20.5s 20.0s 19.5s 19.0s 18.5s 18.0s
R.A.(J2000.0)
-30 16 20
-30
-40
Decl. (J2000.0)
HCO+(1-0) moment 0
200
100
0
-100
-200 Vrad(km/s)
2h46m20.5s 20.0s 19.5s 19.0s 18.5s 18.0s
R.A.(J2000.0)
-30 16 20
-30
-40
Decl. (J2000.0)
HCO+(1-0) moment 1
Figure 2.1: NGC 1097 Moment 0 and 1 Maps of HCN(J = 1 − 0) and HCO+(J = 1 − 0): (Left side) Integrated intensity map (moment 0) for HCN(J = 1 − 0) (upper panel, integrated for 88.1524-88.3467 GHz) and HCO+(J = 1 − 0) (lower panel, 88.7139-88.9082 GHz). The rms noise level (1σ) in each integrated intensity map was 22 (mJy beam−1 km s−1) in HCN(J = 1 − 0), and 26 (mJy beam−1km s−1) inHCO+(J = 1 − 0). The map is shown in grey scale with contour levels 3σ to 45σ in steps of 7σ for HCN(J = 1 − 0) (upper panel), and 3σ to 24σ in steps of 7σ for HCO+(J = 1 − 0) (lower panel). The synthesized beam size (1′′.60 × 2′′.20 at P A = −81.2◦) is shown as the ellipse at the bottom left of each panel. (Right side) The intensity weighted velocity map forHCN(J = 1 − 0) (upper panel) andHCO+(J = 1 − 0) (lower panel). Lower limit of the intensity is set to each map as 3σ. The velocity resolution of each image is approximately 3.3 km s−1.
Table 2.2: ALMA observation parameters Parameter
Date 2012 Jul 29, Oct 19
On-source time 105.24 minutes
Configuration extended (Cycle 0)
Phase center:
R. A.(J2000.0) 02h46m19s.06 DEC.(J2000.0) −30◦16′29′′.7
Primary beams 69′′
LSB USB
Frequency coverage (GHz) 85.400-89.104 97.271-100.917 Velocity resolution (km s−1) 1.7 1.5 Central frequency of
each spectral window (GHz) 86.338, 88.166 98.209, 99.979