UNICEF
Innocenti Report Card 13
Children in the Developed World
Fairness for Children
A league table of inequality in child
well-being in rich countries
Innocenti Report Card 13 was written by John Hudson and Stefan Kühner. The UNICEF Office of Research – Innocenti would like to acknowledge the generous support for Innocenti Report Card 13 provided by the Government of Italy.
Any part of this Innocenti Report Card may be freely reproduced using the following reference:
UNICEF Office of Research (2016). ‘Fairness for Children: A league table of inequality in child well-being in rich countries’, Innocenti Report Card 13, UNICEF Office of Research – Innocenti, Florence.
The Innocenti Report Card series is designed to monitor and compare the performance of economically advanced countries in securing the rights of their children.
In 1988 the United Nations Children’s Fund (UNICEF) established a research centre to support its advocacy for children worldwide and to identify and research current and future areas of UNICEF’s work. The prime objectives of the Office of Research – Innocenti are to improve international understanding of issues relating to children’s rights, to help facilitate full implementation of the Convention on the Rights of the Child, supporting advocacy worldwide. The Office aims to set out a comprehensive framework for research and knowledge within the organization, in support of its global programmes and policies. Through strengthening research partnerships with leading academic institutions and development networks in both the North and the South, the Office seeks to leverage additional resources and influence in support of efforts towards policy reform in favour of children.
Publications produced by the Office are contributions to a global debate on children and child rights issues and include a wide range of opinions. For that reason, some publications may not necessarily reflect UNICEF policies or approaches on some topics. The views expressed are those of the authors and/or editors and are published in order to stimulate further dialogue on issues affecting children.
Cover photo © Blend Images / Alamy Stock Photo
©United Nations Children’s Fund (UNICEF), April 2016 ISBN: 978 88 6522 045 0
eISBN: 978-92-1-057893-6
UNICEF Office of Research – Innocenti Piazza SS. Annunziata, 12
50122 Florence, Italy Tel: +39 055 2033 0 Fax: +39 055 2033 220 [email protected] www.unicef-irc.org
Fairness for Children
A league table of inequality in child
well-being in rich countries
Innocenti Report Card 13 Children in the Developed World
INTRODUCTION
SECTION 1
This Report Card presents an overview of inequalities in child well-being in 41 countries of the European Union (EU) and the Organisation for Economic Co-operation and Development (OECD). It focuses on ‘bottom-end inequality’ – the gap between children at the bottom and those in the middle – and addresses the question ‘how far behind are children being allowed to fall?’ in income, education, health and life satisfaction.
Why inequality?
With the gap between rich and poor at its highest level for some three decades in most OECD countries, there is now a renewed focus on questions surrounding inequality. While much political debate has centred on the growing income of the top 1 per cent, in many rich countries incomes below the median have grown less quickly than have those above the median.1
Across the OECD, the risks of poverty have been shifting from the elderly towards youth since the 1980s. These developments accentuate the need to monitor the well-being of the most
disadvantaged children, but income inequality also has far-reaching consequences for society, harming educational attainment, key health outcomes and even economic growth.2 A concern with fairness and social justice requires us to consider whether some members of society are being left so far behind that it unfairly affects their lives both now and in the future.This Report Card asks the same underlying question as Report Card 9,3 which focused on inequality in child well-being, but uses the most recent data available and includes more countries. Inequality, fairness and children Questions of fairness and social justice have a special resonance when inequalities among children,
rather than adults, are the focus of attention.
Social inequalities among adults may be justifiable if they have arisen through fair competition and under conditions of equality of opportunity. But when it comes to children, the social and economic circumstances they face are beyond their control, and so differences in merit cannot reasonably be advanced as justification for inequalities among them. In addition, few dispute that childhood experiences have a profound effect not only on children’s current lives, but also on their future opportunities and prospects. Likewise, social and economic disadvantages in early life increase the risk of having lower earnings, lower standards of health and lower skills in adulthood. This in turn can perpetuate disadvantage across generations.4 None of this is the fault of the child.
“In all actions concerning children, whether
undertaken by public or private social welfare
institutions, courts of law, administrative
authorities or legislative bodies, the best interests
of the child shall be a primary consideration.”
– United Nations Convention on the Rights of the Child, 1989 (article 3)
S E C T I O N 1 I N T R O D U C T I O N
Box 1 Social justice
and fairness
Comparing bottom-end inequality across rich countries The league tables in this Report Card rank countries according to how far children at the bottom are allowed to fall behind their peers in income, education, health and life satisfaction. We also provide an overall league table of inequality in child well-being that summarizes performance across all four of these dimensions.
The measures of inequality in the league tables are put into context through the use of indicators that capture how many children in each country have low income, low educational achievement, poor health or low levels of life satisfaction. This offers a wider picture of how far children’s rights are being upheld in rich countries. The league tables presented in Section 2 compare countries on the basis of how far children are being allowed to fall behind. Sections 3, 4, 5 and 6 offer a more detailed exploration of trends in inequality affecting income, education, health and life satisfaction, respectively. Each of these sections also considers the impacts of inequality on child well-being. Section 7 returns to the general question of fairness and inequality, considering the extent to which child well-being in rich countries is shaped by deeply rooted social and economic inequalities over which children have no control. Section 8 presents conclusions and recommendations.
The findings of Report Card 9 were presented as a “first attempt to measure nations by the standards of a ‘just society’ as defined by the American political philosopher John Rawls”.i Though subject to much debate since its publication, Rawls’ ground-breaking analysis of justice as fairness provides a lens through which our exploration of bottom- end inequality over time can be viewed.
Rawls asked us to imagine an “original position” in which the overall shape of society is debated before its creation. He then asked us to imagine that a “veil of ignorance” would prevent individuals from knowing their position in the society being created. Through this thought experiment, he effectively reframed the question ‘what does a fair society look like?’ to become ‘what kind of society would reasonable citizens consent to living in?’
Rawls argued that a key principle to emerge from such a bargaining process would be that people would agree that social and economic inequalities could exist in a fair society, but only so far as they (i) emerged from fair conditions of equality of opportunity and (ii) were to the greatest benefit of the least-advantaged members of society – which he termed the “difference principle”.ii In other words, in Rawls’ model inequalities in material living conditions are permissible if they benefit all (e.g. by creating higher standards of living for everyone) and arise from a position of equality of opportunity that allows all a fair chance of succeeding.
In this Report Card the themes that Rawls identified are explored, but with an exclusive focus on the position of children. Inequalities in children’s lives are examined in detail, as is the extent to which inequality itself shapes outcomes for children. These issues are considered alongside a concern with how far inequalities in child well- being are connected to social and economic inequalities over which children have no control.
i UNICEF (2010). ‘The Children Left Behind: A league table of inequality in child well-being in the world’s rich countries’, Innocenti Report Card 9, UNICEF Innocenti Research Centre, Florence (Box 3).
ii Rawls, J. (1971). Theory of Justice, Harvard University Press, Cambridge, MA. S E C T I O N 1 I N T R O D U C T I O N
Rank Country Relative income gap Child poverty rate (50% of the median)
1 Norway 37.00 4.5
2 Iceland 37.76 6.4
3 Finland 38.34 3.7
4 Denmark 39.54 4.8
5 Czech Republic 39.62 6.3
6 Switzerland 39.64 7
7 United Kingdom 39.94 9.3
8 Netherlands 40.64 5.7
9 Luxembourg 41.21 13
10 Ireland 41.49 6.9
11 Austria 41.87 9.6
12 Germany 43.11 7.2
13 France 43.95 9
14 Australia 44.75 9.3
15 Republic of Korea 45.74 8
16 Sweden 46.23 9.1
17 New Zealand 46.52 11
18 Cyprus 47.19 9.1
19 Slovenia 47.29 8.3
20 Malta 48.21 14.5
21 Hungary 48.34 15
22 Belgium 48.41 10.1
23 Poland 51.76 14.5
24 Canada 53.19 16.9
25 Slovakia 54.21 13.7
26 Croatia 54.59 14.8
27 Lithuania 54.81 17.8
28 Estonia 55.55 12.4
29 Turkey 57.07 22.8
30 United States 58.85 20
31 Chile 59.03 26.3
32 Latvia 59.66 16.3
33 Portugal 60.17 17.4
34 Japan 60.21 15.8
35 Italy 60.64 17.7
36 Spain 62.62 20.2
37 Israel 64.58 27.5
38 Greece 64.69 22.3
39 Mexico 65.00 24.6
40 Bulgaria 67.01 23.1
41 Romania 67.08 24.3
LEAGUE TABLES
SECTION 2
See data sources and notes on page 44.
League Table 1 Inequality in income The four main league tables
presented in this Report Card rank rich countries on the basis of bottom-end inequality in children’s income, education, health and life satisfaction. Each league table provides a snapshot of how far rich countries allow their most
disadvantaged children to fall behind the ‘average’ child. The league tables are supplemented by a fifth league table, which provides a summary of the overall record across these four areas. Each of the main league tables puts its measure of inequality into context, using an indicator that captures how many children fall in the very bottom of the distribution of income, educational achievement, health and life satisfaction. League Table 1 ranks countries on the size of their relative income gap. This measure of bottom-end inequality captures how far the poorest children are being allowed to fall behind the ‘average’ child in each country.
To provide context for the inequality measure, League Table 1 also displays the child poverty rate (measured as 50 per cent of the national median) for each country. More detail about these measures is provided in the box ‘Interpreting the data: League Table 1 – Income’.
S E C T I O N 2 L E A G U E T A B L E S
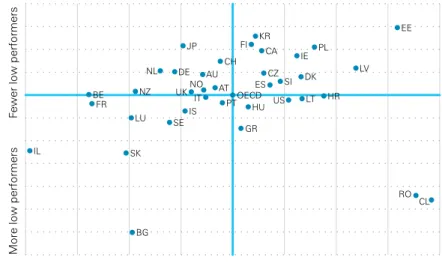
Interpreting the data: League Table 1 – Income
Higher income gap Lower income gap
Lower povertyHigher poverty
Child poverty rate
Relative income gap
FI DK NO NL CZIS
CH UK DE IE
AT
LU FR AU KR SI CY SE BE
NZ
MT PL HU EE
SK HR
CA LT JP LV
TT PT US
TR ES GR
CL IL MX BG RO
Key findings:
»
The Scandinavian countries, with the exception of (mid-ranking) Sweden, have the smallest relative income gaps. In these countries, the disposable household income of the child at the 10th percentile is around 38 per cent lower than that of the child at the middle of the income distribution.»
In 19 of 41 rich countries the relative income gap exceeds 50 per cent: the child at the 10th percentile has less than half the disposable household income of the child at the median.»
In Bulgaria and Romania, the relative income gap is 67 per cent, i.e. household income of children at the 10th percentile is 67 per cent lower than at the median.»
Income gaps in excess of 60 per cent are also found in the larger southern European countries (Greece, Italy, Portugal and Spain), as well as in Israel, Japan and Mexico.»
Relative income gaps and levels of poverty are closely related (Figure 1): higher levels of poverty tend to be found in countries with higher income gaps (bottom-left quadrant of Figure 1) and lower levels of poverty in countries with lower income gaps.Calculations of bottom-end income inequality for children, also referred to as the relative income gap, are based on the disposable incomes of households with children aged 0 to 17 (after adding benefits, deducting taxes, and making an adjustment for the different sizes and compositions of households).
To measure inequality at the bottom end of the distribution, the household income of the child at the 50th percentile (the median) is compared with the household income of the child at the 10th percentile (i.e. poorer than 90 per cent of children); the gap between the two, reported as a percentage of the median, provides us with a measure of how far behind the poorest children are being allowed to fall.
For example, in Norway, the household income of the child at the 10th percentile is 37 per cent lower than that of the child in the middle of the income distribution – the median.
Child poverty is measured as the percentage of children in households with incomes below 50 per cent of national median income (after taking taxes and benefits into account and adjusting for family size and composition).
The league table uses survey data for 2013 (or the most recent year available). See data sources on page 44.
Figure 1 Relative income gap versus levels of poverty
Sources: see page 44 – League Table 1.
S E C T I O N 2 L E A G U E T A B L E S
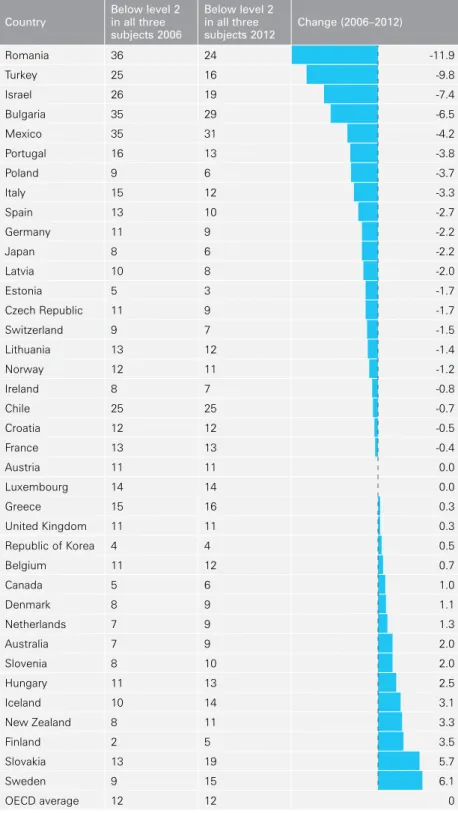
Rank Country Achievement gap
Share of children below proficiency level 2 in all three subjects
1 Chile 1.92 24.6
2 Romania 1.77 24.0
3 Estonia 1.59 3.2
4 Latvia 1.19 8.3
5 Croatia 0.88 11.7
6 Poland 0.79 5.7
7 Lithuania 0.67 12.1
8 Denmark 0.66 9.3
9 Ireland 0.62 6.8
10 United States 0.54 12.2
11 Slovenia 0.46 9.9
12 Spain 0.36 10.4
13 Czech Republic 0.30 8.9
14 Canada 0.28 6.2
15 Republic of Korea 0.22 4.4
16 Finland 0.18 5.3
17 Hungary 0.15 13.1
18 Greece 0.08 15.7
19 Portugal -0.10 12.6
20 Switzerland -0.12 7.5
21 Austria -0.17 10.7
22 Italy -0.26 11.9
23 Norway -0.28 11.0
24 Australia -0.29 9.1
25 United Kingdom -0.40 11.2
26 Iceland -0.46 13.6
27 Japan -0.48 5.5
28 Germany -0.56 8.8
29 Sweden -0.61 15.0
30 Netherlands -0.70 8.6
31 New Zealand -0.94 11.1
32 Bulgaria -0.97 28.6
33 Luxembourg -0.98 14.4
34 Slovakia -1.03 18.8
35 France -1.36 12.7
36 Belgium -1.39 11.5
37 Israel -1.96 18.5
Mexico 2.19 31.0
Turkey 1.76 15.6
League Table 2 ranks countries according to their achievement gap in the OECD’s Programme for International Student Assessment (PISA) tests. This measure captures how far low-achieving students are allowed to fall behind the
‘average’ child in reading, maths and science literacy at the age of 15.
See data sources and notes on page 44.
League Table 2 Inequality in education
League Table 2 also displays the proportion of students performing at below PISA’s proficiency level 2 in all three subjects.
More detail about these measures is provided in the box ‘Interpreting the data: League Table 2 – Education’.
Key findings:
»
The two countries with the lowest achievement gap, Chile and Romania, have a very high proportion of students falling below proficiency level 2 in all three subjects. This means that, although fewer children are left behind the ‘average’ child in these countries, a higher proportion of children lack basic skills and competencies.»
Two high-income countries, Belgium and France, are found at the bottom of the league table, with very large achievement gaps.»
Across rich countries, the proportion of 15-year-olds falling below proficiency level 2 in all three subjects is as low as 3–5 per cent in Estonia, Finland and Korea, and as high as 24–28 per cent in Bulgaria, Chile and Romania.»
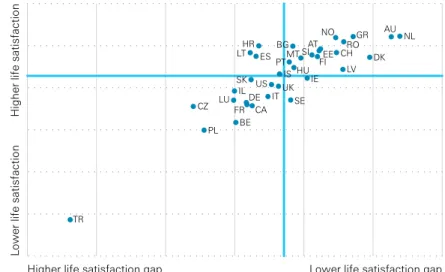
Figure 2 depicts the relationship between the achievement gap and the proportion of children below proficiency level 2 in all three subjects. Countries in the upper- right quadrant are the best performers, as they combine low achievement gaps with a low proportion of children falling below proficiency level 2 in all three subjects; countries in the bottom-left corner are the worst performers, displaying both high achievement gaps and a high absolute proportion of children below proficiency. It highlights the fact that minimizing the achievement gap does not require countries to ‘trade off’ equality against standards. In Estonia, Ireland, Latvia and Poland, low bottom-end inequality in educational achievement is combined with a low proportion of children scoring belowS E C T I O N 2 L E A G U E T A B L E S
Interpreting the data: League Table 2 – Education
Higher achievement gap Lower achievement gap
Fewer low performers More low performers
Share of low performers in all three subjects
Achievement gap BG
IL SK
FR BE
LU NZ
SE IS
NL DE
UK IT AT AU JP
PT
GR HU OECD CH
US ES SI
CZ FI KRCA
LT DK IE
HR PL
RO LV
EE
CL NO
The OECD’s PISA measures the competence of students aged 15 in maths, reading and science literacy. Data from the most recent survey, conducted in 2012, are used in League Table 2.
The educational achievement gap is measured as the PISA test-score point difference between students at the median and the 10th percentile.
In order to allow achievement gaps for the three subjects to be combined in a single measure, in League Table 2 the score-point differences between the median and the 10th percentile in each subject are converted into z-scores, which are then averaged across subjects to provide an overall achievement gap for each country. Z-scores measure the standardized distance of any given value from the group average. Positive figures above 0.5 represent a score that is above the OECD average; negative figures below -0.5 indicate a score that is below average; and figures between -0.5 and 0.5 are considered close enough to be indistinguishable from the average.
Figure 2 Achievement gap and educational disadvantage
Source: PISA 2012. See page 44 – League Table 2. Note: Mexico and Turkey are excluded.
proficiency level 2 in all three subjects.
»
On the other hand, a high achievement gap can exist alongside a comparatively large proportion of students achieving below proficiency level 2 in all three subjects. This is the case in Bulgaria, Israel, Luxembourg, Slovakia and Sweden (bottom-left quadrant).»
Estonia is the best-performing country in terms of combining good outcomes on both measures. Yet even here, the achievement gap in reading equates to 2.5 years of schooling lost for the child at the 10th percentile, compared with the‘average’ child.
For example, in Chile the average z-score across the three subjects is 1.92 standard deviations above the OECD average.
PISA also maps test scores against six levels of achievement that capture milestones related to key
‘aspects’ of each subject that are defined independently by experts in the field.
PISA defines low academic performance as a score that is below the threshold of proficiency level 2 in each subject.
League Table 2 provides information on the proportion of students in each country who fall below proficiency level 2 for all three subjects. Low performance at age 15 in all three subjects is a proxy for profound educational disadvantage.
In Section 4 we analyse the raw PISA test scores (rather than the z-scores) for reading. A difference of 41 points corresponds to the equivalent of
approximately one year of formal schooling.
S E C T I O N 2 L E A G U E T A B L E S
Rank Country Relative health gap One or more health complaints every day
1 Austria 23.64 17.7
2 Germany 24.76 19.6
3 Switzerland 24.95 16.3
4 Norway 25.15 14.9
5 Denmark 25.50 17.6
6 Finland 25.89 15.0
7 Portugal 26.39 17.7
8 Netherlands 26.74 19.9
9 Czech Republic 26.84 25.3
10 Spain 27.31 23.9
11 Greece 27.37 27.9
12 Croatia 27.59 25.7
13 Estonia 27.65 23.8
14 United States 27.98 28.2
15 Belgium 28.14 23.8
16 Slovenia 28.29 18.7
17 Latvia 28.61 23.3
18 Hungary 28.79 22.2
19 United Kingdom 28.87 21.4
20 Ireland 28.90 21.0
21 Slovakia 28.96 23.8
22 Sweden 29.08 19.1
23 France 29.18 30.7
24 Canada 29.27 22.6
25 Lithuania 29.31 23.0
26 Bulgaria 29.39 30.6
27 Australia 29.86 21.8
28 Italy 30.11 30.5
29 Luxembourg 30.27 24.1
30 Malta 30.56 30.7
31 Iceland 31.08 22.6
32 Romania 33.95 31.2
33 Poland 34.05 27.4
34 Turkey 34.54 53.3
35 Israel 38.88 29.7
See data sources and notes on page 44.
League Table 3 Inequality in health League Table 3 ranks countries in
terms of the size of the relative gap in children’s self-reported health symptoms. For each country, the relative gap compares a child with frequent reporting of health symptoms and an ‘average’ child at the median of the health scale, with the gap measured as the difference between the two calculated as a share of the median. This captures the extent to which children at the bottom are allowed to fall behind the ‘average’ child in health. League Table 3 also displays the proportion of children who report one or more health symptoms every day. This indicates the proportion of children with poor self-reported health in each country. More detail about these measures is provided in the box ‘Interpreting the data: League Table 3 – Health’. Key findings:
»
The average relative gap in children’s self-reported health symptoms is 29 per cent across the 35 countries examined.»
The smallest relative health gaps are found in Austria (23.6 per cent), Germany (24.8 per cent) and Switzerland (25 per cent). Denmark, Finland and Norway also have comparatively small gaps in self-reported health.»
The largest relative health gaps are found in Israel (38.9 per cent), Turkey (34.5 per cent) and Poland (34.1 per cent).»
More than half of children in Turkey and around a third of children in Bulgaria, France, Israel, Italy, Malta and Romania report one or more health symptoms a day.S E C T I O N 2 L E A G U E T A B L E S
Interpreting the data: League Table 3 – Health
Higher health gap Lower health gap
Fewer complaintsMore complaints
One or more health complaints every day
Relative health gap TR
IL RO
PL
MT IT
BG FR IS LU AU
LT CA
SKLV UKHU SE IE SI
US HR BE EE
GR ES CZ
NLPT DK FI NO
CH DE
AT
»
Figure 3 positions countries in terms of their performance on bottom-end inequality and absolute frequency of health complaints. Countries in the top- right quadrant perform better than average on both counts, while countries in the bottom-left quadrant perform worse than average on both measures. Only Turkey shows both high bottom- end inequality and highfrequency of reported health complaints (bottom-left quadrant).
Figure 3 Relative health gap and daily health complaints
Source: HBSC 2014. See page 44 – League Table 3.
Note: data for 2010 used for Israel, Turkey and the United States.
Data from the 2013/2014 wave of the Health Behaviour in School-aged Children (HBSC) study are reported in League Table 3.
This table ranks countries on the basis of bottom- end inequality in self-reported health symptoms. Students aged 11, 13 and 15 were asked how often in the previous six months they had experienced the following psychosomatic symptoms: headache; stomach ache; backache; feeling low; irritability or bad temper; feeling nervous; difficulties in getting to sleep; and feeling dizzy. The response options were
“about every day”, “more than once a week”, “about every week”, “about every month”, “rarely or never”. These responses are summed to produce a composite scale that captures the frequency of self- reported health complaints. It ranges from 0 to 32, where 0 corresponds to frequent occurrence of all eight symptoms and 32 refers to no health complaints at all.
Using this scale, for each country the relative health gap is computed by comparing a child with relatively
frequent health complaints (represented by the mean of values below the median) to the frequency of complaints recorded by the ‘average’ child (represented by the median itself), with the gap measured as the difference between the two calculated as a share of the median. This indicator shows how far children at the bottom are allowed to fall behind the ‘average’ child in each country. For example, in Austria the health score for children at the bottom of the distribution is 23.6 per cent lower than that of the child at the middle. The relative health gap is supplemented by the proportion of children in each country who report one or more health complaints every day – an indication of absolute severity in health symptoms. The HBSC survey includes a wide range of health- related indicators. In Section 5 we not only explore self-reported health symptoms data in more detail, but also examine data on key health behaviours, such as diet and exercise.
S E C T I O N 2 L E A G U E T A B L E S
Rank Country Relative life
satisfaction gap Life satisfaction at 4 or lower out of 10
1 Netherlands 24.03 4.4
2 Australia 24.34 4.5
3 Denmark 25.12 5.7
4 Greece 25.72 4.5
5 Romania 26.06 4.8
6 Latvia 26.09 6.4
7 Switzerland 26.32 5.4
8 Norway 26.35 4.5
9 Austria 26.90 5.2
10 Estonia 26.95 5.3
11 Finland 27.01 5.7
12 Slovenia 27.21 5.6
13 Ireland 27.38 6.9
14 Malta 27.61 5.7
15 Hungary 27.86 6.3
16 Bulgaria 27.90 5.0
17 Sweden 27.98 8.2
18 Portugal 28.03 6.0
19 Iceland 28.38 6.7
20 United Kingdom 28.42 7.4
21 United States 28.67 7.3
22 Italy 28.80 8.0
23 Croatia 29.13 5.0
24 Spain 29.23 5.6
25 Canada 29.37 8.6
26 Slovakia 29.41 7.0
27 Lithuania 29.44 5.4
28 France 29.56 8.5
29 Germany 29.58 8.4
30 Belgium 29.96 9.6
31 Israel 30.01 7.7
32 Luxembourg 30.04 8.2
33 Poland 31.11 10.0
34 Czech Republic 31.50 8.6
35 Turkey 35.95 15.3
League Table 4 ranks countries on the size of the relative life
satisfaction gap for children. This measure indicates how far those with the lowest levels of life satisfaction fall behind their peers. League Table 4 also displays the proportion of children with very low overall levels of life satisfaction in each country – i.e. those reporting 4 or less on a scale from 0 to 10. More detail about these measures is provided in the box ‘Interpreting the data: League Table 4 – Life satisfaction’. Key findings:
»
The ‘average’ child reports life satisfaction of 8 out of 10 in almost all countries, but children at the lower end of the life satisfaction distribution fall far behind their peers – typically between 2.5 and 3 points out of 10 lower than the median.»
Children at the bottom fall furthest behind in Turkey, where the relative life satisfaction gap is 36 per cent. Gaps in excess of 30 per cent are also found in Poland and the Czech Republic.»
The smallest relative life satisfaction gap (24 per cent) is found in the Netherlands, while Australia and Denmark also have comparatively low relative gaps of around 25 per cent. In other words, in Denmark the mean life satisfaction score of children in the bottom half of the distribution is 75 per cent of the score of a child at the median.»
There are important cross-national differences in the proportion of children who rate their lifesatisfaction at the very low level of 4 out of 10 or below. The size of this group ranges from 4.4 per cent in the Netherlands to 15.3 per cent in Turkey.
See data sources and notes on page 44.
League Table 4 Inequality in life satisfaction
S E C T I O N 2 L E A G U E T A B L E S
Interpreting the data: League Table 4 – Life satisfaction
Life satisfaction at 4 or less out of 10
Relative life satisfaction gap
Higher life satisfaction gap Lower life satisfaction gap
Higher life satisfactionLower life satisfaction
TR
PL CZ
BE LU
IL FR
DE CA
IT
SK IS
SE US UK LT ES
HR
HU PTMT BG SI
FI IE
EE AT
LV CH NO
RO DK GR AU NL
»
Figure 4 places countries in one of four quadrants where, as before, those in the top-right quadrant perform better than average both in bottom-end inequality and in the proportion of children reporting very low life satisfaction. For life satisfaction, the relationship between the two is quite strong, as most countries are either in the top-right or the bottom-left quadrants. Countries with lower bottom-end inequality also tend to have a lower share of children who rate their life satisfaction at 4 out of 10 or below, and vice versa – a larger proportion of those in countries with higher bottom-endinequality assign life satisfaction a low score.
Data from the 2013/2014 [see page 44] wave of the Health Behaviour in School-aged Children (HBSC) study are reported in League Table 4.
The life satisfaction scores are based on children’s own ratings of their life satisfaction on a scale of 0 (“the worst possible life for you”) to 10 (“the best possible life for you”).
For each country, the relative life satisfaction gap is the difference between mean life satisfaction of a child with relatively low life satisfaction (represented by the mean of values below the median) and the life satisfaction of the ‘average’ child (represented by the median itself), with the gap measured as the
Figure 4 Relative life satisfaction gap and low life satisfaction
Source: HBSC 2014. See page 44 – League Table 4.
Note: data for 2010 used for Israel, Turkey and the United States.
difference between the two calculated as a share of the median. This indicates how far those with relatively low levels of life satisfaction have fallen behind their peers.
For example, in the Netherlands the life satisfaction score for children at the bottom is 24 per cent lower than that for children in the middle.
League Table 4 also reports the proportion of children in each country rating their life satisfaction at 4 out of 10 or below. This allows us to assess the prevalence of very low levels of life satisfaction in each country.
S E C T I O N 2 L E A G U E T A B L E S
Rank Country Income Education Health Life satisfaction Missing indicators
1 Denmark 4 8 5 3 0
2= Finland 3 16 6 11 0
2= Norway 1 23 4 8 0
2= Switzerland 6 20 3 7 0
5 Austria 11 21 1 9 0
6 Netherlands 8 30 8 1 0
7 Ireland 10 9 20 13 0
8 Estonia 28 3 13 10 0
9 Slovenia 19 11 16 12 0
10 Latvia 32 4 17 6 0
11 Czech Republic 5 13 9 34 0
12 Croatia 26 5 12 23 0
13 Australia 14 24 27 2 0
14= Germany 12 28 2 29 0
14= Greece 38 18 11 4 0
14= Hungary 21 17 18 15 0
14= United Kingdom 7 25 19 20 0
18 United States 30 10 14 21 0
19 Portugal 33 19 7 18 0
20 Iceland 2 26 31 19 0
21 Romania 41 2 32 5 0
22 Spain 36 12 10 24 0
23 Sweden 16 29 22 17 0
24 Malta 20 30 14 1
25 Lithuania 27 7 25 27 0
26 Canada 24 14 24 25 0
27 Poland 23 6 33 33 0
28 France 13 35 23 28 0
29= Belgium 22 36 15 30 0
29= Luxembourg 9 33 29 32 0
31 Slovakia 25 34 21 26 0
32 Italy 35 22 28 22 0
33 Bulgaria 40 32 26 16 0
34 Turkey 29 34 35 1
35 Israel 37 37 35 31 0
- Republic of Korea 15 15 2
- Chile 31 1 2
- New Zealand 17 31 2
- Japan 34 27 2
- Cyprus 18 3
- Mexico 39 3
n.a top third middle third bottom third two or more indicators missing See data sources and notes on page 44.
League Table 5 Average rank across all dimensions of inequality
S E C T I O N 2 L E A G U E T A B L E S
League Table 5 summarizes each country’s overall record for bottom- end inequality in child well-being. It displays each country’s rank in the income, education, health and life satisfaction league tables, and provides an overall rank based on that country’s average position across each of the four previous league tables.
Countries lacking indicators for two or more domains of child well-being are excluded from the overall ranking, but are displayed at the end of the league table for reference. Key findings:
»
Denmark is at the top of the overall league table. It has comparatively low bottom-end inequality in each of the four domains of child well-being. Indeed it is the only country to rank in the top third in all four league tables. Denmark’s lowest ranking is eighth in education.»
Finland, Norway and Switzerland share second place in the overall league table. They rank in the top third in each domain, except education.»
Israel and Turkey rank lowest in the overall league table. Theyhave comparatively high bottom- end inequality in each of the four domains of child well-being for which they have valid data.
»
Some of the richest countries in the world are placed in the bottom third of the overall league table, including three of the Group of Seven countries: Canada (26th), France (28th) and Italy (32nd). The country in the European Union with the highest income per person, Luxembourg, ranks 29th.»
Report Card 9 examined bottom- end inequality before theeconomic crisis. A comparison of the overall league tables in the two Report Cards suggests that France, Iceland and Sweden have seen their comparative positions decline in recent years: France, previously towards the middle of the overall table, now ranks in the bottom third; while Iceland and Sweden, previously towards the top of the overall league table, now sit marginally above the bottom third. However, a direct comparison between the two Report Cards cannot be made as somewhat different measures are used.
S E C T I O N 2 L E A G U E T A B L E S
INCOME
SECTION 3
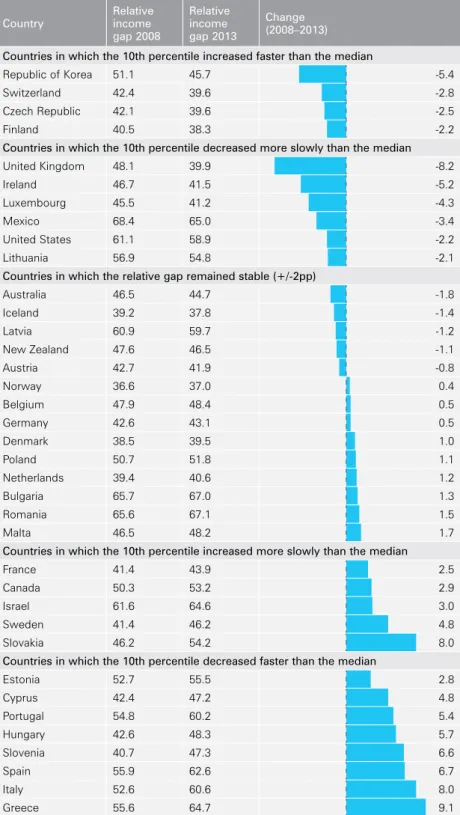
Income gaps have widened in the majority of rich countries How has income inequality evolved over the past few years? Different pathways can explain changes in the relative income gap over time. For example, if incomes at the bottom of the distribution grow faster than in the middle, the result is a doubly positive scenario of overall improvements coupled with declines in bottom-end inequality. Conversely, if the 10th percentile decreases faster than the median, inequality widens and the poorest children are left even further behind. Countries are placed into five groups in Figure 5 to clarify the reasons for changes in inequality between 2008 and 2013. These pathways are based on ‘real’ changes in incomes over time, i.e. adjusting for inflation, although this does not affect the relative gap itself.
Bottom-end income inequality has increased in over half of the rich countries analysed: 19 of 37 saw an increase in the relative child income gap of at least 1 percentage point between 2008 and 2013. Two-thirds of these countries saw a substantial increase in inequality, exceeding 2 percentage points.
Figure 5 shows that:
»
Of the 10 countries where the relative income gap narrowed by at least 2 percentage points between 2008 and 2013, in onlyfour – the Czech Republic, Finland, Korea and Switzerland – was that because of a ‘positive’ closing of the gap: the incomes of both the 10th percentile and the median grew, but those of the 10th percentile increased faster.
»
In the second group of countries, the relative gap shrank because the median income declined, while the 10th percentile either decreased more slowly (Ireland, Lithuania and Luxembourg), remained unchanged (the United Kingdom and the United States) or even increased (Mexico).»
In Canada, France, Israel, Slovakia and Sweden, the relative income gap increased, as the median income grew or at least remained unchanged, while the 10th percentile income improved more slowly or even decreased, thus widening the gap between the bottom and the middle.»
The largest increases in inequality – of at least 5 percentage points – occurred in four southern European countries (Greece, Italy, Portugal and Spain) and three eastern European countries (Hungary, Slovakia and Slovenia). In all these countries, except Slovakia, children’s median household incomes fell, but the 10th percentile incomedecreased even faster, leaving the poorest children increasingly lagging behind.
Social transfers matter Labour markets play a significant role in shaping the income of households with children – particularly following an economic crisis, when rates of unemployment and underemployment rise. Children living in jobless households are overrepresented in the bottom income decile in all European countries. In Bulgaria, over 75 per cent of children in the poorest decile live in a jobless household, while that is the case for over 60 per cent in Belgium, Greece, Hungary, Ireland and Slovakia. The comparison of pre- and post- transfer incomes for European countries shown in Figure 6 underlines the fact that social transfers also play a role in reducing relative income gaps among children in rich countries. Indeed, in all these countries income inequality is higher before social transfers than after, but the degree to which social transfers reduce the relative income gap varies considerably across Europe. In Ireland and the United Kingdom, social transfers nearly halve the relative income gap. Indeed, without significant social transfers, the income gaps in these two countries would be among the highest in Europe. In other countries, particularly Bulgaria, Greece, Italy and Portugal, the pre- and post-transfer income gaps are very similar. These are countries
S E C T I O N 3 I N C O M E
Country
Relative income gap 2008
Relative income gap 2013
Change (2008–2013) Countries in which the 10th percentile increased faster than the median
Republic of Korea 51.1 45.7 -5.4
Switzerland 42.4 39.6 -2.8
Czech Republic 42.1 39.6 -2.5
Finland 40.5 38.3 -2.2
Countries in which the 10th percentile decreased more slowly than the median
United Kingdom 48.1 39.9 -8.2
Ireland 46.7 41.5 -5.2
Luxembourg 45.5 41.2 -4.3
Mexico 68.4 65.0 -3.4
United States 61.1 58.9 -2.2
Lithuania 56.9 54.8 -2.1
Countries in which the relative gap remained stable (+/-2pp)
Australia 46.5 44.7 -1.8
Iceland 39.2 37.8 -1.4
Latvia 60.9 59.7 -1.2
New Zealand 47.6 46.5 -1.1
Austria 42.7 41.9 -0.8
Norway 36.6 37.0 0.4
Belgium 47.9 48.4 0.5
Germany 42.6 43.1 0.5
Denmark 38.5 39.5 1.0
Poland 50.7 51.8 1.1
Netherlands 39.4 40.6 1.2
Bulgaria 65.7 67.0 1.3
Romania 65.6 67.1 1.5
Malta 46.5 48.2 1.7
Countries in which the 10th percentile increased more slowly than the median
France 41.4 43.9 2.5
Canada 50.3 53.2 2.9
Israel 61.6 64.6 3.0
Sweden 41.4 46.2 4.8
Slovakia 46.2 54.2 8.0
Countries in which the 10th percentile decreased faster than the median
Estonia 52.7 55.5 2.8
Cyprus 42.4 47.2 4.8
Portugal 54.8 60.2 5.4
Hungary 42.6 48.3 5.7
Slovenia 40.7 47.3 6.6
Spain 55.9 62.6 6.7
Italy 52.6 60.6 8.0
Greece 55.6 64.7 9.1
Figure 5 Change in income inequality
Source: EU-SILC 2008–2013.
Notes: Canada and the United States, 2007–2013; Israel, 2007–2012; Mexico, 2008–2012. There was a break in time series in Canada, Spain and the United Kingdom.
No trend data available for Croatia, Turkey, Chile and Japan.
with some of the highest levels of bottom-end inequality in the comparison.
Higher income gaps, higher levels of poverty and deprivation
An examination of inequality in children’s income alongside monetary child poverty and material deprivation rates provides a fuller picture of changes in children’s living standards. As noted in Section 2, the relative income gap and child poverty are closely associated: countries with higher bottom-end income inequality tend to have higher child poverty (and vice versa, lower bottom-end income inequality tends to equate to lower child poverty). However, relative income statistics do not necessarily convey what it means to live on a low income in a rich country. Analysis of material deprivation can help us better understand the situation of children at the bottom end of the income distribution.
Children are considered materially deprived when their household cannot afford three or more out of nine items considered necessary for an adequate life: 1) to face unexpected expenses; 2) to afford a one-week annual holiday away from home; 3) to avoid arrears in rent, mortgage and utility bills; 4) to have a meal with meat or proteins every second day; 5) to keep the home adequately heated; 6) to have a washing machine; 7) to have a colour TV; 8) to have a telephone;
S E C T I O N 3 I N C O M E
Country
Relative income gap pre-transfers
Relative income gap post-transfers
Percentage of gap reduced by social transfers
United Kingdom 77.4 39.9 48.4
Ireland 76.3 41.5 45.6
Belgium 82.2 48.4 41.1
Iceland 63.6 37.8 40.6
Austria 68.9 41.9 39.2
Norway 60.5 37.0 38.8
Hungary 76.1 48.3 36.5
France 68.5 43.9 35.9
Denmark 61.4 39.5 35.6
Finland 58.2 38.3 34.1
Luxembourg 61.3 41.2 32.8
Sweden 67.7 46.2 31.7
Germany 62.9 43.1 31.5
Malta 68.1 48.2 29.2
Netherlands 56.3 40.6 27.8
Lithuania 75.2 54.8 27.1
Slovenia 63.0 47.3 25.0
Croatia 68.8 54.6 20.6
Switzerland 48.9 39.6 19.0
Estonia 67.9 55.5 18.2
Spain 75.2 62.6 16.7
Poland 61.7 51.8 16.2
Bulgaria 78.3 67.0 14.5
Czech Republic 46.3 39.6 14.4
Latvia 69.0 59.7 13.5
Cyprus 54.5 47.2 13.4
Slovakia 62.3 54.2 13.0
Romania 75.9 67.1 11.6
Italy 64.5 60.6 6.0
Portugal 62.5 60.2 3.6
Greece 66.3 64.7 2.4
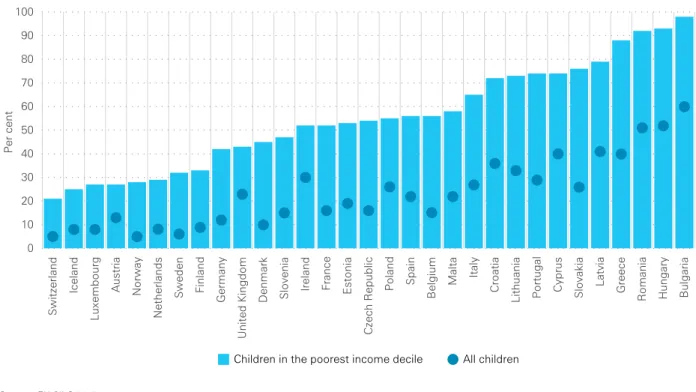
9) to have a personal car. Although national income plays a role in shaping the levels of material deprivation, across Europe there is a strong association between relative income gaps and material deprivation in households with children:
countries with higher bottom-end income inequality tend also to have higher material deprivation.5
Figure 7 shows that in all European countries children in the bottom income decile are more likely to be materially deprived than the child population as a whole. In Bulgaria, Hungary and Romania, over 90 per cent of children in the bottom income decile live in materially deprived households.
Lower income inequality, higher child well-being How is bottom-end income inequality related to overall child well-being? Figure 8 plots a revised version of the multi-dimensional child well-being index presented in Report Card 11 (2013) against relative income gaps.6 Countries with higher income gaps tend to have lower levels of overall child well-being.
The evidence presented here shows that large relative income gaps are not inevitable, that policy makers have tools at their disposal that are effective in reducing income inequality, and that smaller income gaps are better for all children, insofar as they are associated with higher levels of overall child well-being. While policy makers face undoubted challenges in balancing budgets in the aftermath of the economic crisis, the arguments in favour of prioritizing policies that prevent the incomes of the poorest households with children from falling behind are compelling.
Figure 6 Income inequality and social transfers
Source: EU-SILC 2013. S E C T I O N 3 I N C O M E
All children Children in the poorest income decile
Hungary Bulgaria
Romania
Greece
Latvia
Slovakia
Cyprus
Portugal
Lithuania
Croatia
Italy
Malta
Belgium
Spain
Poland
Czech Republic
Estonia
France
Ireland
Slovenia
Denmark
United Kingdom
Germany
Finland
Sweden
Netherlands
Norway
Austria
Luxembourg
Iceland
Switzerland
Per cent
0 10 20 30 40 50 60 70 80 90 100
Child well-being
Relative income gap R-squared=0.60
30 40 50 60 70
-3 -2 -1 0 1 2
GR PT
LT ES
BG RO LV JP
CZ HU MT
NZ IEFR CY CH DK SI
NO FI SE
DE IS
NL
AT UK
SK LU
AU BE
CA EE PL TT
US
Figure 8 Relative child income gap and overall child well-being (2009) Figure 7 Percentage of children living in deprived households
Source: Bradshaw, J. (2015). ‘Child poverty and child well-being in international perspective’, in E. Fernandez, A. Zeira, T. Vecchiato and C. Canali (eds), Theoretical and Empirical Insights into Child and Family Poverty, Springer International, Cham, Switzerland, pp.59–70; EU-SILC 2009. Source: EU-SILC 2013.
S E C T I O N 3 I N C O M E
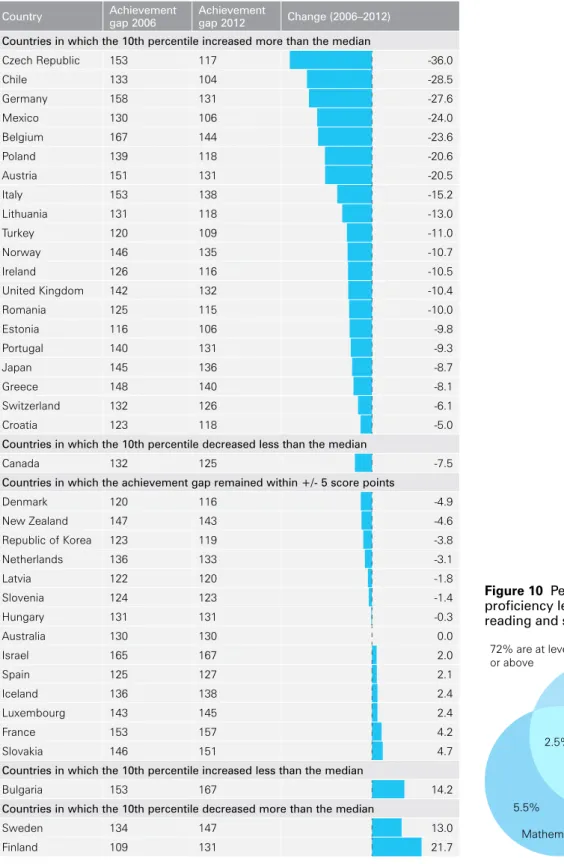
Inequality in educational achievement narrowed in the majority of the countries Whether or not inequality has declined in recent years is an important question. But understanding how the achievement gaps have altered indicates how far educational disadvantage and low achievement have been addressed. For example, a closing of the achievement gap can result from children at the lower end being ‘lifted up’, so that their achievement level is closer to the average standard. However, it may also be the result of falling average achievement, alongside constant (or even declining) achievement among the children at the bottom end of the distribution. Figure 9 details changes in inequality in PISA test scores for reading between 2006 and 2012.7 It shows that the majority of countries display a positive trend in terms of reducing the achievement gap in reading. Countries are placed into five groups, depending on how their inequality has changed. We are particularly interested in cases where both the median improved and the
achievement gap narrowed, as this is a ‘win-win’ scenario of overall improvement coupled with a decline in inequality at the lower end.
The main pathways distinguished in Figure 9 are:
»
Countries that narrowed inequality while improving median test scores. The positive news is that 20 out of the 38 countries fell into this category, with the largest improvements in Chile, the Czech Republic, Germany and Mexico, although the median test scores in the Czech Republic and Mexico remain low compared with other countries. Belgium and Germany show large improvements, but with higher median test scores.»
Countries that saw a decrease in inequality but with a fall in median test scores. This type of trajectory is only seen in Canada, where a notable decline in lower-end inequality occurs in part because of a decline in overall achievement.»
Countries that saw an increase in inequality alongside increased median test scores. Only Bulgaria displays this trend; low achievers have been allowed to fall even further behind.»
Countries where bottom-end inequality increased alongside a fall in median test scores. This type of downward trajectory is the most worrying – and not very common in reading. Two high- income countries fall into this group: Finland and Sweden.Many countries reduced absolute educational disadvantage
In League Table 2, measures of the relative achievement gap were supplemented by an indicator of absolute educational disadvantage, measured as all children who fall under the PISA threshold of proficiency level 2 in all three subjects. Across the OECD countries in 2012, 28 per cent of 15-year-olds fell below proficiency level 2 in at least one of the three subjects, and 11.6 per cent scored below level 2 in all three subjects (Figure 10). Children who
underachieve in all three subjects are likely to have been in the lowest-achieving group for some time.
EDUCATION
SECTION 4
S E C T I O N 4 E D U C A T I O N