Brain networks of affective mentalizing revealed by the tear effect
Takahashi, Haruka K.
DOCTOR OF PHILOSOPHY
Department of Physiological Sciences,
School of Life Science,
SOKENDAI (The Graduate University for Advanced Studies)
2015
Table of Contents
1. Summary ... 4
2. Introduction ... 7
3. Materials and methods ... 13
3.1. Subjects ... 13
3.2. Data acquisition ... 13
3.3. Stimuli ... 14
3.4. Task design and procedure... 17
3.5. Imaging data processing ... 19
3.6. Statistical analyses ... 20
4. Results ... 27
4.1. Behavioral results ... 27
4.2. fMRI results ... 28
5. Discussion ... 34
5.1. Behavioral performance ... 34
5.2. Tear effect in the mPFC, PCC, and TPJ ... 34
5.3. Supra-additive effect between tears and facial expressions in the mPFC and PCC ... 35
5.4. No interaction effect in the TPJ ... 41
5.5. Limitations ... 42
6. Conclusions ... 44
7. Acknowledgments ... 45
8. References ... 46
9. Tables ... 58
10. Figures ... 66
1. Summary
Social cognition includes psychological processes by which we can make
inferences about other people. Affective mentalizing is defined as the process of
inferring others’ affective state (i.e., “I understand how you feel”). Previous
neuroimaging and lesion studies have identified a distributed set of brain regions that
are involved in affective mentalizing. Especially, the medial prefrontal cortex (mPFC),
the precuneus/posterior cingulate cortex (PCC), and the temporo-parietal junction (TPJ)
are considered the core network for mentalizing. However, the relative contributions of
these nodes to affective mentalizing remain poorly understood.
One approach to clarifying the roles of these nodes is to examine which regions
are involved in integrating multiple social signals (e.g., facial expressions and bodily
gestures). The integration means a process where social signals are combined to infer
the most likely affective state. In the field of multisensory research, if signals of two
sensory modalities are integrated in a brain region, such region should not only be
activated by each sensory modality, but also show a supra-additive effect, indicated by
greater activation than the sum of the individual sensory signals. Likewise, I can expect
that, if a region is involved in integrating social signals, such region should show a
supra-additive effect of these social signals. The goal of this thesis is to investigate
which nodes of the core network of affective mentalizing are involved in the integration
of the two social signals: emotional tears and facial expressions. For this purpose, I
conducted a functional magnetic resonance imaging (fMRI) experiment wherein brain
activity of humans is non-invasively measured.
Sixty-one healthy female subjects participated in the experiment and rated the
sadness of observed others during fMRI scanning. I adopted a two-factor
within-subjects factorial design, with two levels of facial expressions (sad and neutral)
and three levels of tears (faces with tears, with circles and without tears). Thus, the
subject observed six different types of faces: those portraying sad facial expressions
with tears, with tear-like circles, and without tears; and those portraying neutral facial
expressions with tears, with tear-like circles, and without tears. After the standard
preprocessing of fMRI data, I utilized the general linear model to estimate brain activity
for each type of faces and evaluated the main effects and the interactions within each
subject. The supra-additive effect was evaluated as one of the interaction effects. These
results from the subjects were summarized to obtain population inferences.
The subjects rated sad facial expressions with tears as sadder than the other
types of faces. In the fMRI analysis, the mPFC and PCC showed greater activation
when viewing faces with tears than without tears (the main effect of tears), greater
activation when viewing sad face than neutral face (the main effect of facial
expressions) and greater activation during the observation of sad facial expressions with
tears than the sum of the effects from individual social signals (tears and sad facial
expressions) (the supra-additive effect). In contrast to the mPFC and PCC, neither the
main effect of sad facial expressions nor the supra-additive effect was found in the TPJ;
this region showed only the main effects of tears.
The behavioral results indicate that information on tears and sad facial
expressions are combined to infer others’ sadness, which is the indicator of the
integration. The results of the fMRI analysis indicate that the mPFC and PCC are
involved in integrating tears and sad facial expressions. In contrast to the mPFC and
PCC, the TPJ was only sensitive to the presence of objects on a face such as tears.
These results indicate that the TPJ is engaged in processing tears, but not in the
integration of tears and facial expressions.
In conclusion, the mPFC and PCC showed the supra-additive effect of tears
and facial expressions in an affective mentalizing task. This result indicates that these
midline structures of the cerebral cortex are critical for integrating these social signals,
highlighting different roles from the TPJ, the other core node of the mentalizing.
2. Introduction
Social cognition involves psychological processes that allow humans to interact
with other individuals in social complex environment (Adolphs, 1999; Frith, 2007).
Humans are considered the most social animals among mammals (Adolphs, 1999;
Dunbar and Schultz, 2007). Several psychiatric and neurological illnesses are
characterized by prominent impairments in social functioning (Kennedy and Adolphs,
2012). Accordingly, there has been considerable interest in the neural mechanisms
underlying psychological processes of social cognition (Dunbar and Schultz, 2007;
Stanley and Adolphs, 2013).
Among the psychological processes of social cognition, the process of inferring
others' affective state is called affective mentalizing (or cognitive empathy) (i.e., “I understand how you feel”) (Perry and Shamay-Tsoory, 2013). Previous neuroimaging studies on intact and brain-lesioned patients have shown a widely distributed set of
brain regions involved in social cognition (Brothers, 1990; Frith and Frith, 2003; Van
Overwalle, 2009; Van Overwalle and Baetens, 2009; Kennedy and Adolphs, 2012).
These regions are considered to constitute multiple networks that subserve for distinct
processes of social cognition (Van Overwalle and Baetens, 2009; Kennedy and Adolphs,
2012). Among them, the medial prefrontal cortex (mPFC), the precuneus/posterior
cingulate cortex (PCC), and the temporo-parietal junction (TPJ) are considered the core
mentalizing network, because they have often been observed during affective (Atique et
al., 2011; Corradi-Dell’Acqua et al., 2014) and non-affective (cognitive) (Goel et al.,
1995; Van Overwalle, 2009; Van Overwalle and Baetens, 2009) contexts. However, the
relative contributions of these nodes to affective mentalizing are not well understood.
One possible way to clarify the relative contributions of these nodes is to
examine the brain regions that are involved in integrating multiple social signals to infer
others’ affective state. Here, I define the integration as a process in which social signals
are combined to infer the most likely affective state. In the field of multisensory
research, if two different types of signal are integrated in a region, it is expected not
only to be activated by each separately (convergence), but also to show interaction
effects between them (Calvert et al., 2000; Raij et al., 2000; Stevenson et al., 2009).
Previous neuroimaging studies have consistently found that the mPFC contains
information about others’ emotional state, regardless of whether the social signals
involved facial, body, or vocal expressions (Peelen et al., 2010), or whether they
involved facial expressions or situational information in the absence of observable
expressions (Skerry and Saxe, 2014). These findings indicate that the mPFC plays a key
role in representing others’ affective states at the abstract level by receiving information
about distinct social signals. However, each type of social signal was presented
separately in previous studies, so it has remained unclear whether the mPFC is involved
in the integration process.
Even less is known about the role of the PCC and TPJ in the integration of
social signals. In particular, the function of the PCC in mentalizing is not well
understood; hence, little attention has been paid to its role in integrating social signals.
Furthermore, the function of the TPJ in mentalizing has been controversial (Decety and
Lamm, 2007; Mitchell, 2008; Scholz et al., 2009; Cabeza et al., 2012), and its role in the
integration of social signals has not been clarified. For instance, Peelen et al. (2010)
showed that a region adjacent to the TPJ also contains information about others’
emotional state across different types of emotional expressions (face, body, and voice).
However, a subsequent neuroimaging study by Skerry and Saxe (2014) utilizing facial
expressions and situational information (e.g., social exclusion) showed that the TPJ did
not represent others’ emotional state at an abstract level; more specifically, their work
showed that a classifier, which was trained to discriminate the valence of one social
signal within the TPJ, did not successfully classify that valence for the other social
signals. Understanding another person’s affective state based on situational information
is critically different from interpreting emotional expressions (produced by the face,
body, and voice), in that situational information can be interpreted in multiple ways and
presents an ill-posed inverse problem (e.g., a person might feel happy or sad when he or
she is separated from others). Thus, understanding situational information in a
socially-appropriate manner requires knowledge of the social event (e.g., that separation
from others should be considered a sad event; Barbey et al., 2009; Krueger et al., 2009).
Thus, I anticipate that the TPJ plays a minor role in the integration of social signals that
involve social event knowledge.
Given this background, I focused my investigation on the integration of two
social signals from facial stimuli: tears and facial expressions. To the best of my
knowledge, neither the neural mechanisms underlying the processing of tears as social
stimuli nor the neural bases of the integration of tears and facial expressions has been
identified. Emotional tears appear to be unique to humans and are of considerable
interest in the field of evolutionary psychology (e.g., Murube et al., 1999; Provine et al.,
2009; Balsters et al., 2013). Like social situations, understanding another’s affective
state from tears is an ill-posed inverse problem, because tears can be shed in response to
many different emotions (e.g., anger, happiness, and sadness; Murube et al., 1999).
Therefore, tears are similar to social situations in that they require social event
knowledge in order to achieve the most appropriate interpretation. In the absence of
contextual information, humans tend to interpret tears as a symbol of sadness (i.e., the
tear effect; Provine et al., 2009), possibly because such an interpretation is the most
socially appropriate. As the mPFC can represent others’ emotions at an abstract level
across different social signals (Peelen et al., 2010; Skerry and Saxe, 2014), I predicted
that it would be involved in integrating tears and facial expressions.
The present study used functional magnetic resonance imaging (fMRI) the
hypothesis that the mPFC, but not the TPJ, integrates tears and facial expressions during
the evaluation of others’ sadness. I also explored the role of the PCC in this integration
process without a specific hypothesis. I manipulated two factors: tears (tears, tear-like
control objects, and no object) and facial expressions (sad and neutral). I initially tested
my assumption that the core mentalizing network is activated by the presence of tears,
and then examined whether this network shows interaction effects between tears and
facial expressions. I predicted that the mPFC would show a supra-additive effect,
providing evidence of the integration of information on tears and facial expressions
(Meredith and Stein, 1983; Calvert et al., 2000; Raij et al., 2000; Stevenson et al., 2009).
In other words, these regions should show stronger activation in response to a sad facial
expression with tears than the sum of the activity in response to individual presentations
of a sad facial expression without tears and a neutral facial expression with tears. By
contrast, I predicted that the TPJ would not show the same effect.
3. Materials and methods
3.1. Subjects
Sixty-one healthy subjects aged 18–44 years (mean age = 22.1 years; standard
deviation [SD] = 4.7 years) participated in the study. I recruited only female participants
because they tend to react to crying people with more sympathy and support than males
(Cretser et al., 1982). All subjects were right-handed according to the Edinburgh
Handedness Inventory (Oldfield, 1971). None of the volunteers had a history of
symptoms requiring neurological, psychological, or other medical care. All subjects
gave written informed consent. The study was approved by the ethical committee of the
National Institute for Physiological Sciences of Japan. Thirty-eight subjects participated
in the main fMRI experiment. The rest of the subjects (n = 23) participated in a separate
experiment to define the regions of interest (ROIs). None of the subjects participated in
both experiments.
3.2. Data acquisition
fMR images were acquired using a 3T scanner (Verio; Siemens Erlangen,
Germany) with a 32-element phased-array head coil. Tight but comfortable foam padding was placed around each subject’s head to minimize movement. T2*-weighted
gradient-echo echo-planar imaging (EPI) was used to obtain the functional images. The
sequence parameters were as follows: repetition time (TR), 3,000 ms; echo time (TE),
30 ms; flip angle, 83°; 39 slices of 3.0 mm thickness with a 17% slice gap, which
covered the entire cerebral and cerebellar cortices; field of view, 192 mm; and in-plane
resolution, 3.0 × 3.0 mm. Oblique scanning was used to exclude the eyeballs from the
images. For anatomical imaging, a T1-weighted three-dimensional (3D)
magnetization-prepared rapid-acquisition gradient echo (MP-RAGE) sequence was
obtained (TR = 1,800 ms; TE = 2.97 ms; flip angle = 9°; field of view = 250 mm; and
voxel dimensions = 0.9 × 0.9 × 1.0 mm).
3.3. Stimuli
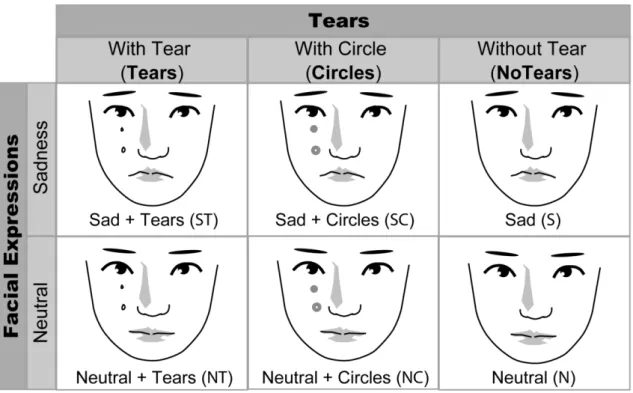
I used six types of faces: those portraying sad facial expressions with tears,
with tear-like circles, and without tears; and those portraying neutral facial expressions
with tears, with tear-like circles, and without tears (Figure 1A). Stimuli were produced
as described below.
3.3.1. Stimuli production
I followed the same procedure as Provine et al. (2009) to produce the stimuli. I
initially obtained 90 images of faces with tears (Tears images) from the online image
archives Flickr (www.flickr.com) and Google (www.google.co.jp). I limited my search
to images of female adults in order to eliminate gender differences between the subjects
and stimuli. In addition to facial images, I also collected 45 landscape images from
Flickr to use as controls.
I removed the tears from the 90 face images using photo-editing software
(Adobe Photoshop, Adobe Systems Inc., San Jose, CA) and defined them as NoTears
images. I then produced new images by adding gray circles to the NoTears images,
resulting in the Circles images. The location and the number of gray circles in the
Circles images were matched with the location and number of tears in the original
(Tears) images. I did not include natural objects on stimuli (e.g., scars or saliva) in order
to match the locations of stimuli and to avoid any possible interpretation of affective
states (e.g., the observed person is hungry because of saliva on the face). Collectively, I
created three sets of facial images (comprising 270 images in total): 90 Tears images, 90
NoTears images, and 90 Circles images. The mean differences in size and perceived
brightness of the images for each condition were minimized using photo-editing
software (Adobe Photoshop, Adobe Systems Inc., San Jose, CA).
I further categorized each set of images into two subsets (sad and neutral)
based on their facial expressions. Eight females, who did not participate in the fMRI
experiment, rated the intensity of sadness in the images on a visual analogue scale
(VAS) ranging from 0 (“not sad at all”) to 100 (“extremely sad”). Initially, I used the
VAS scores from the same eight subjects to classify the 90 NoTears images into 45
images of “sad” expressions and 45 images of “neutral” expressions. Then, the Tears
and Circles images were categorized into “sad” and “neutral” images; the images for
each facial expression were identical except for the presence of tears or circles. In total,
I produced seven types of image: sad facial expressions with tears (Sad Expression +
Tears [ST] images), sad facial expressions without tears (Sad Expression [S] images),
sad facial expressions with circles (Sad Expression + Circles [SC] images), neutral
facial expressions with tears (Neutral + Tears [NT] images), neutral faces without tears
(Neutral [N] images), neutral faces with circles (Neutral + Circles [NC] images), and
landscape images (Baseline [B] images) (Figure 1A). Figure 1 shows schematic
drawings of representative stimuli due to copyright issues. Each image was used only
once in each experiment.
3.3.2. Stimulus presentation
Stimuli were back-projected via a liquid crystal display (LCD) projector
(CP-SX12000; Hitachi, Ltd., Tokyo) onto a translucent screen located at the rear of the
scanner. The horizontal and vertical viewing angles of stimuli were 5.3 and 7.4°,
respectively. The subjects viewed stimuli via a mirror placed above the head coil. I used
Presentation software to display visual stimuli and record the subject’s response
(Neurobehavioral Systems, Inc., San Francisco, CA).
3.4. Task design and procedure
A two-factor within-subjects factorial design was used, with two levels of
Facial Expressions (Sad and Neutral) and three levels of Tears (Tears, NoTears and
Circles) (Figure 1A). In addition to these six conditions, I included a baseline (B)
condition, during which subjects observed landscape images.
I employed a conventional block design (Figure 1B) with five runs. Each run
consisted of the first 12 scan volumes, followed by 23 blocks that lasted for 18 s (6
volumes per block), and the final 6 volumes (12 volumes + [23 blocks × 6 volumes] + 6
volumes = 156 volumes per run). Each block included one of the seven task conditions,
and each condition was repeated three times (21 blocks). Each block included three
trials of the same condition, and each trial lasted 6 s (3 blocks × 3 trials per block × 5
runs = 45 trials for each condition in total). The order of the conditions was
pseudo-randomized in each repetition. In addition, I included two blocks of the rest
condition: one between the last block of the first repetition of a condition and the first
block of the second repetition; and the other between the last block of the second
repetition and the first block of the third repetition (2 rest blocks + 21 task blocks = 23
blocks in total).
In each trial, an image was presented for 3.5 s, followed by the presentation of
a visual analog scale (VAS) for 2.5 s. The subjects used the VAS to evaluate the extent
of sadness of the presented facial stimuli. The subjects manipulated a two-button
response box (HHSC-2x2, Current Designs, Inc., Philadelphia, PA) with their right
hand to specify the location of the vertical line on a VAS (the index finger moved the
line to the left, and the middle finger moved the line to the right). The VAS scale
consisted of a white-colored horizontal bar with each end indicating the minimum (i.e.,
not sad at all) and the maximum (i.e., extremely sad) of the intensity of sadness
expressed by the image. The vertical line on the VAS was always located at the center
of the horizontal bar at the onset of rating phase (i.e., 3.5 s after the onset of the trial).
The end of the minimum and maximum was counterbalanced across the subjects. In the
baseline (B) condition, the subject was asked to move the VAS to any position they
wished. All of the subjects performed several practice trials in order to familiarize them
with the task and to ensure they were able to utilize the VAS easily.
3.5. Imaging data processing
The first six volumes of each fMRI run were discarded for stabilization of the
magnetization, and the remaining 150 volumes per run (a total of 750 volumes per
participant) were used for analysis. Image processing and statistical analyses were
performed using the Statistical Parametric Mapping (SPM8) package (Friston et al.,
2007). The images were realigned to correct for head motion, then corrected for
differences in slice timing within each volume. After the T1-weighted anatomical images were segmented into different tissue classes, each subject’s T1-weighted anatomical image was co-registered with the mean image of all of the EPI images for
each subject. Each co-registered T1-weighted anatomical image was normalized to the
Montreal Neurological Institute T1 image template (ICBM 152) (Evans et al., 1994;
Friston et al., 1995). The parameters from this normalization process were then applied
to each functional image. The spatially normalized EPI images were filtered using a
Gaussian kernel of 8 mm full width at half maximum (FWHM) in the x, y, and z axes
(final smoothness: x = 11.8, y = 11.9, and z = 11.8 mm). The parameters from this
normalization process were then applied to the functional images, which were
resampled to a final resolution of 2 × 2 × 2 mm3.
3.6. Statistical analyses
3.6.1. Individual analyses
A design matrix comprising the five runs was prepared for each subject. I fitted
a general linear model (GLM) to the fMRI data for each subject (Friston et al., 1994a;
Worsley and Friston, 1995). Neural activity during each condition was modeled with
box-car functions convolved with the canonical hemodynamic-response function. Each
run included seven task-related regressors, one for each condition. The time series for
each voxel was high-pass filtered at 1/128 Hz. Assuming a first-order autoregressive
model, the serial autocorrelation was estimated from the pooled active voxels with the
restricted maximum likelihood (ReML) procedure, and was used to whiten the data
(Friston et al., 2002). Motion-related artifacts were minimized by incorporating six
parameters (three displacements and three rotations) from the rigid-body realignment
stage into each model. The parameter estimates for each condition in each individual
were compared using linear contrasts. After confirming face-related activation (e.g.,
activation in the fusiform gyrus) by comparing face conditions with baseline (B), I
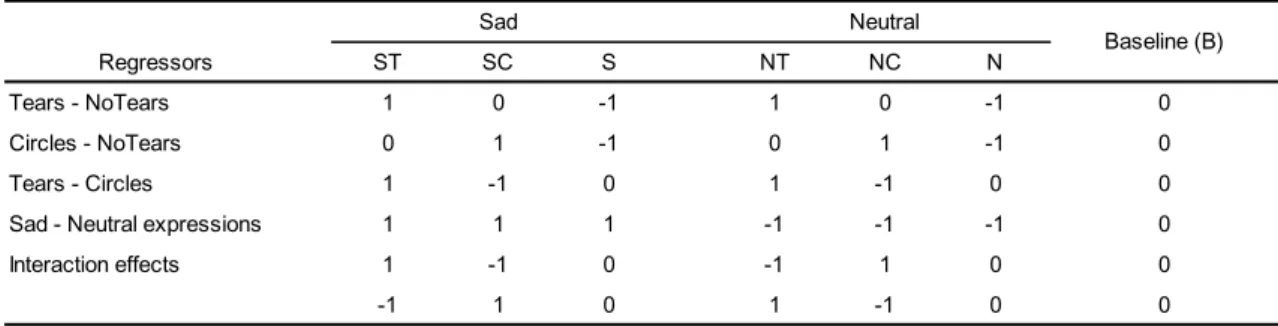
evaluated the following contrasts (Table 1): first, Tears minus NoTears, [(ST + NT) –
(S + N)]; second, Circles minus NoTears, [(SC + NC) – (S + N)]; third, Tears minus
Circles, [(ST + NT) – (SC + NC)]; fourth, Sad minus Neutral expressions, [(ST + S +
SC) – (NT + N + NC)]; and fifth, interaction effects, [(ST – SC) – (NT – NC)] and [(NT – NC) – (ST – SC)]. The supra-additive effect was tested by the contrast of [(ST – SC) – (NT – NC)] (i.e., (ST – NC) > (SC – NC) + (NT – NC)).
3.6.2. Random-effects group analysis
In the individual analysis, I obtained images that represent the normalized
task-related increment of the MR signal of each subject for each predefined contrast (i.e.,
contrast images). These contrast images were used for the group analysis. For each
predefined contrast (Table 1), a one-sample t-test was performed for every voxel in the
brain to obtain population inferences (Holmes and Friston, 1998). The resulting set of
voxel values for each comparison constituted an SPM of the t statistic SPM {t}. The
height threshold for the SPM {t} was set at t (37) > 2.72, equivalent to p < 0.005
uncorrected. The statistical threshold for the spatial extent test on the clusters was set at
p < 0.05 and corrected for multiple comparisons (family-wise error [FWE]) over the
whole brain (Friston et al., 1994b; 1996).
Brain regions were anatomically defined and labeled according to probabilistic
atlases (Amunts et al., 2005; Eickhoff et al., 2005; Shattuck et al., 2008) and a previous
meta-analysis study (Van Overwalle, 2009). In order to avoid the ambiguity of the
anatomical location of the TPJ, I defined it as the angular gyrus (Saxe and Powell, 2006;
Scholz et al., 2009; Cabeza et al., 2012). Consistent with a meta-analysis (Van
Overwalle, 2009), I defined the mPFC as the medial wall of the prefrontal cortex: that is,
regions in which the x coordinates ranged from –20 to 20 and the y coordinates were
above y > 20 in MNI space (Van Overwalle, 2009). I further subdivided the mPFC into
three regions (Van Overwalle, 2009): the dorsomedial prefrontal cortex (dmPFC),
which lies above the z coordinate of 20 mm; the ventromedial prefrontal cortex
(vmPFC), which lies between z = –15 and z = 20 mm; and the medial orbitofrontal
cortex (mOFC), which lies below z = –15 mm.
3.6.3. ROI analysis
After the whole-brain analysis was completed, ROI analysis was conducted in
order to further examine activation patterns in mPFC, PCC and TPJ. The supra-additive
effect of the two distinct signals would be observed in brain regions which are activated
by each signal. Accordingly, I assumed that the supra-additive effect should be observed
within the regions that were more active during the Tears condition than the NoTears
condition, which is a more liberal control than the Circles conditions (SC and NC). I
defined ROIs based on the brain regions that were activated by the Tears condition
relative to the NoTears condition.
The use of the same dataset for the definition of ROI and analysis of response
patterns in the ROI can lead to invalid statistical inferences (i.e., the double-dipping
problem; Kriegeskorte et al., 2009). To avoid this, I conducted a separate experiment to
compare the Tears condition with the NoTears condition, as described below.
3.6.3.1. Task design and analyses for a separate experiment. The design and analyses
of this experiment were identical to the main experiment except that the Circles
conditions (SC and NC) were removed (3 blocks for each condition × 5 conditions + 2
rest blocks = 17 blocks). I collected 9 volumes before the first block and 7 volumes after
the last block (9 + [17 blocks × 6] + 7 = 118 volumes per run). The threshold for the
SPM {t} was set at t (22) > 2.82 (equivalent to p < 0.005 uncorrected, which was the
same height threshold as that in the main experiment). The statistical threshold for the
spatial extent test on the clusters was set at p < 0.05 and corrected for multiple
comparisons (FWE) over the whole brain (Friston et al., 1994b; 1996).
I evaluated only the Tears vs. NoTears contrast [(ST + NT) – (S + N)]. I chose
the peak coordinates in each cluster in the mPFC, PCC, and TPJ. A cluster of activation
could include anatomical regions beyond my hypothesis (e.g., the fusiform gyrus in the
TPJ ROI). In order to limit the ROIs to each hypothesized region, I calculated the
overlap between the cluster activated by the tear effect and a 12-mm-radius sphere with
the peak coordinates of the same cluster. This radius was identical to the effective
resolution (final smoothness) of the statistical parametric maps. This overlapping region
in each cluster was used as the ROI.
Using these ROIs, I conducted two different types of analysis on the data from
the main experiment: univariate and multi-voxel pattern analyses (MVPA). For both, I
used unsmoothed data in order to maximize sensitivity, and to allow for the extraction
of the full information present in the spatial patterns of the fMRI data, which could have
been reduced by the smoothing (Haynes et al., 2007).
3.6.3.2. Univariate analyses. I averaged the contrast estimates in all voxels within each
ROI. I conducted the analyses on the contrast estimates of the four conditions of interest
(ST, SC, NT, and NC).
3.6.3.3. Multi-voxel pattern analyses (MVPA). The role of the TPJ in mentalizing has
been controversial (Decety and Lamm, 2007; Mitchell, 2008; Scholz et al., 2009;
Cabeza et al., 2012). More specifically, while the TPJ is activated by both mentalizing
and attention reorienting (Mitchell, 2008), the detailed spatial patterns between these
conditions can differ (Scholz et al., 2009). In order to clarify the function of the TPJ, I
conducted the MVPA (Haxby et al., 2001; Peelen et al., 2006). The MVPA was
complementary to the univariate analysis in that it was sensitive to differences in spatial
patterns of activation between the conditions, even though they showed a similar height
of activation in the univariate group analysis.
I calculated voxel-wise within-factor correlations (i.e., between independent
runs of the Tears conditions and between independent runs of the Circles conditions)
and between-factor correlations (i.e., between the Tears and Circles conditions) in each
ROI for each subject. Within-factor runs indicate the consistency of activation patterns
across runs, whereas between-factor runs indicate the spatial relationship between the
Tears and Circles conditions. Therefore, greater correlation coefficients in the
within-factor of Tears relative to the between-factor correlations indicate that Tears and
Circles show different patterns of activation. I detail these analyses below.
I initially prepared two design matrices for each subject, one including the first
and third (odd-numbered) runs and the other including the second and fourth
(even-numbered) runs. I excluded the fifth run from the analysis in order to equate the
number of runs between the two design matrices. In each design matrix, I evaluated the
contrasts of [(ST + NT) – (S + N)] (the Tears contrast) and [(SC + NC) – (S + N)] (the
Circles contrast). The t values of each voxel in the ROIs were extracted from each SPM
{t} image for all subjects. Then, in order to calculate the within-factor correlations, I
computed the correlation coefficients of the SPM {t} between the even runs and the odd
runs for the Tears contrast, and between the even runs and odd runs for the Circles
contrast. Likewise, I calculated the between-factor correlation coefficients between the
even runs of the Tears contrast and the odd runs of the Circles contrast, and between the
odd runs of the Tears contrast and the even runs of the Circles contrast. These
coefficients were transformed into Z values, which conform to a normal distribution.
4. Results
4.1. Behavioral results
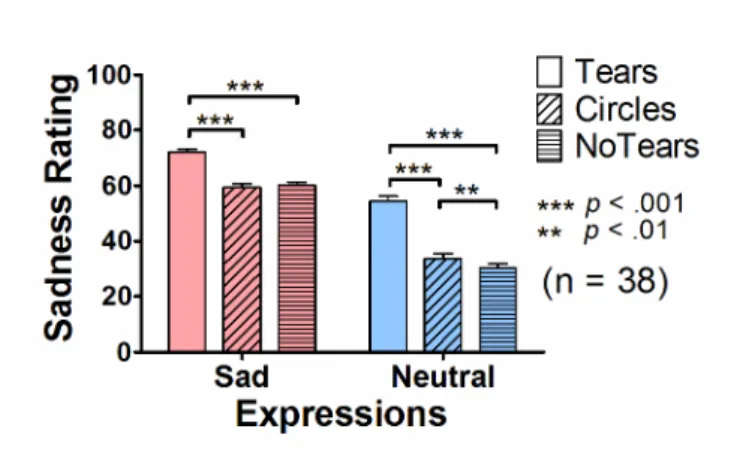
The presence of tears on the face images increased the VAS ratings of sadness
(Figure 2). A two-way repeated-measures analysis of variance (ANOVA) (2 levels of
Facial Expressions × 3 levels of Tears) on the rating scores revealed significant main
effects of Facial Expressions [F(1, 37) = 635.8, p < 0.001] and of Tears [F(2, 74) =
142.5, p < 0.001], and a significant interaction [F(2, 74) = 94.2, p < 0.001]. Post-hoc
pair-wise comparisons (with a Bonferroni correction) showed that there were greater
VAS ratings in the Tears condition compared with the NoTears and Circles conditions
for each facial expression (p values < 0.001). The effect of tears on the VAS ratings was
greater for the neutral expressions than for the sad expressions, regardless of whether
the Tears condition was compared to the NoTears or Circles conditions (p values <
0.001). Finally, I found that the Circles condition showed greater VAS rating scores
than the NoTears condition for neutral expressions (p < 0.01), but not for sad facial
expressions (p > 0.9).
Taken together, these findings confirm that the presence of tears increased the
sadness ratings (Provine et al., 2009).
4.2. fMRI results
4.2.1. Whole-brain analysis
4.2.1.1. The main effect of tears. I conducted the three contrasts to evaluate activity of
the brain regions by the presence of tears and circles: that is, the contrast of Tears with
NoTears, the contrast of Circles with NoTears and the contrast of Tears with Circles.
NoTears and Circles were considered liberal and stringent controls, respectively. The
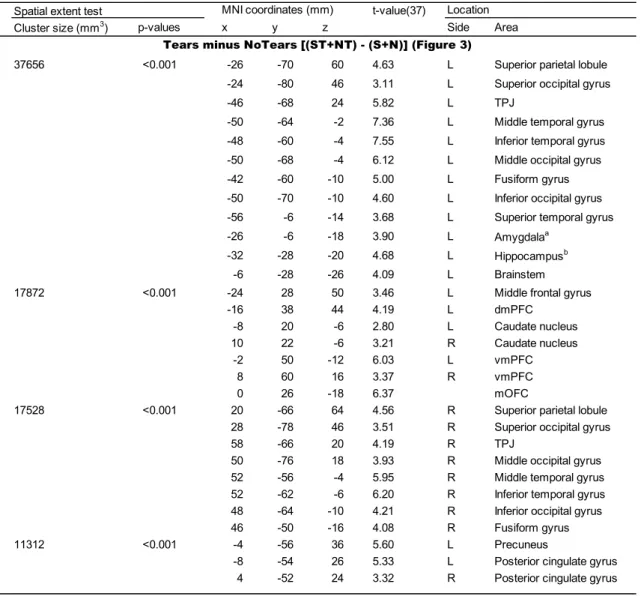
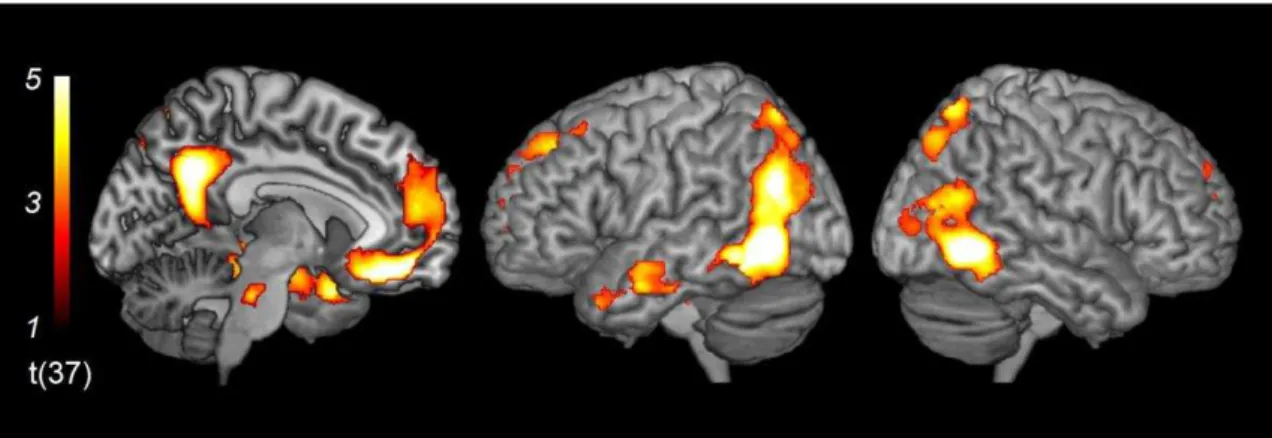
contrast of Tears minus NoTears [(ST + NT) – (S + N)] revealed regions of significant
activation bilaterally in the vmPFC, mOFC, posterior cingulate gyrus, TPJ, superior
parietal lobule, superior, middle and inferior occipital gyri, middle and inferior temporal
gyri, fusiform gyrus, and caudate nucleus (Figure 3 and Table 2). In addition, the same
contrast revealed significant activation in the left hemisphere: specifically, in the
dmPFC, precuneus, middle frontal gyrus, superior temporal gyrus, amygdala,
hippocampus and brainstem.
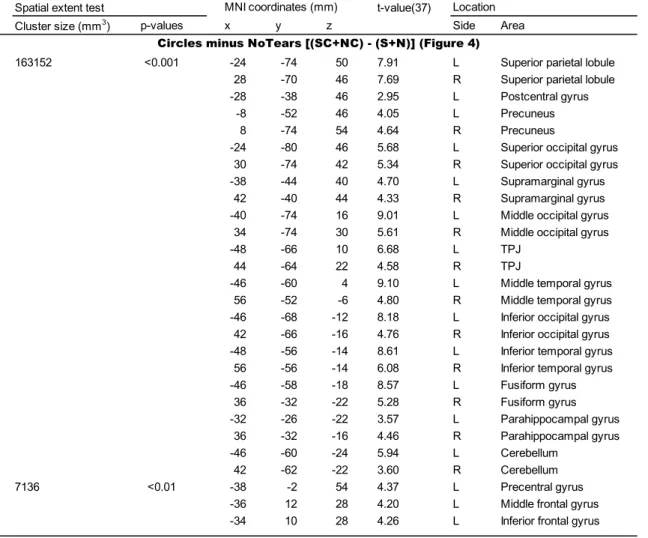
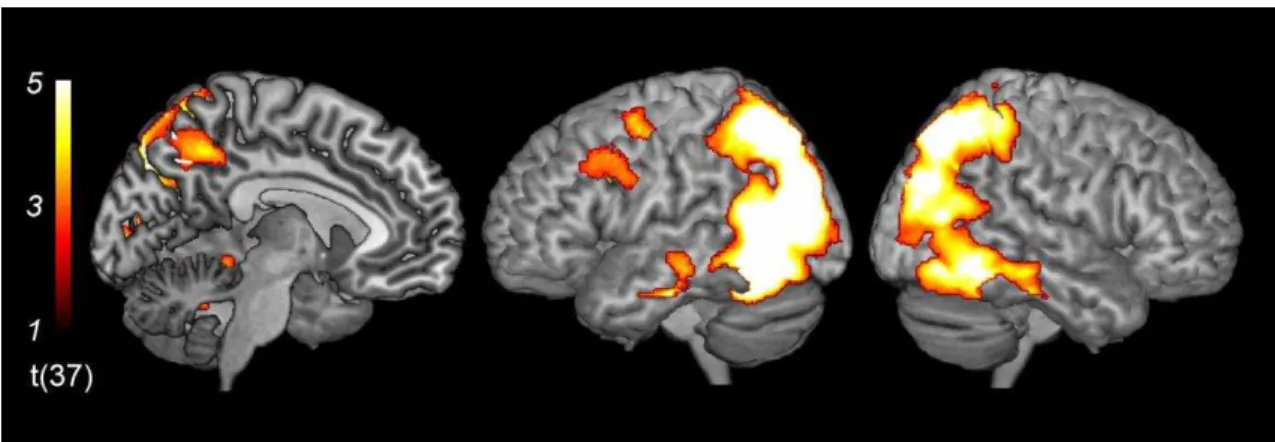
The contrast of Circles minus NoTears [(SC + NC) – (S + N)] revealed regions
of significant activation bilaterally in the TPJ, precuneus, superior parietal lobule,
superior, middle and inferior occipital gyri, supramarginal gyrus, middle and inferior
temporal gyri, fusiform gyrus, parahippocampal gyrus and cerebellum (Figure 4 and
Table 3). In addition, the same contrast revealed significant activation in the left
hemisphere: specifically, in the precentral gyrus, postcentral gyrus, middle and inferior
frontal gyrus.
The contrast of Tears minus Circles [(ST + NT) – (SC + NC)] revealed no
significant activation.
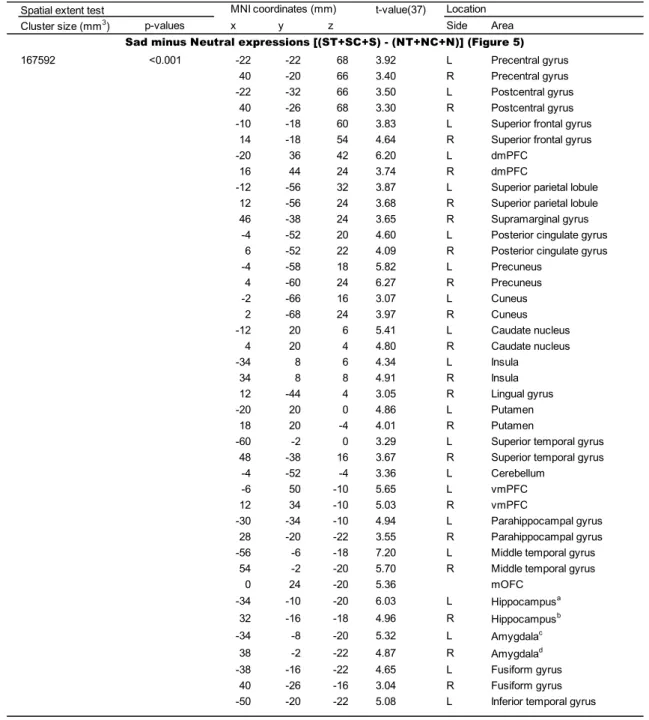
4.2.1.2. The main effect of sad expressions. The contrast of Sad minus Neutral
expressions [(ST + SC + S) – (NT + NC + N)] revealed significant activation bilaterally
in the mPFC (dmPFC, vmPFC, and mOFC), precuneus, and posterior cingulate gyrus
(Figure 5 and Table 4). In addition to these regions, the same contrast revealed
bilateral activation in the precentral gyrus, postcentral gyrus, superior frontal gyrus,
superior parietal lobule, cuneus, caudate nucleus, insula, putamen, superior and middle
temporal gyri, parahippocampal gyrus, hippocampus, amygdala, and fusiform gyrus. I
also found activation in the left cerebellum, left inferior temporal gyrus, right
supramarginal gyrus, and right lingual gyrus.
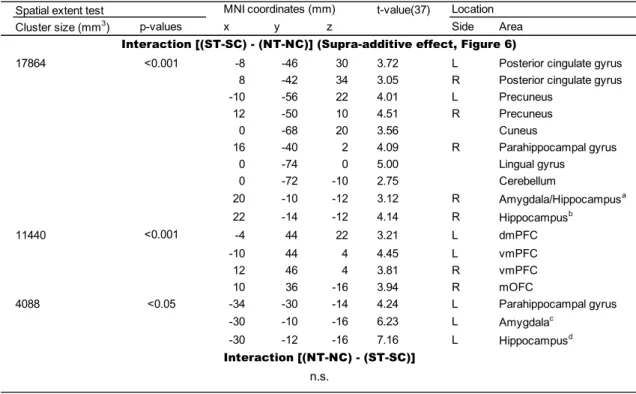
4.2.1.3. Interactions between Tears and Sad facial expressions. The contrast of the
supra-additive effect [(ST – SC) – (NT – NC)] revealed bilateral activation in vmPFC,
posterior cingulate gyrus, precuneus, cuneus, parahippocampal gyrus, lingual gyrus,
cerebellum, amygdala, and hippocampus. Moreover, the same contrast revealed
significant activation in the left dmPFC and right mOFC (Figure 6 and Table 5). The
opposite contrast [(NT – NC) – (ST – SC)] revealed no significant activation.
Collectively, activity in the mPFC and PCC showed the main effect of tears,
the main effect of sad expressions, and the supra-additive effect. By contrast, activity in
the TPJ showed only effects related to tears and circles. In order to further characterize
response patterns in these regions, I conducted the following ROI analysis.
4.2.2. ROI analysis
4.2.2.1. ROI definitions. In the whole-brain analysis, only the main effect of tears
showed activation in all nodes of the core mentalizing network (the mPFC, PCC, and
TPJ). Thus, I functionally defined ROIs based on this effect. In order to avoid the
double-dipping problem (Kriegeskorte et al., 2009), I conducted a separate fMRI
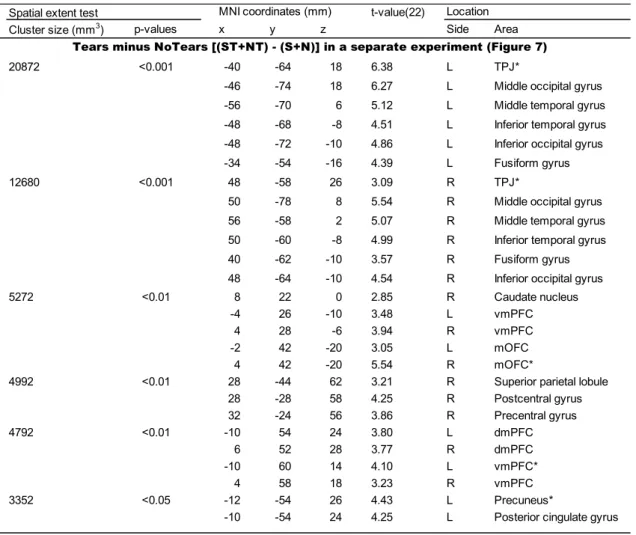
experiment to localize the mPFC, PCC, and TPJ. I found six clusters of significant
activation (Figure 7 and Table 6). Among these, the following five clusters
corresponded to the core mentalizing network: one cluster in the superior mPFC
(dmPFC and vmPFC); one cluster in the inferior mPFC (mOFC and vmPFC); one
cluster in the PCC; one cluster in the left TPJ; and one cluster in the right TPJ. I used
these five ROIs in the analyses (Figure 8A).
4.2.2.2. Univariate analysis. Figure 8B shows the contrast estimates (i.e., the activity
relative to the Neutral NoTears [N] condition) for the four conditions of interest. I
confirmed that the contrast estimates in the ST, SC, and NT conditions were
significantly greater than the N condition in all ROIs except for the SC condition in the
superior mPFC (p values < 0.05, one-tailed one-sample t tests). More specifically, the
same statistical test showed a tendency toward significance in the SC condition of the
superior mPFC (t (37) = 1.6, p = 0.06).
The PCC and two clusters in the mPFC showed greater activity in the ST
condition compared to the other three conditions. Two-way ANOVAs (2 levels of Tears
× 2 levels of Facial Expressions) on the contrast estimates of these regions showed
significant main effects of Tears [F(1, 37) = 8.9, p < 0.01 for the PCC; F(1, 37) = 8.7, p
< 0.01 for the inferior mPFC; and F(1, 37) = 10.3, p < 0.01 for the superior mPFC] and
Facial Expressions [F(1, 37) = 13.9, p < 0.01 for the PCC; F(1,37) = 23.9, p < 0.001 for
the inferior mPFC; and F(1, 37) = 8.6, p < 0.01 for the superior mPFC]. The same
ANOVA also revealed significant interactions between the two factors in the PCC [F(1,
37) =10.4, p < 0.01] and inferior mPFC [F(1, 37) =6.2, p < 0.05], and an interaction
showing a trend toward significance in the superior mPFC [F(1, 37) = 3.7, p = 0.06].
Post-hoc pairwise comparisons (with a Bonferroni correction) in these regions showed
significantly greater contrast estimates in the ST than the SC condition (p values < 0.01),
whereas there were no such differences between the NT and NC conditions (p values >
0.2).
In contrast to the midline regions, I observed no such differences in the TPJ.
The same two-way ANOVAs (2 levels of Tears × 2 levels of Facial Expressions)
revealed neither significant main effects (p values > 0.06) nor interactions (p values >
0.3).
4.2.2.3. Multi-voxel pattern analysis (MVPA). As shown above, in the TPJ, I found
neither an effect of Tears (i.e., greater activity in Tears relative to Circles conditions)
nor an interaction with facial expressions. Given the recent controversy about the role of
the TPJ (Decety and Lamm, 2007; Mitchell, 2008; Scholz et al., 2009; Cabeza et al.,
2012), it is possible that activation in the TPJ merely reflects the detection of small
objects on the face (i.e., tears and circles) (Decety and Lamm, 2007; Mitchell, 2008).
Alternatively, neural populations that subserve different functions (mentalizing and
attention reorienting) might be located in neighboring but distinct regions within the
TPJ (Scholz et al., 2009). In order to address this point, I conducted an MVPA analysis
in each ROI to compare activation patterns between the Tears and Circles conditions.
Figure 9 shows the plot of the correlation coefficients in each ROI. One-way
ANOVAs (Tears, Circles, and Tears vs. Circles) on the Z scores of the correlation
coefficients for each ROI revealed a significant main effect in the bilateral TPJ and
superior mPFC [F (2, 74) = 3.2, p < 0.05 for the left TPJ; F (2, 74) = 3.8, p < 0.05 for
the right TPJ; and F (2, 74)= 3.7, p < 0.05 for the superior mPFC]. Neither the inferior
mPFC nor the PCC showed a significant main effect (p values > 0.05). Post-hoc
pair-wise comparisons (with the Bonferroni correction) revealed that the within-factor
of Tears showed greater correlation coefficients than the between-factor of Tears and
Circles in the bilateral TPJ and superior mPFC (p values < 0.05). No other significant
differences were observed (p values > 0.1).
5. Discussion
In the present study, the mPFC and PCC showed a supra-additive effect
between sad facial expressions and the presence of tears. In contrast, the TPJ only
showed different patterns of activation between tears and circles, revealed by the
MVPA.
5.1. Behavioral performance
I confirmed the tear effect (Provine et al., 2009) by showing that the
observation of tears increased ratings of sadness compared with control conditions in
which there were no tears (no tears and circles conditions; Figure 2). I also found
interaction effects between sad facial expressions and tears: the tear effect was smaller
for sad expressions than for neutral expressions. In other words, a signal of sadness
shows a reduced effect when another indicator of sadness is already present. This
sub-additive effect might be explained by Weber’s law, which states that the change in
stimulus intensity that can be discriminated is a constant fraction of the intensity of the
original stimulus (e.g., facial expressions, Gao et al., 2013).
5.2. Tear effect in the mPFC, PCC, and TPJ
I found that all nodes of the core mentalizing network (mPFC, PCC, and TPJ)
were activated when rating the sadness of faces with tears compared to faces without
tears (Figures 3 and 8B). To the best of my knowledge, only one study has examined
the brain activity of the tear effect. More specifically, Hendriks et al. (2007) examined
an early event-related potential (ERP) component (N170) in response to faces when the
subject observed crying (with tears) and other facial expressions. However, neither the
latency nor the amplitude of the ERPs differed between crying and other facial
expressions. To the best of my knowledge, the present study is the first that has
identified the neural substrates underlying the tear effect.
5.3. Supra-additive effect between tears and facial expressions in the mPFC and PCC
I found that the inferior mPFC (covering the mOFC and vmPFC) and the PCC
showed not only main effects of facial expressions and tears, but also the supra-additive
effect between them. As in the field of multisensory research, my result indicates that
the mPFC and PCC are involved in integrating tears and facial expressions for the
purpose of inferring others’ sadness. In other words, these regions might be engaged in
combining the perceived social signals to infer the most likely extent of others’ sadness.
Previous lesion studies showed that damage to the orbitofrontal cortex (OFC),
a part of the mPFC, produces impairments in the recognition of social signals involving
emotional facial expressions (Hornak et al., 1996; Blair and Cipolotti, 2000; Rolls,
2004; Dal Monte et al., 2013; Willis et al., 2014) and emotional vocal expressions
(Hornak et al., 1996; Hornak et al., 2003; Rolls, 2004). In accord with these findings,
previous neuroimaging studies have indicated that the mPFC contains abstract
representations of others’ emotional states regardless of the type of social signal (Peelen
et al., 2010; Skerry and Saxe, 2014). However, as each type of social signal was
presented separately in these studies, it was unclear whether the mPFC showed an
interaction effect between multiple social signals. Moreover, unlike the mPFC, the role
of the PCC has been poorly investigated in the context of mentalizing. The current study
revealed that the mPFC and PCC showed an interaction effect between distinct social
signals during affective mentalizing, providing more direct evidence for the integration
of social signals in these regions.
One explanation of this result is that the integration process is conducted in
other brain regions, and the supra-additive effect in the mPFC and PCC represents the extent of others’ sadness provided by such an integration process. However, this interpretation was not supported by the following two findings. First, only the mPFC
and PCC consistently met the criteria of convergence (i.e., were activated by each social
signal) and interaction. Second, if the supra-additive effect in the mPFC represents the
degree of sadness, the supra-additive effect should be also observed in the behavioral
result. However, the sub-additive effect, but not the supra-additive effect, was observed
in the sadness rating (Figures 2 and 8B). Thus, it is unlikely that the supra-additive
effect simply represents the extent of sadness. Rather, the supra-additive effect is better
explained by the hypothesis that integrating two different social signals (for the purpose
of affective mentalizing) imposes greater processing demands in the mPFC and PCC
than individual signals.
The core mentalizing network (such as the mPFC and PCC) and the human
homologue of the mirror-neuron system (e.g., the inferior frontal gyrus and inferior
parietal lobule) are both active during the recognition of others’ facial emotions (Phan et
al., 2002; Carr et al., 2003; Winston et al., 2003; Lennox et al., 2004; Vytal and Hamann,
2010; Kitada et al., 2013). As compared to the mirror-neuron system, the core
mentalizing network seems to be active when observers reflect on the cause of the
behavior — e.g., why is this person shedding tears? (Van Overalle and Beatens, 2009).
The core mentalizing network is also proposed to be a part of the social “reflective
system” (C system), a slow system that is responsible for taking situational constraint
information and other prior knowledge into account for mentalizing (Satpute and
Liberman, 2006). In order to determine that the person shedding tears is sad, we rely on
knowledge based on previous experience. Consistent with this view, the PCC is
associated with long-term memory (Minoshima et al., 1997; Ranganath et al., 2004;
Wagner et al., 2005; Cavanna and Trimble, 2006; Matsuda, 2007). For instance, Alzheimer’s disease (AD) is characterized not only by medial temporal lobe (MTL) atrophy, but also by a reduction of glucose metabolism in the cingulo-parietal cortex,
including the precuneus (Matsuda, 2007). Activity in the precuneus is reduced in
patients with very-early-stage AD who exhibit only memory impairment, without
general cognitive decline (Minoshima et al., 1997). The default mode network (DMN),
including the mPFC and PCC, is often associated with mind wandering, which can
result in the retrieval of an episodic memory (Mason et al., 2007; Spreng et al., 2009).
In the present study, the PCC showed activation not only in the presence of tears, but
also during the observation of sad facial expressions (relative to neutral expressions;
Figures 5 and 8B). Therefore, the PCC might be involved in the retrieval of the social
meaning of tears (i.e., as a symbol of sadness) from long-term memory, and the
integration of the retrieved social knowledge with the sad facial expressions.
In addition to the PCC, I found the supra-additive effect in the inferior mPFC,
including the mOFC and vmPFC. Subregions in the mPFC are thought to play distinct
but complementary roles in mentalizing (Amodio and Frith, 2006; Krueger et al., 2009).
Krueger et al. (2009) proposed that the inferior mPFC supports inferences about the
likely affective response and reward value accompanying goal achievement. According
to this hypothesis, the process of integrating tears and facial expressions in this region
might reflect the evaluation of the state of sadness (i.e., how sad is this person?).
Lesions in the OFC can lead to abnormal social judgments in response to emotional
faces (Willis et al., 2010). More specifically, the subjects in this study were presented
with faces portraying emotional expressions and asked to imagine whether they would
approach them to ask for directions. Compared to control (intact) subjects and patients
with damage to frontal regions sparing the OFC, the patients with damage to the OFC
tended to have abnormal approachability judgments: OFC patients rated faces
displaying negative emotional expressions as significantly more approachable than the
other subject groups.
I also found that the superior mPFC showed a tendency toward the
supra-additive effect (Figure 8B). The MVPA showed that, unlike the inferior mPFC
and PCC, the superior mPFC showed different patterns of activation between tears and
circles (Figure 7). This result indicates different roles between the superior and inferior
mPFC. The superior mPFC is thought to support inferences about the likely actions
performed by others for goal achievement (i.e., why is this person shedding tears?)
(Krueger et al., 2009). As such, it is possible that, along with the PCC, these subregions
in the mPFC might work in concert to infer others’ state of sadness at an abstract level.
I also observed the supra-additive effect in areas of the limbic system such as
the MTL and amygdala (Table 5). The supra-additive effect in the MTL is consistent
with my speculation that the social knowledge of tears is retrieved from long-term
memory and integrated with sad facial expressions (Eldridge et al., 2000; Miyashita,
2004). The amygdala is considered as a part of the social “reflexive system” (X system),
which automatically and quickly evaluates others’ behavior (Satpute and Lieberman,
2006). Thus, this reflexive system (X system) might be engaged in the integration of
social signals directly (Morris et al., 1998) or indirectly via the top-down modulation
from parts of the reflective system (C system), such as the mPFC and PCC (Ochsner et
al., 2002; Pessoa et al., 2002). However, unlike the mPFC and PCC, the MTL and
amygdala were not consistently activated by the presence of tears in the two
experiments; they were not activated in the separate experiment (Figure 7 and Table 6).
Therefore, further studies are necessary to examine whether the MTL and amygdala are
important for the integration of tears and facial expressions.
5.4. No interaction effect in the TPJ
Like the mPFC and PCC, the TPJ showed greater activation when viewing
faces with tears than without tears, which was a more liberal control than circles
(Figures 3 and 8A). However, the TPJ differed from the mPFC and PCC in two ways:
first, I observed no interaction between facial expressions and tears (Figure 8B); and
second, although the TPJ was also activated by control circles (relative to faces without
tears), detailed spatial patterns of activation differed between tears and control circles
(Figure 9). These results indicate that the TPJ is engaged not in the integration of
signals related to tears and facial expressions, but rather in the processing of objects on
a face like tears.
The TPJ is thought to be a hub of diverse functions, including perceptual/motor
reorienting and theory of mind (Cabeza et al., 2012). In the present study, I minimized
differences in the locations and sizes of the tears and circles. Thus, it is unlikely that
different activation patterns within the TPJ are due to different degrees of attention
orienting between tears and tear-like circles. Scholz et al. (2009) showed neighboring
but distinct patterns of activation in the TPJ between mentalizing (i.e., false-belief story)
and spatial attention tasks (Posner paradigm; Corbetta and Shulman, 2002). Therefore, it
is reasonable to interpret the different activation patterns in the TPJ between tears and
circles as reflecting different processing between the two stimuli.
It has been proposed that one of the general functions of the TPJ is to detect a
mismatch between our expectations and actual outcomes (Corbetta et al., 2008;
Koster-Hale and Saxe, 2013). More specifically, the TPJ is activated when a target is
presented in an unexpected location in spatial attention tasks (Posner paradigm;
Corbetta and Shulman, 2002). False-belief stories, which are often used in mentalizing
tasks, require processing information detected outside the main focus of attention
(Cabeza et al., 2012). Shedding tears (in adults) and circles are rarely observed in our
daily life, whereas the activation pattern between tears and circles differed in the TPJ.
Therefore, it is possible that the TPJ is involved in detecting and perceiving unusual
objects such as tears.
5.5. Limitations
Three limitations must be considered. First, I utilized pictures of different
individuals between the sad and neutral conditions. It is unlikely that the supra-additive
effect is also affected by the difference in facial identity, because this factor is
subtracted out in the supra-additive effect [(ST – SC) – (NT – NC)]. However, I cannot
rule out the possibility that greater activation in sad expressions (relative to neutral
expressions) can be partially explained by different facial identity. Second, female
subjects only participated in present study, because they tend to react to crying people
with more sympathy and support than males (Cretser et al., 1982). However, future
studies should test whether this finding can be generalized to male subjects, and
examine the integration of facial expressions and tears in genders that are different from
the subjects (the cross-gender effect). Finally, I used the sad and neutral facial
expressions. However, tears can be shed in response to many different emotions
(Murube et al., 1999). Future studies should test whether the same supra-additive effect
can be observed when others facial expressions were integrated with tears in affective
mentalizing.
6. Conclusions
The present study investigated which nodes of the core mentalizing network
are involved in the integration of tears and facial expressions that are used to infer the
extent of others’ sadness. I found that the mPFC and PCC showed a supra-additive
effect between tears and facial expressions. In contrast, the TPJ showed no such effect.
These results indicate that the mPFC and PCC are involved in integrating distinct social
signals to represent others’ sadness at an abstract level. These results highlight the
differences in the contributions of the mPFC, PCC, and TPJ to affective mentalizing.
7. Acknowledgments
First and foremost, I offer my deepest gratitude to Dr. Norihiro Sadato whose
expertise and generous support were invaluable for this thesis. I also would like to
express my deepest gratitude to Dr. Ryo Kitada whose meticulous comments and
continuous encouragement were an enormous help to me in conceiving and shaping this
thesis. I gratefully acknowledge the contributions of Dr. Hiroaki Kawamichi and Dr.
Akihiro Sasaki for their support to make this thesis possible and providing insightful
comments. I also gratefully acknowledge the contributions of Dr. Takanori Kochiyama
and Dr. Shuntaro Okazaki for their support to analyze the data for this thesis. Special
thanks also go to my colleagues in Division of Cerebral Integration at NIPS for their
assistance and gently support.
Finally, I would like to express a deep sense of gratitude to my parents for
supporting me emotionally and financially over the years. Thanks to them, I have
enjoyed so many challenges and opportunities.
8. References
Adolphs, R,. 1999. Social cognition and the human brain. Trends. Cogn. Sci. 3,
469–479.
Amodio, D.M., Frith, C.D., 2006. Meeting of minds: the medial frontal cortex and
social cognition. Nat. Rev. Neurosci. 7, 268–277.
Amunts, K., Kedo, O., Kindler, M., Pieperhoff, P., Mohlberg, H., Shah, N.J., Habel, U.,
Schneider, F., Zilles, K., 2005. Cytoarchitectonic mapping of the human
amygdala, hippocampal region and entorhinal cortex: intersubject variability
and probability maps. Anat. Embryol. (Berl.) 210, 343–352.
Atique, B., Erb, M., Gharabaghi, A., Grodd, W., Anders, S., 2011. Task-specific activity
and connectivity within the mentalizing network during emotion and intention
mentalizing. Neuroimage 55, 1899–1911.
Balsters, M.J.H., Krahmer, E.J., Swerts, M.G.J., Vingerhoets, A.J.J.M., 2013.
Emotional tears facilitate the recognition of sadness and the perceived need
for social support. Evol. Psychol. 11, 148–158.
Barbey, A.K., Krueger, F., Grafman, J., 2009. Structured event complexes in the medial
prefrontal cortex support counterfactual representations for future planning.
Philos. Trans. R. Soc. Lond. B Biol. Sci. 364, 1291–1300.
Blair, R.J.R., Cipolotti, L., 2000. Impaired social response reversal: A case of ‘acquired
sociopathy’. Brain 123, 1122–1141.
Brothers. L., 1990. The social brain: A project for integrating primate behavior and
neurophysiology in a new domain. Concepts Neurosci. 1, 27–251.
Cabeza, R., Ciaramelli, E., Moscovitch, M., 2012. Cognitive contributions of the ventral
parietal cortex: an integrative theoretical account. Trends Cogn. Sci. 16,
338–352.
Calvert, G.A., Campbell, R., Brammer, M.J., 2000. Evidence from functional magnetic
resonance imaging of crossmodal binding in the human heteromodal cortex.
Curr. Biol. 10, 649–657.
Carr, L., Iacoboni, M., Dubeau, M.C., Mazziotta, J.C., Lenzi, G.L., 2003. Neural
mechanisms of empathy in humans: a relay from neural systems for imitation
to limbic areas. Proc. Natl. Acad. Sci. USA. 100, 5497–5502.
Cavanna, A.E., Trimble, M.R., 2006. The precuneus: a review of its functional anatomy
and behavioural correlates. Brain 129, 564–583.
Corbetta, M., Shulman, G.L., 2002. Control of goal-directed and stimulus-driven
attention in the brain. Nat. Rev. Neurosci. 3, 201–215.
Corbetta, M., Patel, G., Shulman, G.L., 2008. The reorienting system of the human
brain: from environment to theory of mind. Neuron 58, 306–324.
Corradi-Dell’Acqua, C., Hofstetter, C., Vuilleumier, P., 2014. Cognitive and affective
theory of mind share the same local patterns of activity in posterior temporal
but not medial prefrontal cortex. Soc. Cogn. Affect. Neurosci. 9, 1175–1184.
Cretser, G.A., Lombardo, W.K., Lombardo, B., Mathis, S., 1982. Reactions to men and
women who cry: a study of sex differences in perceived societal attitudes
versus personal attitudes. Percept. Mot. Skills 55, 479–486.
Dal Monte, O., Krueger, F., Solomon, J.M., Schintu, S., Knutson, K.M., Strenziok, M.,
Pardini, M., Leopold, A., Raymont, V., Grafman, J., 2013. A voxel-based
lesion study on facial emotion recognition after penetrating brain injury. Soc.
Cogn. Affect. Neurosci. 8, 632–639.
Decety, J., Lamm, C., 2007. The role of the right temporoparietal junction in social
interaction: how low-level computational processes contribute to
meta-cognition. Neuroscientist 13, 580–593.
Dunbar, R.I.M., Shultz, S., 2007. Evolution in the social brain. Science 317,
1344–1347.
Eickhoff, S.B., Stephan, K.E., Mohlberg, H., Grefkes, C., Fink, G.R., Amunts, K., Zilles,
K., 2005. A new SPM toolbox for combining probabilistic cytoarchitectonic
maps and functional imaging data. Neuroimage 25, 1325–1335.
Eldridge, L.L., Knowlton, B.J., Furmanski, C.S., Bookheimer, S.Y., Engel, S.A., 2000.
Remembering episodes: a selective role for the hippocampus during retrieval.
Nat. Neurosci. 3, 49–52.
Evans, A.C., Kamber, M., Collins, D.L., MacDonald, D., 1994. An MRI-Based
Probabilistic Atlas of Neuroanatomy, In: Shorvon, S.D., Fish, D.R.,
Andermann, F., Bydder, G.M., Stefan, H. (Eds.), Magnetic Resonance
Scanning and Epilepsy. vol. 264 Springer, New York, pp. 263–274.
Friston, K.J., Jezzard, P., Turner, R., 1994a. Analysis of functional MRI time-series.
Hum. Brain Mapp. 1, 153–171.
Friston, K.J., Worsley, K.J., Frackowiak, R.S., Mazziotta, J.C., Evans, A.C., 1994b.
Assessing the significance of focal activations using their spatial extent. Hum
Brain Mapp. 1, 210-220.
Friston, K.J., Ashburner, J., Frith, C.D., Poline, J.-B., Heather, J.D., Frackowiak, R.S.J.,
1995. Spatial registration and normalization of images. Hum. Brain Mapp. 2,
165–188.
Friston, K.J., Holmes, A., Poline, J.B., Price, C.J., Frith, C.D., 1996. Detecting
activations in PET and fMRI: levels of inference and power. Neuroimage 4,
223–235.
Friston, K.J., Glaser, D.E., Henson, R.N.A., Kiebel, S., Phillips, C., Ashburner, J., 2002.
Classical and Bayesian inference in neuroimaging: applications. Neuroimage
16, 484–512.
Friston, K.J., Ashburner, J., Kiebel, S.J., Nichols., T.E., Penny, W.D., 2007. Statistical
Parametric Mapping: The Analysis of Functional Brain Images. Academic
Press, London.
Frith, U., Frith, C.D., 2003. Development and neurophysiology of mentalizing. Philos.
Trans. R. Soc. Lond. B Biol. Sci. 358, 459–473.
Frith, C.D., 2007. The social brain? Philos. Trans. R. Soc. Lond. B. Biol. Sci. 362,
671–678.
Gao, X., Maurer, D., Nishimura, M., 2013. Altered representation of facial expressions
after early visual deprivation. Front. Psychol. 4, 878.
Goel, V., Grafman, J., Sadato, N., Hallett, M., 1995. Modeling other minds.
Neuroreport 6, 1741–1746.
Haxby, J.V., Gobbini, M.I., Furey, M.L., Ishai, A., Schouten, J.L., Pietrini, P., 2001.
Distributed and overlapping representations of faces and objects in ventral
temporal cortex. Science 293, 2425–2430.
Haynes, J.D., Sakai, K., Rees, G., Gilbert, S., Frith, C., Passingham, R.E., 2007.
Reading hidden intentions in the human brain. Curr. Biol. 17, 323–328.
Hendriks, M.C., Van Boxtel, G.J., Vingerhoets, A.J.J.M., 2007. An event-related
potential study on the early processing of crying faces. Neuroreport 18,
631–634.
Holmes, A.P., Friston, K.J., 1998. Generalizability, random effects and population
inference. Neuroimage 7, S754.
Hornak, J., Rolls, E.T., Wade, D., 1996. Face and voice expression identification in
patients with emotional and behavioural changes following ventral frontal
lobe damage. Neuropsychologia 34, 247–261.
Hornak, J., Bramham, J., Rolls, E.T., Morris, R.G., O’Doherty, J., Bullock, P.R., Polkey,
C.E., 2003. Changes in emotion after circumscribed surgical lesions of the
orbitofrontal and cingulate cortices. Brain 126, 1691–1712.
Kennedy, D.P., Adolphs, R., 2012. The social brain in psychiatric and neurological
disorders. Trends. Cogn. Sci. 16, 559–572
Kitada, R., Okamoto, Y., Sasaki, A.T., Kochiyama, T., Miyahara, M., Lederman, S.J.,
Sadato, N., 2013. Early visual experience and the recognition of basic facial
expressions: involvement of the middle temporal and inferior frontal gyri
during haptic identification by the early blind. Front. Hum. Neurosci. 7, 7.
Koster-Hale, J., Saxe, R., 2013. Theory of mind: a neural prediction problem. Neuron
79, 836–848.
Kriegeskorte, N., Simmons, W.K., Bellgowan, P.S.F., Baker, C.I., 2009. Circular
analysis in systems neuroscience: the dangers of double dipping. Nat.
Neurosci. 12, 535–540.
Krueger, F., Barbey, A.K., Grafman, J., 2009. The medial prefrontal cortex mediates
social event knowledge. Trends Cogn. Sci. 13, 103–109.
Lennox, B.R., Jacob, R., Calder, A.J., Lupson, V., Bullmore, E.T., 2004. Behavioural
and neurocognitive responses to sad facial affect are attenuated in patients
with mania. Psychol. Med. 34, 795–802.
Mason, M.F., Norton, M.I., Van Horn, J.D., Wegner, D.M., Grafton, S.T., Macrae, C.N.,
2007. Wandering minds: the default network and stimulus-independent
thought. Science 315, 393–395.
Matsuda, H., 2007. Role of neuroimaging in Alzheimer’s disease, with emphasis on
brain perfusion SPECT. J. Nucl. Med. 48, 1289–1300.
Meredith, M.A., Stein, B.E., 1983. Interactions among converging sensory inputs in the
superior colliculus. Science 221, 389-391.
Minoshima, S., Giordani, B., Berent, S., Frey, K.A., Foster, N.L., Kuhl, D.E., 1997.
Metabolic reduction in the posterior cingulate cortex in very early
Alzheimer’s disease. Ann. Neurol. 42, 85–94.
Mitchell, J.P., 2008. Activity in right temporo-parietal junction is not selective for
theory-of-mind. Cereb. Cortex 18, 262–271.
Miyashita, Y., 2004. Cognitive memory: cellular and network machineries and their
top-down control. Science 306, 435–440.
Morris J.S., Ohman, A., Dolan, R.J., 1998. Conscious and unconscious emotional
learning in the human amygdala. Nature 393, 467–470.
Murube, J., Murube, L., Murube, A., 1999. Origin and types of emotional tearing. Eur. J.
Ophthalmol. 9, 77–84.
Oldfield, R.C., 1971. The assessment and analysis of handedness: the Edinburgh
inventory. Neuropsychologia 9, 97–113.
Ochsner, K.N., Bunge, S.A., Gross, J.J., Gabrieli, J.D.E., 2002. Rethinking feelings: an
fMRI study of the cognitive regulation of emotion. J. Cogn. Neurosci. 14,
1215–1229.
Peelen, M.V., Wiggett, A.J., Downing, P.E., 2006. Patterns of fMRI activity dissociate
overlapping functional brain areas that respond to biological motion. Neuron
49, 815–822.
Peelen, M.V., Atkinson, A.P., Vuilleumier, P., 2010. Supramodal representations of
perceived emotions in the human brain. J. Neurosci. 30, 10127–10134.
Perry, A., Shamay-Tsoory, S., 2013. Understanding Emotional and Cognitive Empathy:
A neuropsychological perspective, In: Baron-Cohen, S., Lombardo, M.,
Tager-Flusberg, H. (Eds.), Understanding Other Minds: Perspectives from
developmental social neuroscience. Oxford University Press, London, pp.
178–194.
Pessoa, L., McKenna, M., Gutierrez, E., Ungerleider, L.G., 2002. Neural processing of
emotional faces requires attention. Proc. Natl. Acad. Sci. USA. 99,
11458–11463.