N
um
er i c al i nves t i gat i ons t o s uppr es s t her m
al
def or m
at i on of t he l ar ge depl oyabl e r ef l ec t or
dur i ng ear t h ec l i ps e i n s pac e
著者
Shoj i Kaor i , I s obe D
ai gor o, U
s ui M
ot of um
i
j our nal or
publ i c at i on t i t l e
The Aer onaut i c al j our nal
vol um
e
121
num
ber
1241
page r ange
970- 982
year
2017- 07
権利
( C) Royal Aer onaut i c al Soc i et y 2017
U
RL
ht t p: / / hdl . handl e. net / 2241/ 00149336
Numerical Investigations to Suppress
Thermal Deformation of the Large Deployable Reflector
during Earth Eclipse in Space
Kaori Shoji 1, Motofumi Usui 2 and Daigoro Isobe 3
1 University of Tsukuba, Tennodai 1-1-1, Tsukuba-shi, Ibaraki, JAPAN
2 Japan Aerospace Exploration Agency, Higashi-machi Jindaiji 7-44-1, Chofu-shi, Tokyo, JAPAN
3 University of Tsukuba, Tennodai 1-1-1, Tsukuba-shi, Ibaraki, JAPAN
Abstract
Space structures encounter various severe environments in space. One of these environments is severe thermal conditions. The signal level of the radio wave from the large deployable reflector (LDR) mounted on the Engineering Test Satellite -VIII (ETS-VIII) was observed to change during an Earth eclipse. This phenomenon was assumed to be caused by the thermal deformation of the LDR. Therefore, in this study, a means to suppress the thermal deformation is proposed and demonstrated by focusing on the internal force generated at the springs used to deploy the antenna. According to the numerical results obtained from finite element analyses, the thermal deformations at all apices that support the reflectors were suppressed at a high correction rate by adjusting the coefficients of thermal expansion in the structural members and by controlling spring forces differently in four areas depending on the distances from the constraint point.
Keywords: ETS-VIII, finite element analysis, large deployable reflector, large space structure, thermal deformation, earth eclipse, communication beam, communications satellite.
Introduction
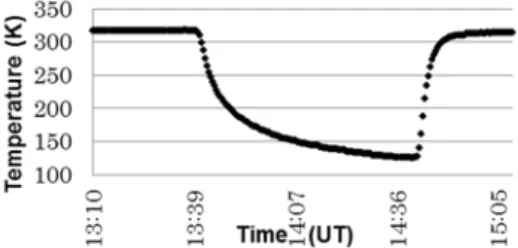
Space structures encounter various severe environments in space. One of these environments is severe thermal conditions. When the Engineering Test Satellite -VIII (ETS-VIII) entered the Earth’s shadow, the difference in the temperature during the day time and night time was approximately 200°C [1,2], as shown in Fig. 1. During this eclipse time, the signal level of a radio wave from the large deployable reflector (LDR) mounted on the ETS-VIII was observed to change [3]. It was calculated in [4] that this phenomenon led to a 60- to 100-km
Fig. 1: Temperature of the LDR during Earth eclipse (©JAXA)
Fig. 2: ETS-VIII launched in 2006 (©JAXA)
Satellite body
Large Deployable Reflector (LDR) (19m×17m)
transition of the footprint of the communication beam on the surface of the earth. Also, it was confirmed that the transition was caused by some thermal deformations of the LDR [1-6]. The deformed value at the midpoint of the LDR was calculated as approximately 5 mm when the temperature decreased [6], which could lead to a 60 km transition of the footprint. Nevertheless, it was not a critical issue for the ETS-VIII because the communication beam from the LDR tended to spread over a wide range. However, it may affect the performance of such satellites in the future where highly accurate pinpoint communication beams are expected to be required.
In this paper, a finite element model of the LDR was constructed and a thermal deformation analysis was performed to investigate the behaviour of the LDR during thermal transition. Furthermore, a means to mechanically suppress the thermal deformation was sought out by focusing on the internal force generated by the spring used to deploy the antenna and by optimizing the coefficient of thermal expansion of the constituent members.
Numerical Model of the LDR
In 2006, the Japan Aerospace Exploration Agency (JAXA) launched the ETS-VIII into a geostationary satellite orbit. Figure 2 shows a general sketch of the ETS-VIII. There are two LDRs, which are the largest antennas mounted on the satellite. Each LDR is as large as a tennis court. This parabolic antenna consists of 14 hexagonal modules and is highly extendable because these modules are all identical and connected with pin joints to reduce mechanical interaction.
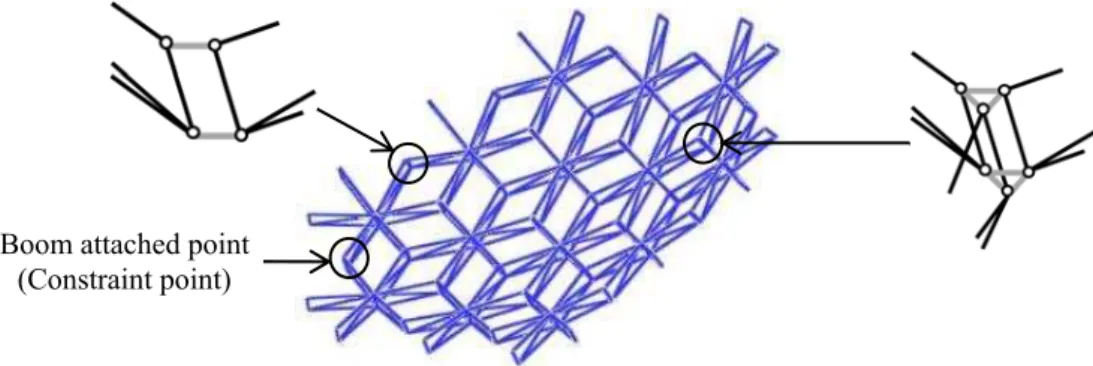
In this study, a 14-module model of the LDR was constructed for analysis. Figure 3 shows the 14-module model and the structural connections of the model. Every module is connected with titanium alloy truss members in between. These truss members are indicated in grey colour in Fig. 3. In addition, the boom extended from the satellite body is rigidly fixed to Modules 7 and 8. Therefore, rigid joints are implemented in the top and bottom nodes of longitudinal members in Modules 7 and 8 for the 14-module model. Figure 4 shows the allocation sketch of the 14 modules.
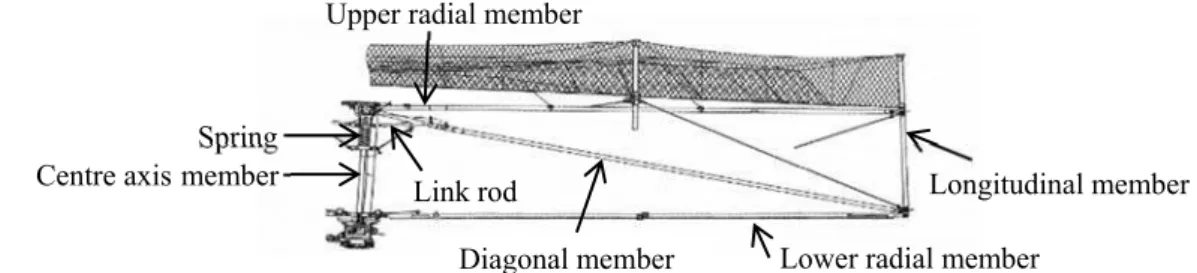
Figure 5 shows an overview of one module. The LDR consists of CFRP tubes and titanium alloy joints. Figure 6 shows a structural drawing of the automatic open umbrella mechanism in the module. The mechanism is used to deploy the antenna and is installed at the centre axis member of every module. It consists of one spring and six link rod members. The designed residual force of the spring after completion of antenna deployment is 233 N.
Fig. 3: 14-module model for analysis and the structural connections of the model
Boom attached point (Constraint point)
Fig. 4: Allocation sketch of the modules
Boom attached point (Constraint point)
①~⑭:Module No.
S1~S6:Diagonal member No. T1~T6:Upper radial member No.
(peripheral side) Y
The automatic open umbrella mechanism is introduced into the numerical model as shown in Fig.7. The spring element in the figure is a rahmen element with only its bottom-side node connected to the centre axis member. The upper-side node is connected only to the link rod elements. In these simulations, a spring force was applied to the upper-side and the bottom-side nodes of the spring element. Consequently, an internal force is transmitted through the link rod element to the diagonal member. The diagonal member is consisted of four elements; two elements at the both ends are truss elements and other two in between are rahmen elements. The members beside the diagonal member are all modeled with single truss element.
Thermal Expansion Properties of Constituent Members
Combined coefficient of thermal expansion (Combined CTE)
The combined coefficient of thermal expansion (Combined CTE) was calculated from the constituent ratio of CFRP and titanium alloy components, as shown in the following equation.
(1)
where L is the total length of each member, lCFRP is the length of a CFRP member, αCFRP is the CTE of CFRP,
lTitanium is the length of a titanium alloy joint and αTitanium is the CTE of titanium alloy. In the analyses, thermal
deformation of titanium alloy was considered by applying Eq. (1), while the stiffness of titanium alloy joints was not taken into account in the modelling.
Table 1 shows the dimensions and material properties of the constituent members. The combined CTEs vary because of differences in the fibre orientation angle of each member and in the ratio of titanium alloy components to the total length of the member. Moreover, the upper radial members expand, whereas other members shrink as the temperature decreases. This indicates that the structure of the LDR is expected to have complex behaviour during the temperature transition.
Fig. 7: Modelling of an automatic open umbrella mechanism
Spring force 233[N]
Hinge element
Hinge element Link rod element
Spring element X
Y Z
Fig. 6: Structural drawing of a deployable mechanism (©JAXA)
Spring
Centre axismember Longitudinal member
Lower radial member Diagonal member
Upper radial member
Fig. 5: Overview of one module (©JAXA)
2,400mm
Thermal strain
The thermal expansion is considered using the following equation, which expresses the relation between the temperature of an object and the thermal strain:
(2)
where ΔεT is the thermal strain increment, αis the coefficient of thermal expansion, and ΔT is the temperature
increment. The relation between the mechanical strain and the thermal strain can be expressed as the following equation.
(3)
where εm is the mechanical strain, ε is the total strain and εT is the thermal strain. These relations were
implemented in a finite element code based on Bernoulli-Euler beam elements and several thermal deformation analyses were conducted.
Table 1: Dimensions and material properties of constituent members
Material CFRP laminate
(degree) Dimensions (mm) CTE of CFRP (10-6/K) Combined CTE(10-6/K)
Upper radial
member CFRP (0/15/90/-15/0) 22×0.4×2305 - 1.07 - 0.182
Lower radial
member CFRP (0/15/90/-15/0) 20×0.4×2328 - 1.07 0.312
Diagonal
member CFRP (0/15/90/-15/0) 20×0.4×2308 - 0.33 0.948
Centre axis
member CFRP (0,90)/(±45)/(0,90)/(±45)/(0,90) 20×1×573 2.97 3.490
Longitudinal
member CFRP (0/15/90/-15/0/0) 20×0.48×554 - 1.11 0.277
Joint member Titanium alloy - - - 8.800
Fig. 8: Applied thermal history Time [min]
Te
m
pe
ra
tu
re
[
℃
]
0 100 200 300 400 500 -150
-100 -50 0
50 TA
TB
Fig. 9: Applied spring force histories
(a) Case 0, Case 2 (b) Case 1 (c) Case 3
Area A Area B Area C Area D
Time [min]
Sp
rin
g
fo
rc
e
[N
]
0 100 200 300 400 500 50
100 150 200 250
Time [min]
Sp
rin
g
fo
rc
e
[N
]
0 100 200 300 400 500 50
100 150 200 250
Time [min]
Sp
rin
g
fo
rc
e
[N
]
0 100 200 300 400 500 50
Numerical Conditions
The thermal history for the analysis was given as follows; the temperature was gradually increased step-by-step from 0°C to 50°C with an increment of 1°C and was held constantly at the maximum temperature. Then, the actual thermal history detected on the ETS-VIII, as shown in Fig. 8, was applied as an input for the analysis. The displacement evaluation point was defined at the centre and peripheral side of the upper radial member of each module. The spring force was also gradually increased step-by-step from 1 N to 233 N along with the temperature transition in the first phase, as shown in Fig. 9 (areas A-D are explained in Fig. 13). Then, thermal deformation analyses were carried out with and without controlling the spring force.
The following four cases of analyses were carried out.
Case 0: original case, without any means of suppression
(aims to confirm how the thermal deformation occurred in the 14-module model)
Thermal deformation suppressed using the following means:
Case 1: control spring forces uniformly in all modules Case 2: adjust the combined CTE of the structural members
Case 3: adjust the combined CTE of the structural members and by then control spring forces differently in each module depending on the distances from the constraint point
Thermal Deformation Analysis
Case 0
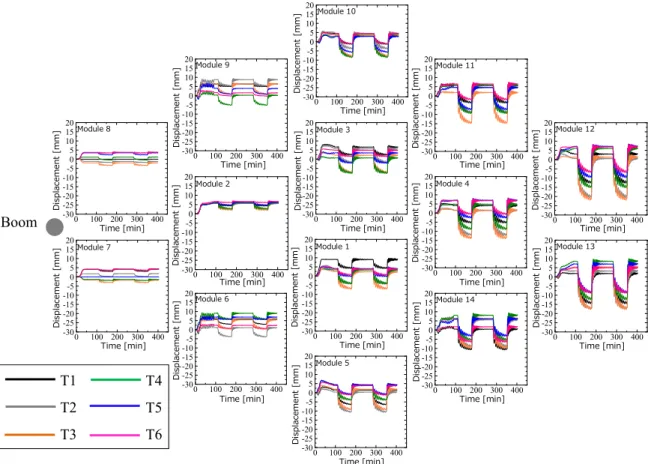
According to the thermal deformation analysis of the original model without any means of suppression, displacements occurred in the direction normal to the reflector surface during thermal transition, as shown in Figs. 10 and 11. As shown in Table 1 and Fig. 12(a), these displacements occurred due to the combined CTE of the diagonal member; the combined CTE was three times greater than that of the lower radial member, which helped the member shrink. Furthermore, the upper radial member, with a negative CTE value, expanded when the temperature decreased. Therefore, the displacements occurred in a downward direction. A position further from the constraint point resulted in a greater centre side deformation due to the accumulation of displacements. In the farthest module, the displacements were approximately 20 mm. Moreover, the midpoint of the LDR was confirmed to deform by approximately 5 mm, which explains the phenomena actually observed on the ETS-VIII .
Case 1
As a result of controlling spring forces uniformly in all modules as shown in Fig. 9(b), the centre side of the upper radial member was suppressed successfully; however, this resulted in no suppression of the peripheral side of the upper radial member. The mechanism explaining this phenomenon is the following. As shown in Fig. 12(b), the compression force generated at the diagonal member was reduced, and the centre side of the upper radial member was lifted. However, the upper radial member remained stretched while the other members such as lower radial member and diagonal member shrank due to thermal expansion, and consequently, the peripheral sides deformed in the downward direction.
Fig. 10: Displacements occurred in a direction normal to the reflector surface on the centre side of the upper radial member in Case 0
Boom Time [min]
D is pl ac em en t [ m m
] Module 8
0 100 200 300 400 -30 -25 -20 -15 -10-5 0 5 10 15 20 Time [min] D is pl ac em en t [ m m
] Module 7
0 100 200 300 400 -30 -25 -20 -15 -10-5 0 5 10 15 20 Time [min] Di sp la ce m en t [ m m
] Module 9
0 100 200 300 400 -30 -25 -20 -15 -10-5 0 5 10 15 20 Time [min] D is pl ac em en t [ m m
] Module 2
0 100 200 300 400 -30 -25 -20 -15 -10-5 0 5 10 15 20 Time [min] D is pl ac em en t [ m m
] Module 6
0 100 200 300 400 -30 -25 -20 -15 -10-5 0 5 10 15 20 Time [min] D is pl ac em en t [ m m
] Module 10
0 100 200 300 400 -30 -25 -20 -15 -10-5 0 5 10 15 20 Time [min] D is pl ac em en t [ m m
] Module 3
0 100 200 300 400 -30 -25 -20 -15 -10-5 0 5 10 15 20 Time [min] D is pl ac em en t [ m m
] Module 1
0 100 200 300 400 -30 -25 -20 -15 -10-5 0 5 10 15 20 Time [min] D is pl ac em en t [ m m
] Module 5
0 100 200 300 400 -30 -25 -20 -15 -10-5 0 5 10 15 20 Time [min] Di sp la ce m en t [ m m
] Module 11
0 100 200 300 400 -30 -25 -20 -15 -10-5 0 5 10 15 20 Time [min] D is pl ac em en t [ m m
] Module 4
0 100 200 300 400 -30 -25 -20 -15 -10-5 0 5 10 15 20 Time [min] D is pl ac em en t [ m m
] Module 14
0 100 200 300 400 -30 -25 -20 -15 -10-5 0 5 10 15 20 Time [min] D is pl ac em en t [ m m
] Module 12
0 100 200 300 400 -30 -25 -20 -15 -10-5 0 5 10 15 20 Time [min] D is pl ac em en t [ m m
] Module 13
0 100 200 300 400 -30 -25 -20 -15 -10-5 0 5 10 15 20
Fig. 11: Displacements occurred in a direction normal to the reflector surface on the peripheral side of the upper radial member in Case 0
T4 T5 T6 T1 T2 T3
Boom Time [min]
Module 8 D is pl ac em en t [ m m ]
0 100 200 300 400 -30 -25 -20 -15 -10-5 0 5 10 15 20 Time [min] D is pl ac em en t [ m m
] Module 7
0 100 200 300 400 -30 -25 -20 -15 -10-5 0 5 10 15 20 Time [min] Module 9 D is pl ac em en t [ m m ]
0 100 200 300 400 -30 -25 -20 -15 -10-5 0 5 10 15 20 Time [min] D is pl ac em en t [ m m
] Module 2
0 100 200 300 400 -30 -25 -20 -15 -10-5 0 5 10 15 20 Time [min] Module 6 Di sp la ce m en t [ m m ]
0 100 200 300 400 -30 -25 -20 -15 -10-5 0 5 10 15 20 Time [min] Module 10 D is pl ac em en t [ m m ]
0 100 200 300 400 -30 -25 -20 -15 -10-5 0 5 10 15 20 Time [min] Module 3 D is pl ac em en t [ m m ]
0 100 200 300 400 -30 -25 -20 -15 -10-5 0 5 10 15 20 Time [min] D is pl ac em en t [ m m
] Module 1
0 100 200 300 400 -30 -25 -20 -15 -10-5 0 5 10 15 20 Time [min] Module 5 D is pl ac em en t [ m m ]
0 100 200 300 400 -30 -25 -20 -15 -10-5 0 5 10 15 20 Time [min] Module 11 Di sp la ce m en t [ m m ]
0 100 200 300 400 -30 -25 -20 -15 -10-5 0 5 10 15 20 Time [min] Module 4 D is pl ac em en t [ m m ]
0 100 200 300 400 -30 -25 -20 -15 -10-5 0 5 10 15 20 Time [min] Module 14 D is pl ac em en t [ m m ]
0 100 200 300 400 -30 -25 -20 -15 -10-5 0 5 10 15 20 Time [min] Module 12 D is pl ac em en t [ m m ]
0 100 200 300 400 -30 -25 -20 -15 -10-5 0 5 10 15 20 Time [min] Module 13 D is pl ac em en t [ m m ]
Case 2
The thermal deformation that occurred in the peripheral sides of upper radial member could not be sufficiently suppressed by distributing different spring forces alone. Therefore, it was suppressed by adjusting the combined CTE of the structural members. Especially, the combined CTEs of the upper and the lower radial member, which have CTE values with opposite signs, were focused to produce maximum suppression effects with a minimum change. In other words, there is a possibility that the thermal deformation can be suppressed by an optimal combination of combined CTEs. On the other hand, the largest inner force is distributed in the diagonal member, which indicates that the diagonal member is presumed to be important for stabilizing the antenna shape. In these circumstances, the combined CTE value of the diagonal member was kept unchanged and some parametric
Fig. 12: Schematic diagram of the thermal deformation due to a decrease in the temperature (a) Without control
Broken line: Point TA (50°C)
Solid line: Point TB (-150°C)
(b) With control
Boom attached point (Constraint point)
Area D Area C
Area B Area A
Fig. 13: Schematic diagram of the partitions used to control different spring forces
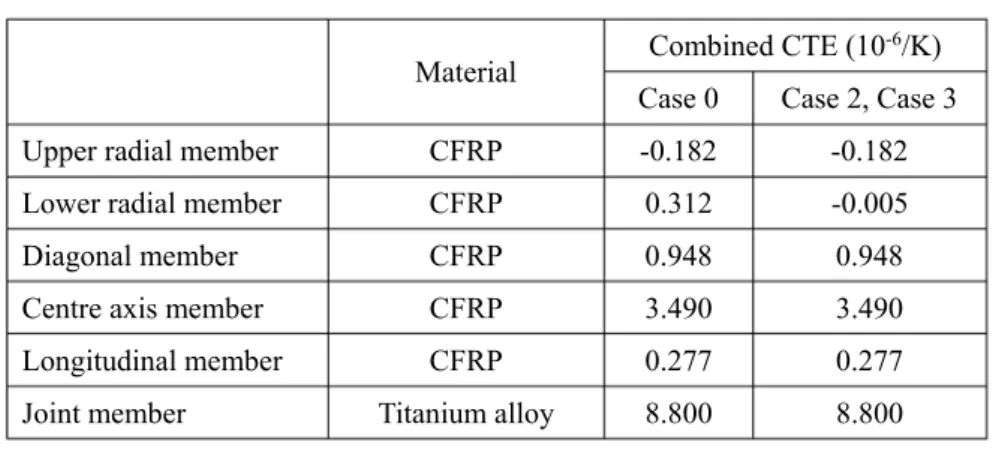
Table 2: Optimal combination of the combined CTE
Material Combined CTE (10-6/K) Case 0 Case 2, Case 3
Upper radial member CFRP -0.182 -0.182
Lower radial member CFRP 0.312 -0.005
Diagonal member CFRP 0.948 0.948
Centre axis member CFRP 3.490 3.490
Longitudinal member CFRP 0.277 0.277
studies were carried out by only changing the combined CTE of the lower radial member to find the optimized combination. The obtained combination is shown in Table 2. As a result, this method resulted in some suppression effects at the peripheral side of the upper radial member. The suppression at centre side is mainly a result of the accumulation of the peripheral side suppression, while in each module, the centre side is barely suppressed by this method as shown in Figs. 14 and 15.
Case 3
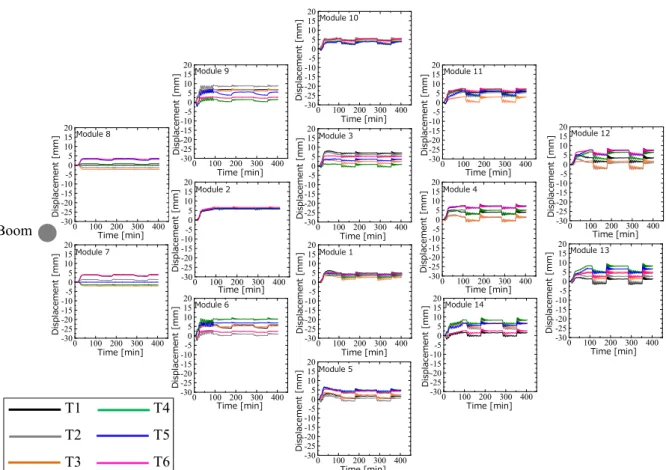
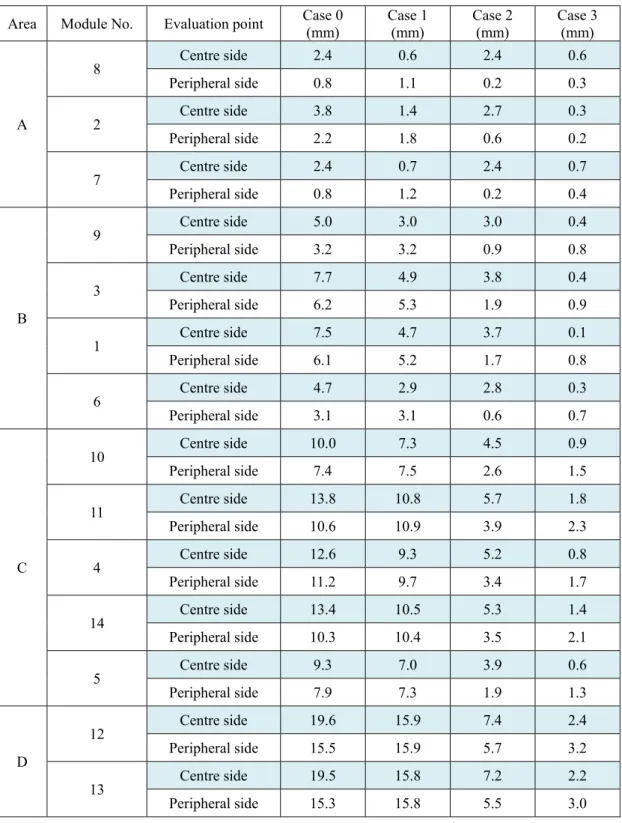
Based on the results of Case 1 and Case 2, these thermal deformations were suppressed more effectively in Case 3 by adjusting the combined CTE of the structural members and by then controlling spring forces differently in four areas. As seen in Figs. 16 and 17, the thermal deformations are almost suppressed not only at the centre side of the upper radial member but also at the peripheral sides. The effect can be clearly seen in the obtained displacements, as shown in Table 3. The displacements in Case 3 were drastically reduced in all areas compared with the original case (Case 0). Particularly, the average maximum displacements were decreased from approximately 5mm (in Case 0) to 0.5 mm (in Case 3) at Modules 1 and 3 located at the centre of the LDR, where the electric field strength became the highest. These results indicate that the transition of the footprint of the communication beam on the surface of the earth can be reduced from a range of 60- to 100-km to a range of 5- to 10-km.
Conclusions
A finite element model of the LDR was constructed, and a thermal deformation analysis was performed to investigate the deformation behaviour of the LDR during thermal transition. The displacements occurred in the direction normal to the reflector surface during thermal transition. Moreover, the midpoint of the LDR was confirmed to deform by approximately 5 mm, which explains the phenomena actually observed on the ETS-VIII.
Furthermore, a means to mechanically suppress the thermal deformation was sought out by adjusting the CTE of the structural members and by then controlling spring forces differently in four areas. As a consequence, the thermal deformations at every apex that support the antenna reflector were all suppressed at a high correction rate. These results indicate that the transition of the footprint of the communication beam on the surface of the earth can be reduced from a range of 60- to 100-km to a range of 5- to 10-km.
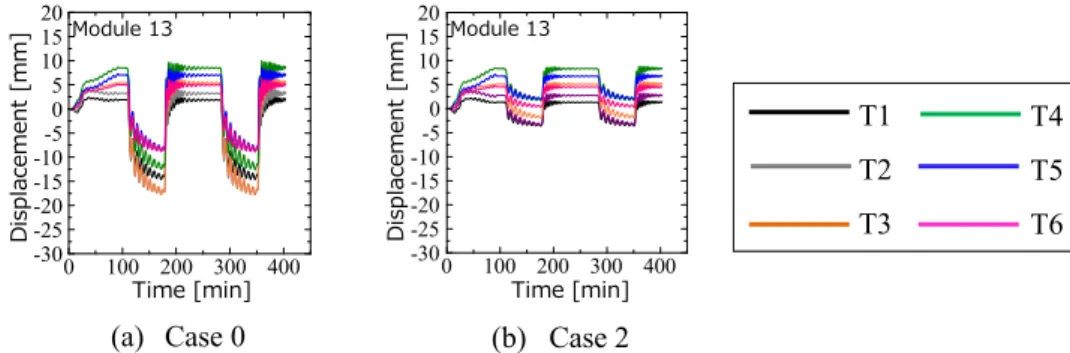
Fig. 14: Suppression effect at the centre side of the upper radial member in Case 2
(a) Case 0 (b) Case 2
Fig. 15: Suppression effect at the peripheral side of the upper radial member in Case 2
(a) Case 0 (b) Case 2
Time [min] Module 13
D
is
pl
ac
em
en
t [
m
m
]
0 100 200 300 400 -30
-25 -20 -15 -10-5 0 5 10 15 20
Time [min]
D
is
pl
ac
em
en
t [
m
m
] Module 13
0 100 200 300 400 -30
-25 -20 -15 -10-5 0 5 10 15 20
Time [min] Module 13
D
is
pl
ac
em
en
t [
m
m
]
0 100 200 300 400 -30
-25 -20 -15 -10-5 0 5 10 15 20
Time [min]
D
is
pl
ac
em
en
t [
m
m
] Module 13
0 100 200 300 400 -30
-25 -20 -15 -10-5 0 5 10 15 20
T4 T5 T6 T1
Boom
Fig. 16: Displacements occurred in direction normal to the reflector surface on the centre side of the upper radial member in Case 3
Time [min] D is pl ac em en t [ m m
] Module 8
0 100 200 300 400 -30 -25 -20 -15 -10-5 0 5 10 15 20 Time [min] D is pl ac em en t [ m m
] Module 7
0 100 200 300 400 -30 -25 -20 -15 -10-5 0 5 10 15 20 Time [min] Di sp la ce m en t [ m m
] Module 9
0 100 200 300 400 -30 -25 -20 -15 -10-5 0 5 10 15 20 Time [min] D is pl ac em en t [ m m
] Module 2
0 100 200 300 400 -30 -25 -20 -15 -10-5 0 5 10 15 20 Time [min] D is pl ac em en t [ m m
] Module 6
0 100 200 300 400 -30 -25 -20 -15 -10-5 0 5 10 15 20 Time [min] Di sp la ce m en t [ m m
] Module 10
0 100 200 300 400 -30 -25 -20 -15 -10-5 0 5 10 15 20 Time [min] D is pl ac em en t [ m m
] Module 3
0 100 200 300 400 -30 -25 -20 -15 -10-5 0 5 10 15 20 Time [min] Di sp la ce m en t [ m m
] Module 1
0 100 200 300 400 -30 -25 -20 -15 -10-5 0 5 10 15 20 Time [min] D is pl ac em en t [ m m
] Module 5
0 100 200 300 400 -30 -25 -20 -15 -10-5 0 5 10 15 20 Time [min] D is pl ac em en t [ m m
] Module 11
0 100 200 300 400 -30 -25 -20 -15 -10-5 0 5 10 15 20 Time [min] D is pl ac em en t [ m m
] Module 4
0 100 200 300 400 -30 -25 -20 -15 -10-5 0 5 10 15 20 Time [min] D is pl ac em en t [ m m
] Module 14
0 100 200 300 400 -30 -25 -20 -15 -10-5 0 5 10 15 20 Time [min] D is pl ac em en t [ m m
] Module 12
0 100 200 300 400 -30 -25 -20 -15 -10-5 0 5 10 15 20 Time [min] D is pl ac em en t [ m m
] Module 13
0 100 200 300 400 -30 -25 -20 -15 -10-5 0 5 10 15 20 T4 T5 T6 T1 T2 T3 Boom
Fig. 17: Displacements occurred in a direction normal to the reflector surface on the peripheral side of the upper radial member in Case 3
Time [min] Module 8 D is pl ac em en t [ m m ]
0 100 200 300 400 -30 -25 -20 -15 -10-5 0 5 10 15 20 Time [min] D is pl ac em en t [ m m
] Module 7
0 100 200 300 400 -30 -25 -20 -15 -10-5 0 5 10 15 20 Time [min] Module 9 D is pl ac em en t [ m m ]
0 100 200 300 400 -30 -25 -20 -15 -10-5 0 5 10 15 20 Time [min] D is pl ac em en t [ m m
] Module 2
0 100 200 300 400 -30 -25 -20 -15 -10-5 0 5 10 15 20 Time [min] Module 6 D is pl ac em en t [ m m ]
0 100 200 300 400 -30 -25 -20 -15 -10-5 0 5 10 15 20 Time [min] Module 10 D is pl ac em en t [ m m ]
0 100 200 300 400 -30 -25 -20 -15 -10-5 0 5 10 15 20 Time [min] Module 3 D is pl ac em en t [ m m ]
0 100 200 300 400 -30 -25 -20 -15 -10-5 0 5 10 15 20 Time [min] D is pl ac em en t [ m m
] Module 1
0 100 200 300 400 -30 -25 -20 -15 -10-5 0 5 10 15 20 Time [min] Module 5 D is pl ac em en t [ m m ]
0 100 200 300 400 -30 -25 -20 -15 -10-5 0 5 10 15 20 Time [min] Module 11 D is pl ac em en t [ m m ]
0 100 200 300 400 -30 -25 -20 -15 -10-5 0 5 10 15 20 Time [min] Module 4 D is pl ac em en t [ m m ]
0 100 200 300 400 -30 -25 -20 -15 -10-5 0 5 10 15 20 Time [min] Module 14 D is pl ac em en t [ m m ]
0 100 200 300 400 -30 -25 -20 -15 -10-5 0 5 10 15 20 Time [min] Module 12 D is pl ac em en t [ m m ]
0 100 200 300 400 -30 -25 -20 -15 -10-5 0 5 10 15 20 Time [min] Module 13 D is pl ac em en t [ m m ]
Table 3: Displacements obtained for each module in each case
Area Module No. Evaluation point Case 0 (mm) Case 1 (mm) Case 2 (mm) Case 3 (mm)
A
8 Centre side 2.4 0.6 2.4 0.6
Peripheral side 0.8 1.1 0.2 0.3
2 Centre side 3.8 1.4 2.7 0.3
Peripheral side 2.2 1.8 0.6 0.2
7 Centre side 2.4 0.7 2.4 0.7
Peripheral side 0.8 1.2 0.2 0.4
B
9 Centre side 5.0 3.0 3.0 0.4
Peripheral side 3.2 3.2 0.9 0.8
3 Centre side 7.7 4.9 3.8 0.4
Peripheral side 6.2 5.3 1.9 0.9
1 Centre side 7.5 4.7 3.7 0.1
Peripheral side 6.1 5.2 1.7 0.8
6 Centre side 4.7 2.9 2.8 0.3
Peripheral side 3.1 3.1 0.6 0.7
C
10 Centre side 10.0 7.3 4.5 0.9
Peripheral side 7.4 7.5 2.6 1.5
11 Centre side 13.8 10.8 5.7 1.8
Peripheral side 10.6 10.9 3.9 2.3
4 Centre side 12.6 9.3 5.2 0.8
Peripheral side 11.2 9.7 3.4 1.7
14 Centre side 13.4 10.5 5.3 1.4
Peripheral side 10.3 10.4 3.5 2.1
5 Centre side 9.3 7.0 3.9 0.6
Peripheral side 7.9 7.3 1.9 1.3
D
12 Centre side 19.6 15.9 7.4 2.4
Peripheral side 15.5 15.9 5.7 3.2
13 Centre side 19.5 15.8 7.2 2.2
References
1. SATOH, M., FUJINO, Y. and ORIKASA, T., “Characterization of large-scale deployable antenna pattern equipped with
engineering test satellite VIII on orbit”, Transactions of the Institute of Electronics, Information and Communication Engineers, IEICE Technical Report, Series B, Vol.J91-B, No.12, 2008, pp.1641–1643 (in Japanese).
2. SATOH, M., ORIKASA, T., FUJINO, Y., KAWASAKI, K., YAMAMOTO, S., MIURA, A. and TAIRA, S., “Beam direction
variation of large-scale deployable reflector antenna on the satellite orbit”, Transactions of the Institute of Electronics, Information and Communication Engineers, IEICE Technical Report, 2010, pp.19-24 (in Japanese).
3. SATOH, M., FUJINO, Y., ORIKASA, T., KOHATA, H., USUI, M. and YAMASA, Y., “Beam direction shift of large-scale
antenna on ETS-VIII during eclipse”, Proceedings of the General Conference of the Institute of Electronics, Information and Communication Engineers, Series 1, 2009, pp.337 (in Japanese).
4. FUJINO, Y., SATOH, M. and ORIKASA, M., “Beam variation of large-scale deployable antenna mounted on satellite in
geostational orbit”, Transactions of the Institute of Electronics, Information and Communication Engineers, IEICE
Technical Report, 2008, pp.15–18 (in Japanese).
5. USUI, M. and ISOBE, D., “Antenna pattern during the earth eclipse and suppression of thermal deformation of the large
deployable reflector of the ETS-VIII”, Proceedings of the Communications Society Conference of the Institute of Electronics, Information and Communication Engineers, Series 1, 2011, pp.309 (in Japanese).
6. USUI, M., WAKITA, K.,KONDO, K., THANH , L. T. T., MATSUI, Y. and ISOBE, D., “Suppression of thermal deformation of
the large deployable reflector”, Transactions of the Japan Society of Mechanical Engineers, Series C, Vol.77, No.777,
![Fig. 8: Applied thermal history Time [min]Temperature [℃]0 100 200 300 400 500-150-100-50050TATB](https://thumb-ap.123doks.com/thumbv2/123deta/6821455.234734/5.892.116.767.474.739/fig-applied-thermal-history-time-min-temperature-tatb.webp)