Design and Functions of
Sheet-Shaped Macromolecules
Shun WAN
A Thesis Presented to
The Graduate University for Advanced Studies
Table of Contents
PAGE LIST OF TABLES... IV LIST OF FIGURES ...V
_Toc128500963CHAPTER 1 GERNERAL INTRODUCTION...1
1-1 Gerneral Introduction ... 1
1-1-1 Review of Covalent Organic Frameworks ...1
1-1-2 Library of Covalent Organic Frameworks ...2
1-2 Scope of This Thesis ... 11
1-3 Scope of This Thesis ...12
CHAPTER 2 A BELT-SHAPED BLUE LUMINESCENT, AND SEMICONDUCTING COVALENT ORGANIC FRAMEWORK ...14
2-1 Abstract ... 15
2-2 Design ... 17
2-3 Synthesis and Characterization of TP-COF ... 17
2-3-1 Synthesis of TP-COF ...17
2-3-2 FT IR Spectral Profiles...17
2-3-3 FE SEM of TP-COF ...19
2-3-4 HR TEM of TP-COF ...21
2-3-5 Experimental PXRD Pattern ...22
2-3-6 Simulation of PXRD Pattern and Crystal Packing...22
2-3-7 Nitrogen Sorption Isotherm Measurement...27
2-3-8 Fluorescence Spectral Profiles ...28
2-3-9 Fluorescence Anisotropy of TP-COF ...31
2-3-10 Semiconducting Property of TP-COF ...31
2.4 Conclusion... 33
2.5 Experimental Section ... 33
2-5-1 Materials...33
2-5-2 Synthesis...34
2-5-3 Measurements...36
3-2 Design of PPy-COF ... 43
3-3 Synthesis and Characterization of PPy-COF ... 43
3-3-1 Synthesis of PPy-COF...43
3-3-2 FT IR Spectral Profiles...43
3-3-3 FE SEM of PPy-COF ...45
3-3-4 HR TEM of PPy-COF ...46
3-3-5 Experimental PXRD Pattern ...47
3-3-6 Simulation of PXRD Pattern and Crystal Packing...48
3-3-7 Nitrogen Sorption Isotherm Measurement...52
3-3-8 Fluorescence Spectral Profiles ...52
3-3-9 Fluorescence Anisotropy of PPy-COF ...55
3-3-10 Semiconducting Property of PPy-COF ...55
3-3-11 Photoconductivity Property of PPy-COF ...57
3-4 Conclusion ... 58
3-5 Experimental Section ...59
3-5-1 Materials...59
3-5-2 Synthesis...59
3-5-3 Measurements...60
3-6 References ... 63
CHAPTER4 ANTHRACENE BASED PHOTO ADDRESSABLE COVALENT ORGANIC FRAMEWORK ...66
4-1 Abstract ... 67
4-2 Design of An-COF ... 68
4-3 Synthesis and Characterization of An-COF ... 68
4-3-1 Synthesis of An-COF ...68
4-3-2 FT IR Spectral Profiles...69
4-3-3 FE SEM of An-COF...72
4-3-4 HR TEM of An-COF...73
4-3-5 Experimental PXRD Pattern ...76
4-3-6 Simulation of PXRD Pattern and Crystal Packing...77
4-3-7 Nitrogen Sorption Isotherm Measurement...81
4-3-8 Fluorescence Spectral Profiles ...82
4-3-9 Fluorescence Anisotropy of An-COF...84
4-3-10 Semiconducting Property of An-COF ...84
4-3-11 Photoconductivity Property of An-COF...85
4-3-12 Crosslink of An-COF ...86
4-4 Conclusion ... 87
4-5 Experimental Section ...87
4-5-1 Materials...87
4-5-2 Synthesis...88
4-5-3 Measurements...89
4-6 References ... 92
CHAPTER5 SUMMARY AND PERSPECTIVES ...94
LIST OF PUBLICATIONS ...98
ACKNOWLEDGEMENT...99
Table 2-2: Refined crystal data 26
Table 2-3: Fractional atomic coordinate 26
Table 3-1: Peak assignments for FT-IR spectrum of PPy-COF 45
Table 3-2: Refined crystal data 51
Table 3-3: Fractional atomic coordinate 51
Table 4-1: Peak assignments for FT-IR spectrum of An-COF. 70
Table 4-2: Refined crystal data 77
Table 4-3: Fractional atomic coordinate 77
List of Figures
PAGE Figure 1-1.Structural representations of (A) COF-1 and (B) COF-5 based on powder diffraction and modeling projected along their c axes (H atoms are omitted). Carbon,
boron, and oxygen are represented as gray, orange, and red spheres, respectively. 5
Figure 1-2.Monomeric subunits of the three dimensional COFs 102, 105, and 108. 7 Figure 1-3.Models of the structures of COFs 102, 105, and 108. 8
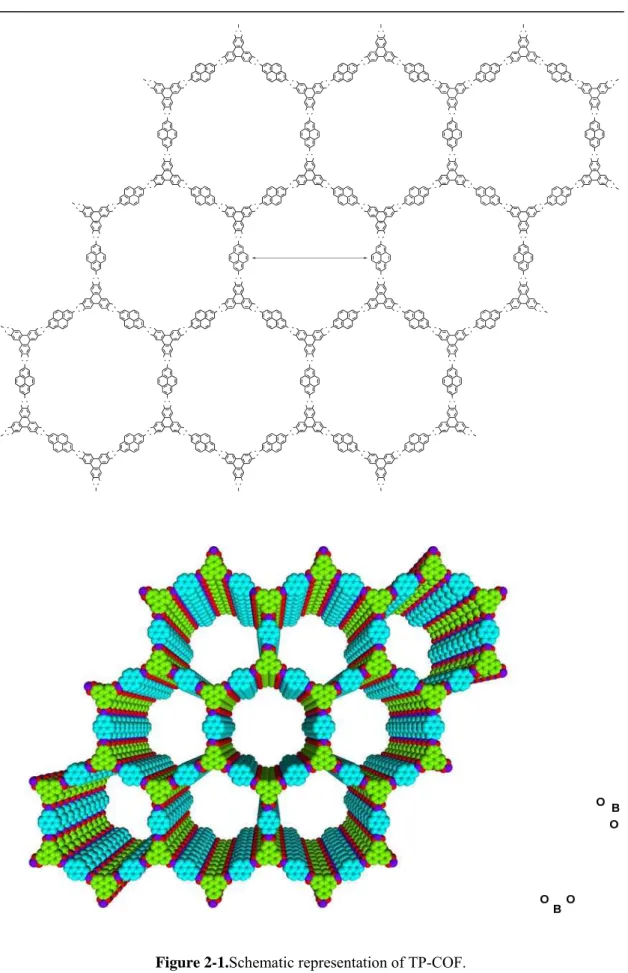
Figure 2-1.Schematic representation of TP-COF. 16
Figure 2-2.FT IR spectra of PDBA, HHTP and TP-COF. The red, blue and black curves are IR spectra of TP-COF, PDBA and HHTP, respectively. 18
Figure 2-3.FE SEM of TP-COF. 20
Figure 2-4.FE SEM of TP-COF. 20
Figure 2-5.HR TEM of TP-COF. 21
Figure 2-6.HR TEM of TP-COF. 22
Figure 2-7.PXRD pattern of TP-COF and simulation of crystal lattice packing in the eclipsed form.In the upper figure, the red curve represents the experimental PXRD pattern and the blue pattern is calculated from the eclipsed crystal packing (Crystal space group P6/mmm; No. 191). The calculated pattern simulates the experimental data well. The insets show the assignment of PXRD signals. The lower figure shows the eclipsed crystal lattice packing of TP-COF. The pore size is 3.26 nm in diameter in the defined structure. 24
Figure 2-8.PXRD pattern of TP-COF and simulation of crystal lattice packing in the staggered form.In the upper figure, the red curve represents the experimental PXRD pattern and the blue pattern is calculated from the staggered crystal packing (Crystal space group P63/mmc; No. 194). The simulated pattern does not fit the experimental data at all. The lower figure shows the staggered crystal lattice packing. In this case, the pore is covered and the pore size is significantly smaller than the experimental one 24 25
Figure 2-9.(a) Nitrogen adsorption (z) and desorption ({) isotherm profiles of TP-COF at 77 K. (b) Pore size distribution of TP-COF by DFT modeling on the N2 adsorption isotherms. 28 Figure 2-10.(a) Fluorescence image of TP-COF. (b) Fluorescence spectra of TP-COF
without TP-COF; blue curve: with TP-COF; red curve: with iodine-doped TP-COF). (b) Electric current when 2-V bias voltage is turned on or off. 32 Figure 2-13. (a) 1H and (b) 13C NMR spectra of PDBA in DMSO-d6. 36
Figure 3-1.Schematic representation of PPy-COF. 42 Figure 3-2.FT IR spectra of PDBA, HHTP and TP-COF. The red, blue and black curves are IR spectra of TP-COF, PDBA and HHTP, respectively. 44
Figure 3-3.FE SEM of PPy-COF. 46 Figure 3-4.HR TEM of PPy-COF. 47 Figure 3-5.PXRD pattern of PPy-COF and simulation of crystal lattice packing in the eclipsed form. In the upper figure, the red curve represents the experimental PXRD pattern and the blue pattern is calculated from the eclipsed crystal packing (Crystal space group P6/mmm; No. 191). The calculated pattern simulates the experimental data well. The insets show the assignment of PXRD signals. The lower figure shows the eclipsed crystal lattice packing of PPy-COF. The pore size is 1.73 nm in diameter in the defined structure. 49
Figure 3-6.PXRD pattern of PPy-COF and simulation of crystal lattice packing in the staggered form.In the upper figure, the red curve represents the experimental PXRD pattern and the blue pattern is calculated from the staggered crystal packing (Crystal space group P63/mmc; No. 194). The simulated pattern does not fit the experimental data at all. The lower figure shows the staggered crystal lattice packing. In this case,
the pore is covered and the pore size is significantly smaller than the experimental one. 49 50
Figure 3-7.(a) Nitrogen adsorption (z) and desorption ({) isotherm profiles of PPy-COF at 77 K. (b) Pore size distribution of TP-COF by DFT modeling on the N2
adsorption isotherms. 52 Figure 3-8.(a) Fluorescence image of PPy-COF. (b) Fluorescence spectra of
PPy-COF upon excitation at 340 nm (black curve) and 376 nm (dotted curve) at 25 °C. 52 53
Figure 3-9.(a) Normalized fluorescence excitation spectra of PDBA (blackcurve) and PPy-COF (red curve). (b) Diffuse reflectance UV-VIS-NIR spectrum of PPy-COF. 54
Figure 3-10.(a) I-V profile of PPy-COF between a 10-µm width Pt gap (black curve: without PPy-COF; blue curve: with PPy-COF; red curve: with iodine-doped
PPy-COF). (b) Electric current when 2-V bias voltage is turned on or off. 56
Figure 3-11.Electric conductivity of PDBA (blue curve) on 10-um width Pt gap electrodes at 25 °C (black curve: electrodes only). 57
Figure 3-12.(a) I-V profile of PPy-COF between sandwich type Al/Au electrodes (black curve: without light irradiation; red curve: upon light irradiation). (b) Photocurrent when light is turned on or off. 58
Figure 4-1.Schematic representation of An-COF. 68
Figure 4-2.FT IR spectra of BTBA, THA and An-COF. The red, blue and black curves are IR spectra of An-COF, BTBA and THA, respectively. 69
Figure 4-3.FE SEM of An-COF. 71
Figure 4-4.FE SEM of An-COF. 72
Figure 4-5.HR TEM of An-COF. 73
Figure 4-6.HR TEM of An-COF. 74
Figure 4-7.HR TEM of An-COF. 75
Figure 4-8.PXRD pattern of An-COF and simulation of crystal lattice packing in the eclipsed form.In the upper figure, the red curve represents the experimental PXRD pattern and the blue pattern is calculated from the eclipsed crystal packing (Crystal space group P6/mmm; No. 191). The calculated pattern simulates the experimental data well. The insets show the assignment of PXRD signals. The lower figure shows the eclipsed crystal lattice packing of TP-COF. The pore size is 2.6 nm in diameter in the defined structure. 78
Figure 4-9.PXRD pattern of An-COF and simulation of crystal lattice packing in the staggered form.In the upper figure, the red curve represents the experimental PXRD pattern and the blue pattern is calculated from the staggered crystal packing (Crystal space group P63/mmc; No. 194). The simulated pattern does not fit the experimental data at all. The lower figure shows the staggered crystal lattice packing. In this case,
the pore is covered and the pore size is significantly smaller than the experimental one
エ ラ ー ! ブ ッ ク マ ー ク が 定 義 さ れ て い ま せ ん 。
79
Figure 4-10.(a) Nitrogen adsorption (z) and desorption ({) isotherm profiles of An-COF at 77 K. (b) Pore size distribution of An-COF by DFT modeling on the N2
spectrum of An-COF. 82 Figure 4-13.(a) I-V profile of An-COF between a 10-µm width Pt gap (black curve: without An-COF; blue curve: with An-COF; red curve: with iodine-doped An-COF). (b) Electric current when 2-V bias voltage is turned on or off. 84 Figure 4-14.(a) I-V profile of An-COF between sandwich type Al/Au electrodes (black curve: without light irradiation; red curve: upon light irradiation). (b) Photocurrent when light is turned on or off. 85 Figure 4-15.Normalized Diffuse reflectance UV-VIS-NIR spectrum of An-COF
(black curve) and An-COF after 5h irradiation under 340nm UV light (red curve). 86 86
Chapter 1
General Introductions
Covalent organic frameworks (COFs) are porous and crystalline macromolecules with well-defined and predictable network architectures of building blocks. Compared with inorganic porous materials, COFs are unique in that they are made from light elements, tunable in skeleton and robust against air and organic solvents. From synthetic point of view, COFs are attractive motifs for the development of designable porous and functional macromolecular materials since they allow, upon topologically flexible design, a total elaborate control over structure parameters including composition and porosity.
Library of Covalent Organic Frameworks
In 2005, Yaghi et al. reported the first example of covalent organic frameworks (COFs)1. In Yaghi’s system, the building blocks for COFs were 1,4-benzenediboronic acid (BDBA) and hexahydroxytriphenylene (HHTP). Under carefully selected reaction conditions, BDBA reacts with itself, and the boronic acid moieties condense to planar boroxine rings (Scheme 1-1)1.
Scheme 1-1.Synthesis of the first example of covalent organic framework, COF-1.
For synthesis of COFs, it seems very important to select proper solvent. In order to form a uniform and highly ordered structure, solvents are chosen wherein the reactants are poorly soluble. Poor solvents will slow down the reversible condensation. Furthermore, the reactions are carried out in sealed pyrex tubes, again to slow down the reversible process and minimize defects by self-healing.
COF-1 was isolated as a microcrystalline substance in high yield. Powder X-ray diffraction patterns reveal a high structural order, whereas single interlayer is stacked in a staggered arrangement (Fig. 1-1A).
Solvent molecules are considered to be enclosed inside the pores and can be readily removed by heating at 200°C under vacuum without the collapse of the crystalline structure.
COF-1 has a surface area of 711 m2 g–1 and a pore volume of 0.32 cm3 g–1.
Scheme 1-2. Synthesis of COF-5.
COF-5 was also synthesized from BDBA and HHTP in high yield under similar reaction conditions (Scheme 1-2)1. The diameter of the pores of COF-5 is 27 Å and the pore has a narrow distribution. These data are supported by the comparison with NLDFT calculations of model compounds. The layers of the crystalline material are stacked in an eclipsed fashion (Fig. 1-1B). The specific surface area is 1590 m2 g–1.
Figure 1-1.Structural representations of (A) COF-1 and (B) COF-5 based on powder diffraction and modeling projected along their c axes (H atoms are omitted). Carbon, boron, and oxygen are represented as gray, orange, and red spheres, respectively.
In 2007, Yaghi and co-workers developed co-condensation reactions of 2,3,6,7,10,11-Hexahydroxytriphenylene (HHTP) and 1,3,5-benzenetriboronic acid (BTBA), 1,3,5-benzenetris(4-phenylboronic acid) (BTPA), and 4,4-biphenyldiboronic acid (BPDA) to prepare COF-6, COF-8, and COF-10, respectively, with chemical
exhibits a Type I isotherm indicative of a microporous material, while COFs-8 and COF-10 display Type IV isotherms, indicating their mesoporosity. Applying the Langmuir model to the appropriate low-pressure regions of the isotherms provided surface areas of 980, 1400, and 2080 m2 g-1 (1049, 968, and 976 m2 cm-3) for COF-6, COF-8, and COF-10, respectively. Pore volumes were estimated to be 0.32, 0.69, and 1.44 cm3 g-1 for COFs-6, -8, and -10, respectively.
Another representative of this material class is COF-18Å, which was synthesized by Lavigne’s group upon condensation of 1,3,5-benzene- triboronic acid (BTBA) and 1,2,4,5-tetrahydroxybenzene (THB)3.
Scheme 1-3. Synthesis of COF-18Å.
Although the reaction conditions (THF/Methanol; reflux) are different from those of the Yaghi’s system, COF-18Å was isolated in excellent yield (Scheme 1-3). This result confirms the concept of slow condensation as a general principle for the generation of highly ordered structures. As the name of the compound suggests, the pore diameter is 18 Å. In comparison with COF-5, COF-18Å has a smaller surface area (1260 m2 g–1) and smaller pore volumes (0.29 cm3 g–1). To verify the stoichiometric incorporation of both monomer reactants into the framework, COF-18Å was degenerated with KOH in deuterated water. A subsequently recorded by 1H NMR spectrum reveals the expected ratio of 3:2 (BTBA/THB)3.
Recently, Yaghi and co-workers extended the networking scope to three-dimensional space4-5. Using tetrahedral tetraboronic acids as precursors, 3D frameworks (COF-102, COF-103, COF-105, and COF-108) resulted from condensation or cocondensation with HHTP (Fig. 1-2 and Fig. 1-3)4.
Figure 1-2.Monomeric subunits of the three dimensional COFs 102, 105, and 108.
Figure 1-3.Models of the structures of COFs 102, 105, and 108.
Although the yields are lower than for the 2D frameworks, the 3D COFs display excellent physicochemical properties. The formation of two different net structures was observed: ctn and bor. Only COF-108 forms the highly porous bor network, and it is, to date, unclear why exclusively this compound crystallizes in the bor structure. The only difference from COF-105 is the central atom of the tetrahedral precursor (Si instead of C). The other three COFs condense in the ctn structure. The COFs 102, 103, and 105 exhibit pore diameters of 8.9, 9.6, and 18.3 Å and densities of 0.41, 0.38, and 0.18 g cm-3, respectively. Because COF-108 crystallizes in the bor structure, two different types of pores are present, with diameters of 15.2 and 29.6 Å. With a density
of 0.17 g cm-3, COF-108 is the crystalline material with the lowest density. The surface areas of COF-102 and COF-103 are 3472 and 4210 m2 g-1, respectively.
The same method of condensing diboronic acids and tetraols was also used by Lavigne and co-workers to COFs6,7. Recently, Lavigne and co-workers utilized triboronic acid and tetraols to build COFs8,9. A very similar approach of polymerization of diboronic acids with fluorene or carbazole subunits had been described by Ding and co-workers three years earlier. Dehydration of the precursor mixture led to stable crosslinked polymers. These polymers emitted blue emission and were tested as materials for organic light-emitting diodes (OLEDs)10.
Recently, Thomas and co-workers demonstrated that it is also possible to access covalent organic frameworks with excellent porous property, which are formed from simple, cheap, and abundant aromatic nitriles11,12.
By the dynamic trimerization reaction in ionothermal conditions13, that is, in molten zinc chloride at high temperature, triazine-based materials with high porosities and surface areas can be obtained that are similar in performance to zeolites, metal-organic frameworks (MOFs), or the covalent boron oxide based frameworks (COFs) (Scheme 1-4).
The polymers were synthesized by heating a mixture of the nitrile and ZnCl2 in quartz ampules at 400°C. The yields of these reactions are close to quantitative.
N N N
N N
N N
N N
N
N N N N
N N
N N
N N N
N N N N N
N
N N
N
CN NC
. . . 400oC
CN
Scheme 1-4. Trimerization of dicyanobenzene in molten ZnCl2 to trimers and oligomers and then to a covalent triazine-based framework (CTF-1).
As measured by nitrogen-sorption experiments, CTF-1 shows a surface area of 791 m2 g-1 with a total pore volume of 0.40 cm3 g-1. These values are close to those found for COF-1 (711 m2 g-1 and 0.32 cm3 g-1)1. From the pore size distribution determined by nonlocal DFT (NLDFT), a pore size of 1.2 nm is found, which is in agreement with the pore size measured from the optimized model of CTF-1. The high thermostabilities of the COFs up to 500°C make these compounds potential candidates for use in industrial processes. The low densities and large surface areas up to 4210 m2 g-1 are also properties suitable for potential applications. Above examples also demonstrate that COFs will be new exciting field of chemistry.
1-2. Scope of This Thesis
As described above, most studies up to date have mainly focused on the development of synthetic methodologies with an aim to optimize pore size and surface area. Thus, the functions of COFs except for gas storage14,15,16 have not yet been well
explored. This motivated us to explore the possibility for constructing functional COFs with novel properties by utilizing highly ordered π-conjugation systems.
In Chapter 2, the author designed the first example of a luminescent and semiconducting COF, utilizing newly synthesized PDBA and HHTP as monomers.
In Chapter 3, the author demonstrated the synthesis of a new π-electronic COF based on self-condensation of pyrene diboronic acid under solvothermal condition (PPy-COF), whose 2D poly(pyrene) sheets align in a perfectly eclipsed fashion. Up to date, self-condensation of boronic acid derivatives has been limited to only one example, i.e., benzene 1,4-diboronic acid, which leads to a COF with staggered alignment of 2D polymer sheets.
In Chapter 4, the author disclosed the design and synthesis of a new type of COF consisting of anthracene building blocks based on the co-condensation of benzene triboronic acid and 2,3,6,7-tetrahydroxy- anthracene under solvothermal or reflux conditions (An-COF).
Based on these researches, the author succeeded in open a new way to polymeric optoelectronics and electronics for large π-electronic organic frameworks.
1-3. Reference
1. A. P. Côté, A. I. Benin, N. W. Ockwig, M. O’Keeffe, A. J. Matzger, O. M. Yaghi, Science 2005, 310, 1166-1170.
O’Keeffe, O. M. Yaghi, Science 2007, 316, 268-272.
5. J. R. Hunt, C. J. Doonan, J. D. LeVangie, A. P. Côté, and O. M. Yaghi, J. Am. Chem. Soc. 2008, 130, 11872-11873.
6. W. Niu, M. D. Smith, J. J. Lavigne, J. Am. Chem. Soc. 2006, 128, 16466-16467. 7. W. Niu, C. O’Sullivan, B. M. Rambo, M. D. Smith, J. J. Lavigne, Chem. common.
2005, 4342-4344.
7. R. W. Tilford, W. R. Gemmill, H. C. zur Loye, J. J. Lavigne, Chem. Mater. 2006, 18, 5296-5301.
8. R. W. Tilford, W. R. Gemmill, H. C. zur Loye, J. J. Lavigne, Chem. Mater. 2006, 18, 5296-5301.
9. R. W. Tilford, S. J. Mugavero III, P. J. Pellechia, J. J. Lavigne, Adv. Mater. 2008, 20, 2741-2746.
10. Y. Li, J. Ding, M. Day, Y. Tao, J. Lu, M. DLiorio, Chem. Mater.2003, 15,4936-4943.
11. P. Kuhn, M. Antonietti, A. Thomas, Angew. Chem. Int. Ed. 2008, 47, 3450-3453. 12. J. Weber, A. Thomas, J. Am. Chem. Soc. 2008, 130, 13333-13337.
13. E. R. Cooper, C. D. Andrews, P. S. Wheatley, P. B. Webb, P. Wormald, R. E. Morris, Nature 2004, 430, 1012-1016.
14. D. M. Rudkevich, Eur. J. Org. Chem. 2007, 3255-3270.
15. S. S. Han, H. Furukawa, O. M. Yaghi, W. A. Goddard III, J. Am. Chem. Soc., 2008, 130, 11580-11581.
16. Y. Li and R. T. Yang, AIChE Journal, 2008, 54, 269-279.
Chapter 2
A Bel t-Shaped, Bl ue Lumi nescent, and
Semi conducti ng
Coval ent Organi c Framework
2-1. Abstract
In this part, the author reports the first example of a luminescent and semiconducting COF (TP-COF), which adopts a belt shape and consists of pyrene and triphenylene functionalities alternatively linked in a mesoporous hexagonal skeleton (Fig. 2-1, TP-COF).
A new family of covalent organic framework based on π electron system was synthesized by condensation polymerization with triphenylene and pyrene derivatives as monomers (TP-COF). TP-COF adopts belt morphology with thickness of about 100 nm, width of about 300 nm, and length of micrometers. When triphenylene and pyrene units were selectively excited by ultraviolet and visible lights, TP-COF displays strong blue fluorescence at 474 nm, as a result of an efficient energy transfer between two units. This result demonstrates that TP-COF collects photons of a wide range covering from ultraviolet to the visible regions and converts them to blue emission efficiently. In addition, due to the ultimate π stacking of large π-conjugated components, TP-COF is electrically semiconducting. The electric current can be repetitively on/off switched without any deterioration. Upon doping with iodine, the electric current was increased remarkably, which suggests that TP-COF is p-type semiconductor.
Figure 2-1.Schematic representation of TP-COF.
2-2. Desi gn of TP-COF
As shown in Figure 2-1, TP-COF was topologically designed by employing a D3h symmetric monomer as corner and a D2h symmetric monomer as edge for pore hexagons and synthesized by a condensation reaction of 2,3,6,7,10,11-hexahydroxytriphenylene (HHTP) and pyrene-2,7-diboronic acid (PDBA).
2-3. Synthesi s and Characteri zati on of TP-COF Synthesi s of TP-COF
In a typical experiment, HHTP (74.58 mg, 0.23mmol) and PDBA (100 mg, 0.345mmol) were mixed in 1,4-dioxane/mesitylene(10mL/10mL) and stirred at 85 °C under Argon for 3 days1. The precipitate was collected by centrifugation, washed with anhydrous acetone, and dried at 150 °C under vacuum to give TP-COF (123 mg) as a pale yellow powder in 90% yield.
FT IR Spectral Profi l es
FT IR spectroscopy shows that vibrational bands due to boronate ester ring appeared at 1345, 1328, 1246 and 1049 cm–1, whereas the hydroxyl bands of the starting materials were strongly attenuated in TP-COF, indicating the condensation of two monomers (Fig. 2-2, Table 2-1).
Transmittanc
4000 3500 3000 2500 2000 1500 1000 500
Wavenumber / cm-1
Figure 2-2.FT IR spectra of PDBA, HHTP and TP-COF. The red, blue and black curves are IR spectra of TP-COF, PDBA and HHTP, respectively.
Peak (cm–1) Assignment and Notes
3395.07 (m) O–H stretch from the end B(OH)2 or OH groups 3037.34 (w) Aromatic C–H stretch from pyrene units
2955.38 (w) 2922.11 (w) 2871.01 (w)
C–H stretching from triphenylene building blocks
1630.3 (w) C=C stretch for fused aromatics. Also observed in HHTP 1525.9 (m) C=C vibrational mode of phenyl ring. Characteristic band 1492.63 (m)
1443.94 (m)
C=C vibrational modes for triphenylene building blocks, Characteristic bands for triphenylene
1344.62 (s) B–O stretch, characteristic band for boroxoles 1328.23 (s) B–O stretch
1245.79 (s) C–O stretch, characteristic for boroxoles 1163.8 (m)
1105.98 (m)
C–H in-plane bending modes
1049.09 (m) B–C stretch 855.28 (m)
832.62 (m)
C–H out-of-plane bending modes for p-substituted aromatic rings
800.80 (m) 716.91 (m) 675.45 (m) 609.88 (w)
C–H out-of-plane bending modes
Table 2-1:Peak assignments for FT-IR spectrum of TP-COF.
FE SEM of TP-COF
FE SEM images of TP-COF reveal that the condensation polymerization of PDBA and HHTP afford belts with length extended to micrometers and width of about 300 nm and thickness of 100 nm (Fig. 2-3). A close examination shows no other morphologies are observable (Fig. 2-4).
Figure 2-3.FE SEM of TP-COF.
Figure 2-4.FE SEM of TP-COF. HR TEM of TP-COF
To further investigate the structure, high resolution TEM was performed. As shown in Figure 2-5, clear aligned patterns were observed along the (110) facet. From the aligned layer structure, the distance between sheets is estimated to be 3.40 Å, which is reasonable for π-π stacking. Such a belt texture with a uniform morphology and the direct visualization of a stacked sheet structure are unprecedented for COFs. To our surprise, along the (001) facet, hexagonal mesostructure can be observed and enables the estimation of center-to-center distance between the neighbouring pores to be about 3.3 nm (Fig. 2-6).
Figure 2-5.HR TEM of TP-COF.
Figure 2-6.HR TEM of TP-COF.
Experi mental PXRD Pattern
Powder x-ray diffraction (PXRD) exhibits a main diffraction peak due to 100 at 2.70°, along with diffractions owing to 110, 200, 210, 300, 310, and 001 at 4.74°, 5.46°, 7.26°, 8.24°, 9.54° and 26.32°, respectively (Fig. 2-7, red curve).
Si mul ati on of PXRD Pattern and Crystal Packi ng
To elucidate the lattice packing, we first carried out semi-empirical calculation at PM3 level to optimize the geometry of the whole pore unit structure and further optimized the molecular geometry of the repeating unit in the single unit cell at
B3LYP/6-31G(d) by using Gaussian 03 program2. Final lattice parameters were determined after performing Pawley refinement by using Reflex, a software package for crystal structure determination from the PXRD pattern, implemented in MS modelling (ver4.2)3. Simulation using the space group of P6/mmm (No. 191) with a = b
= 37.5412 Å and c = 3.3784 Å gives a PXRD pattern in good agreement with the experimentally observed one (Fig. 2-7). All the diffraction peaks can be reasonably assigned. On the other hand, a staggered model using the space group of P63/mmc (No. 194) does not reproduce the experimental PXRD pattern (Fig. 2-8). Therefore, the 2-D sheets crystallize in an eclipsed fashion to give a perfect superimposition of the triphenylene and pyrene units on themselves (Fig. 2-1, Fig. 2-7). Such a crystalline structure would provide open and aligned mesopores of 3.26 nm in diameter (Fig. 2-7).
Figure 2-7.PXRD pattern of TP-COF and simulation of crystal lattice packing in the eclipsed form. In the upper figure, the red curve represents the experimental PXRD pattern and the blue pattern is calculated from the eclipsed crystal packing (Crystal space group P6/mmm; No. 191). The calculated pattern simulates the experimental data well. The insets show the assignment of PXRD signals. The lower figure shows the eclipsed crystal lattice packing of TP-COF. The pore size is 3.26 nm in diameter in the defined structure.
Figure 2-8.PXRD pattern of TP-COF and simulation of crystal lattice packing in the staggered form. In the upper figure, the red curve represents the experimental PXRD pattern and the blue pattern is calculated from the staggered crystal packing (Crystal space group P63/mmc; No. 194). The simulated pattern does not fit the experimental data at all. The lower figure shows the staggered crystal lattice packing. In this case, the pore is covered and the pore size is significantly smaller than the experimental one.
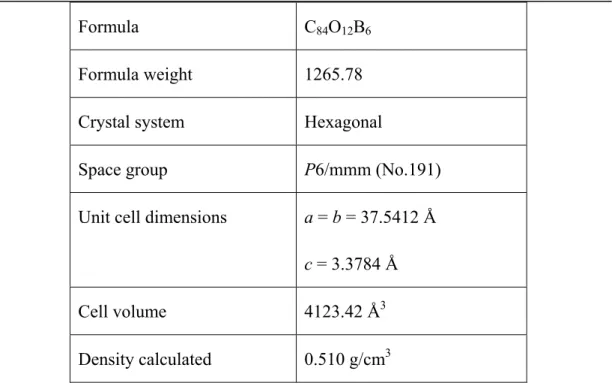
Space group P6/mmm (No.191) Unit cell dimensions a = b = 37.5412 Å
c = 3.3784 Å
Cell volume 4123.42 Å3
Density calculated 0.510 g/cm3
Table 2-2: Refined crystal data
Atom Wyck. x y z
C1 12q 0.29457 0.62814 0.50000
C2 12q 0.33388 0.59643 0.50000
C3 12q 0.37097 0.59167 0.50000
O4 12q 0.37899 0.55964 0.50000
C7 12q 0.42428 0.51126 0.50000
C8 12q 0.44513 0.48902 0.50000
C10 12q 0.42390 0.44477 0.50000
B5 6m 0.42181 0.57819 0.50000 C6 6m 0.44552 0.55448 0.50000 C9 6m 0.48905 0.51095 0.50000
Table 2-3: Fractional atomic coordinate
Ni trogen Sorpti on Isotherm Measurement
We carried out nitrogen sorption isotherm measurement to investigate the porosity of TP-COF. As shown in Figure 2-9a, TP-COF exhibits a typical type IV nitrogen sorption curve, indicative of a mesoporous character4. BET calculation gives specific surface area and pore volume of 868 m2 g–1 and 0.7907 cm3 g–1, respectively. Estimation of pore size with the DFT model shows a diameter of 3.14 nm (Fig. 2-9b), which is close to the theoretical one. Pore distribution profile exhibits that in TP-COF the specific surface area originates predominately from the persistent mesopores, whereas contribution of other pores formed between belts or from defects are small (Fig. 2-9b). All the above results indicate that TP-COF is a crystalline material with a uniformly sized mesopore formed via the eclipsed packing of the polymeric sheets.
300
200
100 Va (cm3 gŠ1 ; STP)
1.0 0.8 0.6 0.4 0.2 0.0
P/P0
0.04 0.03 0.02 0.01 0.00 dVp (cm3 g
50 40 30 20 10
Pore Width (nm)
Figure 2-9.(a) Nitrogen adsorption (z) and desorption ({) isotherm profiles of TP-COF at 77 K. (b) Pore size distribution of TP-COF by DFT modeling on the N2 adsorption isotherms.
Fl uorescence Spectral Profi l es
Fluorescence microscopy exhibits that the belts of TP-COF are highly blue luminescent (Fig. 2-10a). Condensed poly(boronate ester)s bearing fluorene units have been reported to be blue-emissive materials5,6. Fluorescence spectroscopy shows that TP-COF emitted a luminescence at 474 nm, upon excitation of the pyrene units at 376 or 417 nm (Fig. 2-10b, dotted curve). On the other hand, when a solid sample of HHTP monomer was excited at 340 nm, it emitted fluorescence at 402 nm with a shoulder at 424 nm. Since this emission is partially overlapped with the absorption band of the pyrene, the triphenylene units in TP-COF have a chance to communicate photochemically with the pyrene moieties by energy transfer from the excited state. Excitation of the triphenylene units in TP-COF at 340 nm resulted in negligibly weak emission at 402 nm from the triphenylene units but a strong emission from the pyrene
moieties at 474 nm (Fig. 2-10b, black curve), where the fluorescence intensity ratio I474 nm/I402 nm was as high as 16.
Figure 2-10.(a) Fluorescence image of TP-COF. (b) Fluorescence spectra of TP-COF upon excitation at 340 nm (black curve) and 376 nm (dotted curve) at 25 °C.
In sharp contrast, when a 2:3 solid mixture of HHTP and PDBA was excited at 340 nm, it emitted predominately at 402 nm to furnish a low I474 nm/I402 nm ratio (0.6). Therefore, the strong pyrene fluorescence, observed for TP-COF upon 340 nm excitation, is obviously due to an intramolecular singlet energy from the triphenylene units to pyrene units. Comparison of the excitation spectrum with diffuse reflectance UV-Vis spectrum (Kubelka-Munk spectrum; Fig. 2-11), the quantum yield of energy transfer was estimated to be 60%. Therefore, by virtue of the triphenylene units, TP-COF can harvest photons of a wide wavelength range covering from ultraviolet to visible regions and converts them to blue emission.
Figure 2-11.(a) Normalized fluorescence excitation spectra of PDBA (blue curve), HHTP (black curve) and TP-COF (red curve). (b) Diffuse reflectance UV-VIS-NIR spectrum of TP-COF.
Fl uorescence Ani sotropy of TP-COF
Along this line, we further investigated the fluorescence anisotropy of TP-COF upon excitation with a polarized light. When a chromophore with a restricted Brownian motion is excited by a polarized light, it emits a polarized fluorescence. However, the fluorescence should be depolarized when the excitation energy migrates randomly within the lifetime of the excited state. Here, fluorescence anisotropy (p) is defined by (I⎢⎢ – GI⊥)/(I⎢⎢ + GI⊥), where I⎢⎢ and I⊥ are fluorescence intensities of parallel and perpendicular components relative to the polarity of the excitation light, respectively, where G is an instrumental correction factor. The 2:3 solid mixture of HHTP and PDBA shows a p value of 0.058. In sharp contrast, TP-COF under identical conditions exhibited a significantly depolarized fluorescence with an extremely low p value of 0.017. This observation reveals that TP-COF not only mediates energy transfer between components but facilitates energy migration over the crystalline belt as well.
Semi conducti ng Property of TP-COF
Single crystals of pyrene and triphenylene have been reported to function as semiconductor7,8. Due to the ultimate π-stacking of these large π-conjugated components, TP-COF may have a high probability of becoming electrically semiconductive. We investigated this possibility by measuring the electric conductivity
current can be on/off switched repeatedly for many times without significant deterioration (Fig. 2-12b). The relatively high electric current observed for TP-COF is likely related to the highly order structure that enables the formation of a conductive path. Upon doping with iodine, the electric current was increased (Fig. 2-12a, red curve), suggesting a p-type semiconductor character of TP-COF.
(a) (b)
-20 -10 0 10 20
Current (nA)
-2 -1 0 1 2
Voltage (V)
4
3
2
1
0
Current (nA)
10 8 6 4 2 0
Time (min)
Figure 2-12.(a) I-V profile of TP-COF between a 10-µm width Pt gap (black curve: without TP-COF; blue curve: with TP-COF; red curve: with iodine-doped TP-COF). (b) Electric current when 2-V bias voltage is turned on or off.
2-4. Concl usi on
Exploration of functional COFs is a subject with a high probability to the development of new materials. In summary, the author demonstrated the synthesis of a new COF based on the condensation reaction of triphenylene and pyrene monomers. TP-COF is highly luminescent, harvests a wide wavelength range of photons and allows energy transfer and migration. Furthermore, TP-COF is electrically conductive and capable of repetitive on-off current switching at room temperature. These characters are unique and clearly originate from the highly ordered structure of TP-COF. By filling the mesopores with photoactive molecules such as electron acceptor, it will lead to the fabrication of COF-based optoelectronic device, which is one of the targets worthy of further investigation.
2-5. Experi mental Secti on Materi al s
THF was distilled over benzophenoneketyl under argon before use. Cyclohexane was distilled under argon before use. Pyrene, bispinacolatodiboron, anhydrous 1,4-dioxane (99.8%) and anhydrous acetone (99.8%) were purchased from Wako Chemicals. 2,3,6,7,10,11- hexahydroxytriphenylene (HHTP) and mesitylene (98%) were purchased from TCI. 4,4’-Di-tert-butyl-2,2’-bipyridine was purchased from
2-1).
Synthesi s
All reactions were performed under argon using Schlenk line technique.
PDBA: A THF/water mixture (60 mL, 4/1 in vol.) of pyrene-2,7-diboronic ester (1g,
2.21 mmol) and sodium periodate (2.84 g, 13.25 mmol) was stirred for 30 min and was added with aqueous hydrochloric acid (1N, 3.1 ml, 3.1 mmol). The reaction mixture was stirred at room temperature overnight, diluted with water (30 ml) and extracted with ethyl acetate (3 × 50 ml). The combined extracts were washed with water (3 × 30 ml) and brine (30 ml), dried over sodium sulfate, filtered, and concentrated to dryness. The solid residue after rinsed with small portions of hexane gave PDBA as brown solid in 98% yield (638 mg)10.
B
B O O
O O
B
B OH HO
OH HO Cyclohexane, 80oC, 16h
[Ir(OMe)COD]2, dtbpy, n(B2pin2)
THF/H2O, r.t., overnight NaIO4, 1N-HCl
[Ir(OMe)COD]2=
dtbpy =
n(B2pin2) = OB B
O O
O IrOIr
O Me
Me
Scheme.2-1.Syntheses of Pyrene-2,7-diboronic ester and PDBA.
1H NMR (400 MHz, DMSO-d6): δ ppm 8.68 (4H, s, 1,3,6,7-H-pyrene), 8.44 (4H, s, 4,5,9,10-H-pyrene), 8.16 (4H, s, BO–H)(Shown in Fig. 2-13a).
13C NMR (100 MHz, DMSO-d6): δ ppm 130.80, 130.03, 127.44, 124.95.
MALDI–TOF MS for C16H12B2O4 (Cacld.290.0922), m/z = 290.2092 ([M + H]+) (Shown in Fig. 2-13b).
Figure 2-13.(a) 1H and (b) 13C NMR spectra of PDBA in DMSO-d6.
TP-COF: A 1,4-dioxane/mesitylene mixture (20 mL, 1/1 in vol.) of PDBA (100 mg,
0.345 mmol) and HHTP (74.58 mg, 0.23 mmol) was stirred at 85 °C for 3 days under argon. The precipitate was collected by centrifugation, washed with anhydrous acetone and dried at 150 °C under vacuum to give TP-COF (123 mg) as a pale yellow powder in 90% yield.
Measurements
1H and 13C NMR spectra were recorded on JEOL models JNM–LA400 or
JNM–LA500 NMR spectrometers, where chemical shifts (δ in ppm) were determined with a residual proton of the solvent as standard. Infrared (IR) spectra were recorded on a JASCO model FT IR–6100 Fourier transform infrared spectrometer. UV-Vis-IR diffuse reflectance spectrum (Kubelka-Munk spectrum) was recorded on a JASCO model V-670 spectrometer equipped with integration sphere model IJN-727. Matrix–assisted laser desorption ionizationtime–of–flight mass (MALDI–TOF–MS)
spectra were recorded on an Applied Biosystems BioSpectrometry model Voyager–DE–STR spectrometer in reflector or linear mode using 9–nitroanthracene or dithranol as matrix. Field emissionscanning electron microscopy (FE SEM) was performed on a JEOL model JSM–6700 FE–SEM operating at an accelerating voltage of 1.5 or 5.0 kV. The sample was prepared by drop–casting an acetone suspension onto mica substrate and then coated with gold. Transmission Electron Microscope (TEM) images were obtained on a JEOL model JEM–3200 microscope. The sample was prepared by drop–casting an acetone suspension of TP-COF onto a copper grid. Powder X–ray diffraction (PXRD) data were recorded on a Rigaku model RINT Ultima III diffractometer by depositing powder on glass substrate, from 2θ = 1.5° up to 60° with 0.02° increment at 25°C.
Nitrogen sorption isotherms were measured at 77 K with a Bel Japan Inc. model BELSORP-mini II analyzer. Before measurement, the samples were degassed in vacuum at 200 °C for more than 6h. The Brunauer-Emmett-Teller (BET) method was utilized to calculate the specific surface areas. By using density functional theory (DFT) model, the pore volume was derived from the sorption curve.
Electrical measurements were carried out at 25 °C in air on TP-COF or I2-doped TP-COF between 10-µm width Pt electrodes by a two-probe method using a Keithley model 2635 sourcemeter. TP-COF was homogenously dispersed in acetone and casted onto the electrode to give a film. For I2 doping, the TP-COF electrode was put into an I2
2. Gaussian 03, Revision C.02, Frisch, M. J.; Trucks, G. W.; Schlegel, H. B.; Scuseria, G. E.; Robb, M. A.; Cheeseman, J. R.; Montgomery, Jr., J. A.; Vreven, T.; Kudin, K. N.; Burant, J. C.; Millam, J. M.; Iyengar, S. S.; Tomasi, J.; Barone, V.; Mennucci, B.; Cossi, M.; Scalmani, G.; Rega, N.; Petersson, G. A.; Nakatsuji, H.; Hada, M.; Ehara, M.; Toyota, K.; Fukuda, R.; Hasegawa, J.; Ishida, M.; Nakajima, T.; Honda, Y.; Kitao, O.; Nakai, H.; Klene, M.; Li, X.; Knox, J. E.; Hratchian, H. P.; Cross, J. B.; Bakken, V.; Adamo, C.; Jaramillo, J.; Gomperts, R.; Stratmann, R. E.; Yazyev, O.; Austin, A. J.; Cammi, R.; Pomelli, C.; Ochterski, J. W.; Ayala, P. Y.; Morokuma, K.; Voth, G. A.; Salvador, P.; Dannenberg, J. J.; Zakrzewski, V. G.; Dapprich, S.; Daniels, A. D.; Strain, M. C.; Farkas, O.; Malick, D. K.; Rabuck, A. D.; Raghavachari, K.; Foresman, J. B.; Ortiz, J. V.; Cui, Q.; Baboul, A. G.; Clifford, S.; Cioslowski, J.; Stefanov, B. B.; Liu, G.; Liashenko, A.; Piskorz, P.; Komaromi, I.; Martin, R. L.; Fox, D. J.; Keith, T.; Al-Laham, M. A.; Peng, C. Y.; Nanayakkara, A.; Challacombe, M.; Gill, P. M. W.; Johnson, B.; Chen, W.; Wong, M. W.; Gonzalez, C.; and Pople, J. A.; Gaussian, Inc., Wallingford CT, 2004.
3. Accelrys, Material Studio Release Notes, Release 4.2, Accelrys Software, San Diego 2006.
4. K. M. Sing, D. H. Everett, R. A. W. Haul, L. Moscou, R. A. Pierotti, J. Rouquerol, T. Siemieniewska, Pure & Appl. Chem.1985, 57, 603-619.
5. W. Niu, M. D. Smith, J. J. Lavigne, J. Am. Chem. Soc. 2006, 128, 16466-16467. 6. Y. Li, J.Ding, M, Day, Y. Tao, J. Lu, M. D’iorio, Chem. Mater. 2003, 15,
4936-4943.
7. J. M. Warman, M. P. de Haas, G. Dicker, F. C. Grozema, J. Piris, M. G. Debije, Chem. Mater. 2004, 16, 4600-4609.
8. J. G. Basurto, Z. Burshtein, Mol. Cryst. Liq. Cryst.1975, 31, 211-217.
9. D. N. Coventry, A. S. Batsanov, A. E. Goeta, J. A. K. Howard, T. B. Marder and R. N. Perutz, Chem. Commun. 2005, 2172-2174.
10. C. C. Tzschucke, J. M. Murphy and J. F. Hartwig, Org. Lett. 2007, 9, 761-764.
Chapter 3
A Pol ypyrene–Based Bl ue-Lumi nescent,
Semi conducti ng and Photoconducti ve
Coval ent Organi c Framework
3-1. Abstract
Up to date, among boronic ester based COFs, co-condensation of boronic acid with phenol derivatives has been demonstrated for the synthesis of various boronic ester-based COFs1–6. However, self-condensation of boronic acid derivatives has been limited to only one example1, i.e., benzene 2,7-diboronic acid, which leads to a COF with staggered alignment of 2D polymer sheets.
Herein, the author reports the self-condensation of pyrene diboronic acid to form a new π-electronic COF with polypyrene building blocks (PPy-COF; Fig.3-1). In contrast to the benzene analogue that gives a staggered structure, PPy-COF is unique in that it allows a perfectly eclipsed alignment of 2D polypyrene sheets (Fig. 3-1) to give a micrometer-scale molecular cube. PPy-COF was synthesized by self-condensation polymerization of pyrene diboronic acid (Fig.3-1, PPy-COF). FE SEM shows pure cubic morphology, while HR TEM reveals stacked layers with a separation of about 3.4 Å. Powder X-ray diffraction measurement together with quantum calculation indicates that PPy-COF has a lattice structure with P6/mmm space group, where the hexagonal sheets are crystallized in an eclipsed fashion. Nitrogen sorption isotherm measurement shows microporous characters with a pore diameter of 1.88 nm and a large specific area surface. Upon excitation of pyrene units, PPy-COF emits a strong blue luminescence at 484 nm. Significantly depolarized fluorescence anisotropy suggests that the excitation energy is not localized but migrate over the framework. PPy-COF is semiconducting
B
OB BOB
O O OB B O
B B
B B
O O
BO OB
O O
OBO OB BO
OBO
B
B B
B
B B
O BOB
O O
B
O BO O OBO
O BO
OBO
BO O BO
B
OB B OBO BO
OBO
B OBO
OB B
B O BO
O
B
OB BOB
O O OB B O
B B
B O O
BO OB
O O
BO OBO B
B
OB BOB
O
OB B OBO OB
O
B B
B B
1.728 nm
Figure 3-1.Schematic representation of PPy-COF.
3-2. Desi gn of PPy-COF
PPy-COF was designed with a trimerization system of a D2h monomer and synthesized by self-condensation of pyrene 2,7-diboronic acid (PDBA) under solvothermal condition.
3-3. Synthesi s and Characteri zati on of PPy-COF Synthesi s of PPy-COF
As a typical example, a 1,4-dioxane/mesitylene(2.5mL/2.5mL) mixture of PDBA (25.0 mg) in a 10-mL pyrex tube was degassed by three freeze-pump-thaw cycles. Then the tube was sealed, kept in autoclave and heated at 120 °C for 2 days. The precipitate was collected by centrifugation, washed with anhydrous acetone, and dried at 150 °C under vacuum, to give PPy-COF (22 mg) in 88% yield as pale yellow solid3.
FT IR Spectral Profi l es
FT IR spectroscopy shows that vibrational bands due to boronate ester ring appeared at 1381, 1339, 1240 and 1048 cm–1, whereas the hydroxyl bands of the starting materials were strongly attenuated in PPy-COF, indicating the self-condensation of PDBA (Fig. 3-2, Table 3-1).
Transmitta
4000 3500 3000 2500 2000 1500 1000 500
Wavenumber (cm-1)
Figure 3-2.FT IR spectra of PDBA (black curve) and PPy-COF (red curve).
Peak (cm–1) Assignment and Notes
3369.51 (m) O–H stretch from the end B(OH)2 or OH groups of PPy-COF. 3036.37 (w) Aromatic C–H stretch from pyrene unit.
2953.45 (w) 2922.11 (w) 2867.15 (w)
C–H stretching frommesitylene guest molecule.
1604.00 (w) C=C stretch for fused aromatics.
1588.57 (m) C=C vibrational mode of phenyl ring of pyrene unit. 1458.89 (m) C=C vibrational modes for p-substituted pyrene unit. 1380.78 (s) B–O stretch, characteristic band for boroxoles. 1339.32 (s) B–O stretch, characteristic band for boroxoles. 1316.66 (s) C–C stretch, characteristic for boroxoles.
1239.52 (m) C–O stretch, characteristic for boroxoles. 1143.58 (w)
1109.35 (w)
C–H in-plane bending modes.
1047.64 (m) B–C stretch. 998.46 (m)
893.36 (m)
C–H out-of-plane bending modes for p-substituted aromatic rings.
798.39 (m) 721.73 (m) 700.03 (w) 609.88 (w)
C–H out-of-plane bending modes
Table 3-1: Peak assignments for FT-IR spectrum of PPy-COF.
FE SEM of PPy-COF
FE SEM shows that PPy-COF assumes cubic shape, while no any other morphologies such as belt, fiber, sphere, or rod are present (Fig.3-3). Close checks at high magnification confirm that the cubes are in micrometer scale with similar dimension.
Figure 3-3.FE SEM of PPy-COF.
HR TEM of PPy-COF
HR TEM along 110 facet reveals the aligned 2D polymer sheets with face-to-face distance of about 3.4 Å (Fig.3-4), which is reasonable for π-π stack. These observations indicate that self-condensation of PDBA under solvothermal condition allows the formation of cube-like COF consisting of well-aligned polypyrene sheets.
Figure 3-4.HR TEM of PPy-COF.
Experi mental PXRD Pattern
PXRD measurement of PPy-COF displays a main peak at 4.6° due to 100 diffraction together with minor peaks at 9.3, 12.2 and 26.2° due to 200, 210, 001 diffractions, respectively (Fig.3-5, red curve).
calculation with Gaussian 03. Rev. C01 at PM3 level to optimize the geometry of pore unit structure and then performed molecular modeling and Pawley refinement by using Reflex, a software package for crystal structure determination from the PXRD pattern, implemented in Materials Studio modeling version 4.27. Simulation using P6/mmm space group with a = b = 22.16295(838) Å and c = 3.42066(165) Å results in a PXRD pattern (blue curve) that is in good agreement with the experimentally observed one (Fig. 3-5). On the other hand, simulation with P63/mmc space group gives a staggered alignment of 2D polymer sheets, where the calculated PXRD does not reproduce the experimental one (Fig. 3-6). Therefore, the 2D polypyrene sheets lay along c axis in a perfectly eclipsed fashion, with all vertices and edges superimposed on those from neighbouring sheet (Fig. 3-5), thus leaving aligned tubular channels with a pore diameter of 1.73 nm (Fig. 3-5).
Figure 3-5.PXRD pattern of PPy-COF and simulation of crystal lattice packing in the eclipsed form. In the upper figure, the red curve represents the experimental PXRD pattern and the blue pattern is calculated from the eclipsed crystal packing (Crystal space group P6/mmm; No. 191). The calculated pattern simulates the experimental data well. The insets show the assignment of PXRD signals. The lower figure shows the eclipsed crystal lattice packing of PPy-COF. The pore size is 1.73 nm in diameter in the defined structure.
Figure 3-6.PXRD pattern of PPy-COF and simulation of crystal lattice packing in the staggered form. In the upper figure, the red curve represents the experimental PXRD pattern and the blue pattern is calculated from the staggered crystal packing (Crystal space group P63/mmc; No. 194). The simulated pattern does not fit the experimental data at all. The lower figure shows the staggered crystal lattice packing. In this case, the pore is covered and the pore size is significantly smaller than the experimental one.
Formula C48H24B6O6 Formula weight 761.58 Crystal system Hexagonal
Space group P6/mmm (No.191)
Unit cell dimensions a = b = 22.16295(838) Å c = 3.42066(165) Å
Cell volume 1453.12 Å3
Density calculated 0.869 g/cm3
Table 3-2: Refined crystal data
Atom Wyck. x y z
C1 12q 0.14521 0.62588 1/2
C2 12q 0.07328 0.59117 1/2
C3 12q 0.03489 0.62661 1/2
H4 12q 0.17408 0.68527 1/2
H5 12q 0.06339 0.68600 1/2
B6 6m 0.26177 0.63088 1/2
C7 6m 0.18206 0.59103 1/2
C8 6m 0.03650 0.51825 1/2
C9 6m 0.29791 0.59581 1/2
Table 3-3: Fractional atomic coordinate
to be 923 m2g–1 and the pore width was 1.88 nm calculated by NLDFT method (Fig. 3-7b), which is consistent with the theoretical one. These results indicate that PPy-COF is super microporous crystalline macromolecule with eclipsed alignment of polypyrene sheets.
350 300 250 200 150 100 50 Va (cm3 g-1 , STP)
1.0 0.8 0.6 0.4 0.2 0.0
P / P0
1.0 0.8 0.6 0.4 0.2 0.0
dVp/ddp (a. u.)
12 8
4
dp / nm
0.6 0.5 0.4 0.3 0.2 0.1 0.0
Cummulative pore volume (cm 3g -1)
(a) (b)
1.88 nm
Figure 3-7.(a) Nitrogen adsorption (z) and desorption ({) isotherm profiles of PPy-COF at 77 K. (b) Pore size distribution of PPy-COF by DFT modeling on the N2 adsorption isotherms.
Fl uorescence Spectral Profi l es
Fluorescence microscopy shows that PPy-COF is highly blue luminescent (Fig. 3-8a). Condensed poly(boronate ester)s bearing fluorene units have been reported as blue-emissive materials9,10. Fluorescence spectroscopy displays that upon excitation at 414 nm, PPy-COF emits a strong fluorescence at 484 nm (Fig. 3-8b, red curve). A control experiment with the simple solid of PDBA shows that the monomer unit gives
fluorescence centered at 421 nm (black curve). Therefore, the fluorescence of PPy-COF most likely originates from excimer, as a result of close packing of pyrene building blocks. The fluorescence quantum yield was evaluated to be about 5.8%, which is comparable to the reported value of pyrene (6.8%)11.
Fluorescence Intensity (a. u.)
650 600 550 500 450 400
Wavelength (nm)
(a) (b)
5 µm
Figure 3-8.(a) Fluorescence image of PPy-COF. (b) Normalized fluorescence spectra of PPy-COF (red curve) and PDBA (black curve) upon excitation at 414 nm at 25 °C.
We also measured the excitation spectrum with diffuse reflectance UV-Vis spectrum of PPy-COF (Kubelka-Munk spectrum; shown in Fig. 3-9).
Intensity (a. u.)
450 400
350 300
250
Wavelength (nm)
0.9
0.8
0.7
0.6
0.5
0.4
0.3
0.2
Absorbance
1200 1000
800 600
400
Wavelength (nm) (b)
Figure 3-9.(a) Normalized fluorescence excitation spectra of PDBA (black curve) and PPy-COF (red curve). (b) Diffuse reflectance UV-VIS-NIR spectrum of PPy-COF.
Fl uorescence Ani sotropy of PPy-COF
Along this line, we further investigated the fluorescence anisotropy of PPy-COF upon excitation with a polarized light. When a chromophore with a restricted Brownian motion is excited by a polarized light, it emits a polarized fluorescence. However, the fluorescence should be depolarized when the excitation energy migrates randomly within the lifetime of the excited state. Here, fluorescence anisotropy (p) is defined by (I⎢⎢ – GI⊥)/(I⎢⎢ + GI⊥),, where I⎢⎢ and I⊥ are fluorescence intensities of parallel and perpendicular components relative to the polarity of the excitation light, respectively, where G is an instrumental correction factor. PDBA shows a p value of 0.018. In sharp contrast, PPy-COF under identical conditions exhibited a significantly depolarized fluorescence with an extremely low p value of 0.001. This observation reveals that the excitation energy is not localized but can migrate over the framework.
Semi conducti ng Property of PPy-COF
The ultimate π-stacking of pyrene building blocks in PPy-COF may have a high probability of becoming electrically semiconducting12. We measured the electrical conductivity by using a two-probe method across a 10-µm-width Pt gap. PPy-COF displays an almost linear I–V profile in air at 25 °C (Fig. 3-10a, blue curve), while the gap itself is silent, irrespective of voltage bias (Fig. 3-10a, black curve). In contrast, PDBA shows a low current under otherwise identical conditions (Fig. 3-11). Much