Obesity pandemic, correlated factors and guidelines
to define, screen and manage obesity in Taiwan
W.-H. Pan1,2,3, M.-S. Lee4, S.-Y. Chuang1, Y.-C. Lin5and M.-L. Fu6
1Institute of Biomedical Sciences, Academia Sinica, Taipei, Taiwan;2Institute of Microbiology and Biochemistry, National Taiwan University, Taipei, Taiwan;3Institute of Epidemiology, College of Public Health, National Taiwan University, Taipei, Taiwan;
4School of Public Health, National Defense Medical Center, Taipei, Taiwan;5School of Nutrition, Chung Shan Medical University, Taichung, Taiwan;6Department of Food Nutrition, Chung Hwa University of Medical Technology, Tainan, Taiwan
Address for correspondence: W-H Pan, No. 128, Section 2, Academia Road, Taipei, Taiwan. E-mail: pan@ibms.sinica.edu.tw
Summary
The prevalence of obesity and associated chronic diseases has increased rapidly in Taiwan. Data from three consecutive Nutrition and Health surveys in Taiwan show that obesity prevalence has tripled for elementary school boys and doubled for girls since 1993–1996. About one-third of boys (15.5% and 14.7% for overweight and obesity, respectively) and one-quarter of girls were either over- weight (14.4%) or obese (9.1%) in 2001–2002. For adults, obesity prevalence rates defined by body mass index ⱖ27 kg m-2increased from 10.5% in men and 13.2% in women in the 1993–1996 survey, to around 17% in 2005. Prevalence of overweight was around 20% in 1993–1996 for both men or women, and increased to 30% in 2005 for men. No change was found in women. The underprivileged regions usually had higher prevalence of obesity and associated diseases. Scientific bases for Taiwan obesity definition are set out together with the screening and management plans. High-calorie intake was associated with obesity in young children (grades 1–2), but not in older children and adults. Physical inactivity and sedentary lifestyle-related variables were associated with obesity in men and older boys. In addition, good dietary quality was associated with a lower risk of obesity independent of energy intake in elderly Taiwanese. More research is needed to find effective determinants and public health measures for obesity, and concerted efforts are required to combat this rising health problem. Keywords: children, obesity, risks, Taiwan.
obesity reviews (2008) 9 (Suppl. 1), 22–31
Introduction
Affluent, high-speed and sedentary lifestyles have gradually come to dominate in Taiwan, in response to the socioeco- nomic changes of the past few decades. Average Taiwanese are now eating a diet relatively high in fat, protein and vitamins A and C, moderate in carbohydrate and low in fibre, vitamin E and calcium (1). We also observed in the society increasing prevalence of obesity and its associated chronic diseases. Cancers are the leading cause of death, contributing to 26.8% of all deaths in the national 2003 vital statistics. Cerebrovascular disease at 9.5% is the second leading cause of death, heart disease at 9.3% (the third) and diabetes mellitus at 7.6% (the fourth); these add up to a total of 28.4% of deaths (2). Obesity is an impor- tant risk factor of many of the afore-mentioned diseases
and others. Combating obesity is therefore an urgent and challenging task faced by government and public health practitioners.
In this article, we portray the current status on obesity prevalence in Taiwan, risk factors, obesity definition and management plan, and the rationality behind it. Much of the information is derived from the findings from the Nutri- tion and Health Surveys in Taiwan (NAHSIT) (3–5).
Nutrition and health surveys in Taiwan
Nutrition and Health Surveys in Taiwan are island-wide surveys carried out periodically in Taiwan to monitor the nutrition and health status of Taiwan residents, and are based on a multistage stratified and clustered probability sampling scheme. The first survey (NAHSIT 1993–1996)
(3) of this series was carried out on those aged 4 years and above, followed by an elderly survey (Elderly NAHSIT in 1999–2000) (4), and an elementary student survey (NAHSIT children in 2001–2002) (5). Currently, a house- hold survey (NAHSIT household 2004–2008) is ongoing, covering those aged 0–5 years and those above 19 years. A separate survey is currently being planned for school students aged 6–18 years. Data collected include dietary intakes assessed by 24-h recall and food frequency ques- tionnaires, biochemical assessment of nutritional status, lifestyles, nutrition-related knowledge/attitude/practice assessments, various diet and nutrition-related health indi- cators and disease status and a medical history. Depending on the surveys, the survey divided 359 townships and city districts (primary sampling units, PSUs) into 7–13 strata according to the dietary characteristics of the residents, urbanization index, geographical locations and administra- tive division. In NAHSIT 1993–1996, there were seven strata. In addition to the Hakka area, Peng-Hu islands, east coast area and mountainous area, the remaining PSUs were classified into three strata (metropolitan cities, provincial cities and class I townships, and class II townships) accord- ing to the urbanization index. After the strata were defined, three townships (or city districts) were selected from each stratum with probability of selection being proportional to population size. A number of villages (or Li’s, the smallest administrative unit) were selected within each stratum. A designated number of individuals in age–gender groups were recruited on a door-to-door basis from two randomly selected geographical clusters within each village for each of the 16 age–sex groups (age groups of 0–3, 4–6, 7–12, 13–15, 16–18, 19–44, 45–64 and 65+ years, for both men and women). Details of the design and the operational techniques for each survey vary to some degree and have been described elsewhere (3–5). A weighing process to correct for the effect of the survey design has been carried out in all the data analyses.
Prevalence of obesity and its trend
According to NAHSIT 1993–1996, the prevalence of over- weight and obesity among 7- to 12-year-old children was 12.8% and 4.9% for boys, and 10.8% and 6.9% for girls, respectively (WH. Pan, unpubl. data). However, in the NAHSIT Children 2001–2002 (6), the obesity prevalence had tripled for boys and doubled for girls. About one-third of boys (15.5% overweight and 14.7% obesity) and one- fourth of girls (14.4% overweight and 9.1% obesity) had excessive weights.
According to the World Health Organization (WHO) obesity definition for adults (body mass index, BMI ⱖ 30 kg M-2), obesity prevalence rates were 2.4% in adult men and 5.6% in adult women in the 1993–1996 survey (7). According to a preliminary data analysis on a
partial data set (for year 2005) from our 2005–2008 island- wide survey, the overall rates have increased to around 7%. According to the Taiwanese definition (BMI ⱖ 27 kg M-2), obesity prevalence rates were 10.5% in men and 13.2% in women in the 1993–1996 survey, and had increased to around 17%. The prevalence of overweight was around 20% in 1993–1996, this being subsequently maintained in women, whereas it increased to 30% in men in 2005.
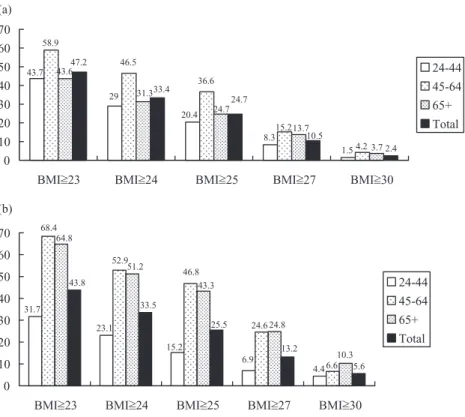
Asia-Pacific, Taiwan, China and WHO definitions adopted BMIs 25, 27, 28 and 30, respectively, as the cut- point for obesity and 23, 24, 24 and 25 for overweight. As demonstrated in Fig. 1, the prevalence rates range widely, depending on the definition used. Because of this wide variation in obesity and overweight prevalence estimates, patho-physiologic and public health criteria are required to justify the choice of cut-offs. Various lines of evidence showed that Asians experience much greater metabolic risks than their Caucasian counterparts at similar BMIs, although the overall prevalence of excess weight is in general lower than in their western counterparts.
Different metabolic response to BMI across ethnicity
At any chosen BMI or body fatness, metabolic risk was much greater in South Asians than Europeans in terms of diabetes mellitus, insulin resistance and hypertriglyceri- demia (8). Our study comparing data from NHANES III (National Health and Nutrition Examination Surveys, 1988–1994) and NAHSIT 1993–1996 showed that Tai- wanese, a group of East Asians, experienced higher abso- lute and relative risks of hypertension, hyperglycemia, dyslipidemia and hyperuricemia than non-Hispanic US white and black people (9). This is most likely due to higher percentages of body fat accumulation in Asians than in Caucasians at a similar BMI level as pointed out by a series of studies by Deurenberget al. (10), who compared data from Indonesians and Singaporeans with Caucasians. Recent studies from Taiwan (11), Korea (12) and Austra- lian aborigines (13) further support this hypothesis. In addition, people may react to fatness differently because of the difference in genetic make-up, their intrauterine (devel- opmental) environment, and dietary and physical activity patterns. These potential differences between Asians and Caucasians have been taken into consideration in establish- ing guidelines to define obesity in Taiwan.
Overweight/obesity definition, screening and management guidelines for Taiwan adults (14) (Fig. 2)
An expert panel of 18 members was formed during 2001– 2002 to establish obesity definitions and a screening and management plan for adults under the auspices of the Taiwan Department of Health. Nutritionists, epidemiolo-
gists, endocrinologists, internists, family practitioners who were active in obesity research and related public health fields were included together with representatives from the Nutrition Society, Diabetes Society, Obesity Medical Society and Society for the Study of Obesity.
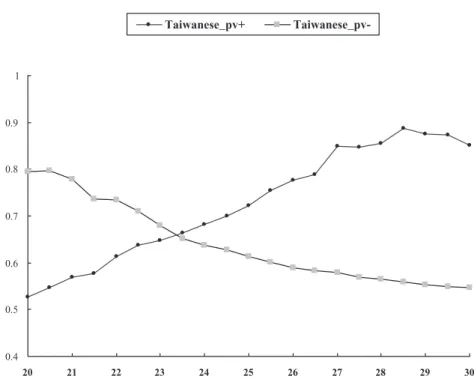
Although evidence has accumulated to support lower BMI cut-points to define obesity in Asians, it is not clear where to draw the line, as the relationships between BMI and metabolic risk are a continuum and vary among ethnic groups and populations. We considered that overweight and obesity represent states which require screening for primary and secondary prevention measures and for aggressive management, respectively. Data from NAHSIT 1993–1996 (Fig. 3) showed that for those with BMI over 27, 80–90% of them had at least one of the follow- ing conditions: hypertension, diabetes, low HDL-C (<40 mg dL-1 for men and <50 mg dL-1 for women), hypertriglyceridemia (>200 mg dL-1), or hyperuricemia (>7.7 mg dL-1 for men and >6.6 mg dL-1 for women). Many have multiple disorders. We located a balancing point at BMI 23.4 which maximized both positive and negative predictive values for the afore-mentioned clinical conditions. That is, once this screening point is imple- mented, most people (around 66%) above this screening point will have one or more clinical conditions needing management, including lifestyle interventions and treat- ment. On the other hand, most of those (66%) with BMI below the screening point do not have any of these clinical disorders. In addition, the Deurenberg study (10) showed
that body fat composition at BMI 30 for Caucasians was equivalent to that at BMI 27.2 for Chinese in Singapore. Our earlier Taiwanese study (WH. Pan, pers. comm. with Dr Po-Chao Huang) carried out at a time with low preva- lence of obesity and metabolic diseases showed that 95% confidence interval for mean BMI was between 22 and 24 for those who were aged 20–29 years old. Taken together, the cut-points for overweight and obesity were set at BMIs 24 and 27, and the normal range of BMI was set between 18.5 and 24. The Asia-Pacific cut-point for waist circum- ference (WC) was adopted for Taiwanese, as the averaged WCs for adult men and women who have BMI near 27 were around 90 cm and 80 cm, respectively, according to our representative data from NAHSIT 1993–1996 (WH. Pan, unpubl. data).
The process we established for the screening and man- agement of obesity in adults uses multiple indices, including BMI, WC and profiles of cardiovascular disease (CVD) risk factors, and their complications.
Initially, in step 1 of the protocol, the weight status of the screened is evaluated. Either overweight or obesity is indi- cated when their BMI ⱖ 24 kg m-2, or their WC ⱖ 90 cm in men and ⱖ80 cm in women. For those who have a normal BMI (step 2), any previous history of obesity is requested. For those who have maintained their BMI under 24 kg m-2 during the past 2 years (step 3), they are told to maintain their weight and to reassess both their weight and WC every year. If the normal subjects ever had BMI ⱖ 24 kg m-2during the past 2 years (step 4), then they
Figure 1 Prevalence rates of overweight and/or obesity by age groups according to various definitions, data from Nutrition and Health Survey in Taiwan 1993–1996. (a) Prevalence in adult men (percentage). (b) Prevalence in adult women (percentage). BMI stands for body mass index in kg/m2.
9. Case
assessment
BMI ≥ 24 or ≥ 90 cm (men)/ 80 cm
(women)
BMI ≥ 24 kg/m2 during past 2 yrs
To maintain current weight and to measure WC and BMI each year
1. BMI ≥ 27, or 2.BMI ≥ 24 or WC ≥ 90 cm (men)/≥80 cm (women) plus complications/ ≥ 2 CVD risk factors
1. Dietary control 2. Exercise program 3. Lifestyle modification
Surgical treatment is indicated for those who with BMI ≥ 35 and complications.
Reach the goal of weight control
Remediable failure Yes
Yes
Yes
No
No
No No
3 to 6 months 1. Dietary control 2. Exercise program 3. Lifestyle modification 4. Risk factors control
To maintain current weight and to measure WC and BMI per 3 to 6 months
Yes
≥2 complications
Yes
Yes No No 1.
3. 2.
5.
4.
10. 7.
8.
6.
13.
12. 11.
Measure WC and BMI every 3 to 6 months and maintain the following treatments: 1. Dietary control 2. Exercise guidance 3. Lifestyle modification 4. Risk factors control
1. Dietary control 2. Exercise guidance 3. Lifestyle modification 4. Include medications to control weight
Cardiovascular risk factors Complications
1. Smoking 2. Hypertension
3. Low density lipoprotein cholesterol ≥ 160 mg/dl 4. High density lipoprotein cholesterol < 40 mg/dl 5. Triglycerides ≥ 200 mg/dl
6. Impaired fasting glucose (100 ~125 mg/dl ) 7. Family history of early onset of coronary heart disease 8. Men ≥ 45 yrs or Women ≥ 55 yrs
1. Hypertension 2. Dyslipidemia 3. Diabetes 4. Coronary Heart Disease 5. Sleep apnea syndrome
Figure 2 Obesity screening and management guideline for adults. The individual numbers correspond to the steps in the management process – see text. BMI, body mass index; CVD, cardiovascular disease; WC, waist circumference.
0.4 0.5 0.6 0.7 0.8 0.9 1
20 21 22 23 24 25 26 27 28 29 30
Taiwanese_pv+ Taiwanese_pv-
Figure 3 Positive and negative predictive values (pv) by BMI levels for the presence of one or more of the metabolic diseases in Taiwanese. Metabolic diseases included (i) Hypertension: SBP > 140, DBP > 90 mmHg or on antihypertensive therapy; (ii) Diabetes: fasting plasma glucose >126 mg dL-1 or on diabetic medication;
(iii) Hypertriglyceridaemia: fasting level
>200 mg dL-1or on lipid-lowering drugs; (iv) Hypercholesterolemia: fasting level
>240 mg dL-1or on cholesterol-lowering drugs and (v) Hyperuricemia: fasting level
>7.7 mg dL-1for men and >6.6 mg dL-1for women. BMI, body mass index; DBP, diastolic blood pressure; SBP, systolic blood pressure.
are also advised to maintain the current weight, but to reassess these weight and waist status every 3–6 months.
Cardiovascular risk factors (see Fig 2) are evaluated for those with BMIs 24–27 or those with a larger waistline (step 5). For those with less than two abnormal cardiovas- cular risk factors, guidance is provided to control weight via non-pharmaceutical approaches, such as dietary control, regular exercise and other relevant lifestyle modi- fications (step 6). For those who have BMI ⱖ 27 and for those centrally obese and/or overweight individuals with two or more CVD risk factors, the first line strategy (in the first 3–6 months) involves the non-pharmaceutical lifestyle intervention approaches to control weight and cardiovas- cular risk (step 7). If the goal of weight control is achieved, adhering to the management plan, continuous monitoring
every 3–6 months is required. Medication may be consid- ered alongside of lifestyle intervention (step 12), if the non-pharmaceutical approach is not effective in weight control (step 8), when two or more complications are present (step 9), and when no improvement is anticipated (step 11). Finally, for those who have BMI ⱖ 35 kg m-2 plus two or more complications, surgery treatment is an option (step 13).
Overweight/obesity definition, screening and management guidelines for children and youth (14) (Fig. 4)
An expert panel of 11 members was formed during 1999– 2002 under the auspices of the Department of Health, and
BMI between 85th and 95th percentiles among the same age-sex group
BMI more than 95th among the same age-sex group
2-6 years ≥7 years 2-6 years > 7 years=
Reassess next year
Referred to paediatrician Physical examination
BMI = weight (kg)/ height2(m2)
Yes
No
Maintain body weight
•Balanced diet
•Appropriate physical activity
•Lifestyle modification
Control body weight
•Balanced diet & reduce calorie intake
•Appropriate physical activity
•Lifestyle modification
Follow-up Follow-up
BMI ≥ the age-sex specific 85th
percentile values
If any of the following :
•Height < 25th percentile values
•Delay in development of intelligence
•Special facial features or body shape
With any of the following:
•Elevated blood pressure
• Dyslipidemia
•Family history of obesity Yes
Yes
No Yes
No
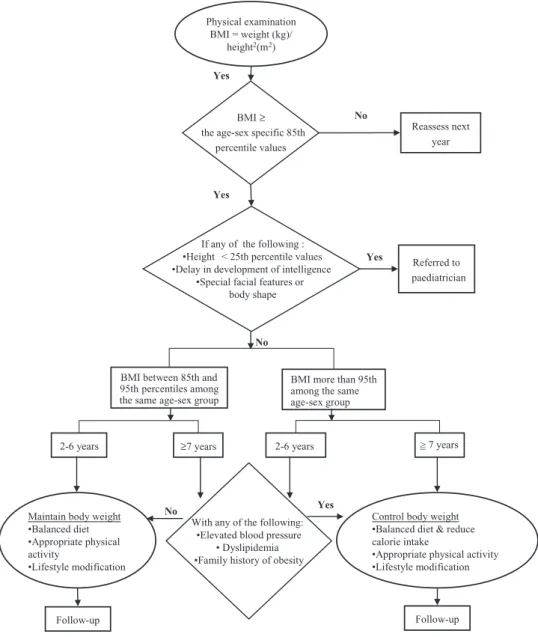
Figure 4 Obesity screening and management guideline for children, adolescents and youth.
included nutritionists/dietitians, epidemiologists, paediatri- cians, physical therapists and behavioural therapists who were active in obesity research and related public health fields. As children and youth are steadily growing with considerable variations in the distributions of their anthro- pometric parameters which are age- and gender-dependent, the expert panel has taken into consideration this variation in establishing clinical criteria of overweight or obesity for children and youth.
Body mass index was selected as the parameter to define obesity in children, adolescents and youth, not only because it is simple to use, but also because variation in height can be accounted for. In addition, it can be easily related to the adult definition. Individuals with BMI over their age- and sex-specific 95th percentile values are defined as the obese subjects, and those with BMI between 85th and 95th are defined as overweight. The 85th and 95th percentile growth curves connect well to the adult over- weight and obesity cut-points after 18 years of age. Using student data collected in 1997 by the Ministry of Educa- tion, age- and sex-specific BMI percentile values were gen- erated by Chen et al. (15) after excluding students with poor physical fitness.
Those children who have normal BMI need to be re-evaluated every year. For those who are overweight or obese, criteria are established to rule out potential second- ary causes. Referral to a paediatrician is indicated if he or she demonstrates any one of the following conditions: lower than the 25th in height, delayed development of intelligence or when there are special facial features or body shapes. If none of the above conditions exist, then several options are available, depending on age and degree of fatness (overweight or obesity) of the children and youth. For those overweight children aged between 2 and 6 years, the recommendation is to maintain body weight by adopting a balanced diet and appropriate level of physical activity, and by modifying their lifestyles. The recommen- dation is the same for those overweight children aged more than 7 years and for obese children aged 2–6 years without the presence of any of the following risks: hypertension, dyslipidemia and a family history of obesity. However, for older (ⱖ7 years) overweight children, for younger (2–6 years) obese children with risk factors and for all obese children aged 7 years and over, more aggressive measure is recommended. In addition to the same lifestyle strategy mentioned above, it is recommended to reduce their energy intake levels. The progress of all overweight or obese children should be monitored repeatedly at 3-month intervals.
Geographical differences in obesity prevalence Although Taiwan is relatively small in size, there is consid- erable geographical variation in the obesity prevalence and
associated disease risks (7). The prevalence rates were higher in mountainous men compared with metropolitan men, and higher in women residing on east coast, in moun- tains, in Peng-Hu and in less urbanized areas compared with metropolitan women. This pointed to a link between obesity and the underprivileged sub-populations in Taiwan. These deprived communities also had higher prevalence of hypertension (16), diabetes (17), dyslipidemia (18), hyperuricemia/gout (19) and the metabolic syndrome (20). However, this geographical variation was not observed in the children of the NAHSIT 1993–1996 surveys (WH. Pan, unpubl. data), but appeared in the later NAHSIT children 2001–2002 (6), demonstrating an interesting interplay between ‘exposure to an obesogenic environment’ and
‘knowledge-attitude-practice’, which was gradually chang- ing with time and exerting protective effects for those who have access to health information.
It has been demonstrated that a lower level of education is a potential risk factor for obesity (21), and regular physi- cal activity is protective by increasing energy expenditure, reducing fat mass and increasing lean muscle mass (22). Our survey data showed that people in the mountainous areas and east coast regions appeared to have much higher metabolic equivalent (MET) scores, higher intake of alco- holic drinks and lower education level. However, these variables only explain 3.07% of the variance in the risk of being overweight/obese in men. The higher prevalence of overweight and obesity among the Taiwanese aboriginal people is consistent with findings of minorities in other countries (23). In Taiwan, the aboriginal population is relatively small, and it is known that genetically, they are related to the Malayo-Polynesians. Recently, Chang and colleagues (20) reported that these mountainous abori- gines have a notable higher prevalence of hyperuricemia and metabolic syndrome, which cannot be completely explained by BMI, alcohol intake and other factors. The effect of their mountainous residence on overweight risk remained significant in both genders even after the effects of age, education and/or other enabling or behavioural factors had been adjusted. It is unclear if this is due to an underprivileged environment or to genetic factors. Further research is needed.
Obesity and its correlates: lifestyles, dietary pattern and certain socio-environmental factors It is well recognized that obesity is the result of excessive energy storage caused by long-term imbalance between energy intake and energy expenditure. Using data obtained from the NAHSIT student 2001–2002 survey (5), we have carried out a preliminary analysis on obesity and its corre- lates, including caloric intake estimated from 24-h recall, TV watching, vigorous activity, consumption of evening snacks and sweets. In grades 1–2 boys (P = 0.008) and girls
(P = 0.011), calorie intakes were significantly higher (by approximately 400 kcal per day) in the obese children than their counterparts. This phenomenon was not seen in stu- dents at grades 3–6. However, in upper-grade boys, both increased TV watching (P = 0.042) and little vigorous activity (P = 0.011) were associated with obesity. This phe- nomenon was not as apparent in younger boys or girls in general. In terms of snacking and consumption of sweets, a compensation effect was observed, i.e. obese children tended to eat less of these types of foods. Significant find- ings were observed in boys at grades 5–6 (P = 0.021 for sweets) and in boys at grades 1–2 (P = 0.021 for evening snacks), and in girls at grades 3–4 (P = 0.089 for evening snacks). In general, obese children tended to consume higher level of calories, watch longer hours of TV and participated less in vigorous physical activities. And early in life, the obese children have developed sweets and snacks avoidance behaviours. These behavioural adjustments are largely affected by parental behaviours and the environ- ment at home, school and in the surrounding neighbour- hood (24).
However, the dietary effects on energy balance in relation to obesity was not as clear-cut when we examined this issue using the 24-h recall and food frequency questionnaire data for adults (7). We could not clearly demonstrate the effects of caloric intake or food frequency on the risk of develop- ing obesity or overweight, except in women in whom the frequent consumption of uncooked meats (mostly raw fish), adjusted for age, was inversely associated with the obesity risk. It appeared that women who consumed uncooked meats had 2.14 more years of education (P < 0.0004) than those who did not. It is potentially likely that the consumption of uncooked meats was a surrogate for a specific type of lifestyle that might protect against weight gain.
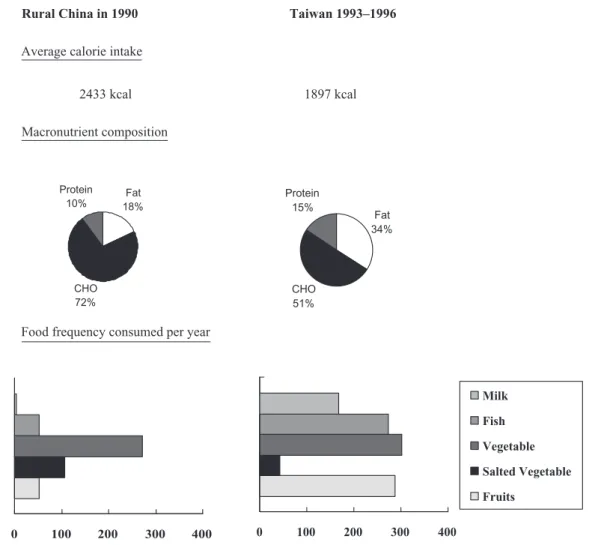
The failure to show the association between caloric intake and BMI in adults is not unusual. It could be due to the relatively large measurement errors encountered in 24-h recall, the homogeneous distribution of caloric intake levels within given societies with relatively wide distribution in energy expenditure and a clear obesity–food avoidance cycle. On the other hand, comparing mean food frequency, caloric intake level and the body weight of middle-aged rural China population in 1990 (25) and those surveyed in NAHSIT 1993–1996 (Fig. 5) showed that, even though the mean heights of the two populations were very close, rural Chinese had much higher caloric intakes (2433 vs. 1897 kcal per day), but lower body weights than Taiwan residents as a whole. These two populations differed tre- mendously in lifestyles and dietary patterns. The majority of the rural Chinese were farmers, consuming a diet very high in carbohydrate (72%) and low in both fat (18%) and protein (10%), in contrast to the recent data for Taiwan residents who ingest a diet which is moderate in carbohy-
drate (50.5%) and higher in fat (34%) and protein (15.5%). The quality of the diets was also different. As measured in the 1990s, while Taiwanese much more fre- quently consumed milk, fish, vegetables and fruits than their rural Chinese counterparts did, the latter had more salted vegetables. Although the evidence indicates that evolving lifestyles and dietary patterns are the major culprit for the drastic increase in obesity prevalence in current society, this information is of limited use, as the current environment and lifestyle are unlikely to be reversed.
Several features which may contribute to the state of obesity have been examined within Taiwan society, using data from NAHSIT 1993–1996 (7), including such pre- disposing factors as age, gender, participants’ residing stratum, education level and nutrition/health-related knowledge score, enabling factors such as their sources of nutrition information and their tendency to store snack foods at home, and behavioural factors including dietary habits, caloric intake from alcoholic drinks, physical activ- ity, smoking status and the labour intensiveness of the individual’s job.
In addition to the effect of residential stratum discussed previously, certain predisposing and enabling factors, including nutrition knowledge, number of nutrition and health-related information sources, and storage of snacks at home, when adjusted for age, were all inversely associ- ated with the risk of being overweight in women. This significance no longer existed in the multivariate analysis when strata and years of education were also included, which suggested that the effects of these nutrition and health-related behaviours were partially explained by edu- cation level and where the participant lived. The implica- tion is that measures which are primarily governmental and societal should be considered and implemented to remove or reduce these predisposing and enabling factors: modify- ing the larger environment and micro-environment associ- ated with education, health knowledge and practice, and the social network is important.
In terms of individual and behavioural factors, the asso- ciation between physical activity and the risk of being overweight/obese (BMI > 25 kg m-2) was significant in men but not in women. It is possible that the range of MET is too small in women for physical inactivity to exhibit a sizable effect. On the other hand, it has been suggested by Farmer et al. that there may be a gender difference in reporting physical activity because of cultural expectations and habits (26). In epidemiological studies, the develop- ment and validation of many physical activity question- naires mainly focus on men. Thus, the use of such questionnaires may not adequately reflect certain types of activity that women primarily engage in, such as house- work (27).
Although the mean calorie intake from alcoholic bever- ages was highest in the mountainous regions and the east
coast areas, the effect of increased alcohol consumption on the development of overweight/obesity was independent of the geographical location in Taiwanese men. A similar trend was also observed in women, but it was less influen- tial and was not statistically significant. In our female sub- jects, more than 85% reported themselves as non-drinkers, and the 95th percentile value of caloric intake of alcoholic drinks was only 28.7 kcal d-1(4.1 g d-1 of alcohol). This insignificant effect of alcohol consumption may be due to the very small number of female drinkers compared with the majority of non-drinkers.
Smoking is a known factor inversely associated with weight gain, but did not significantly explain the risk of being overweight in our study. All the correlates discussed above account for 5% and 12% of the BMI variation in men and women, respectively. Correlations with BMI varied substantially by gender and more work on this is clearly needed.
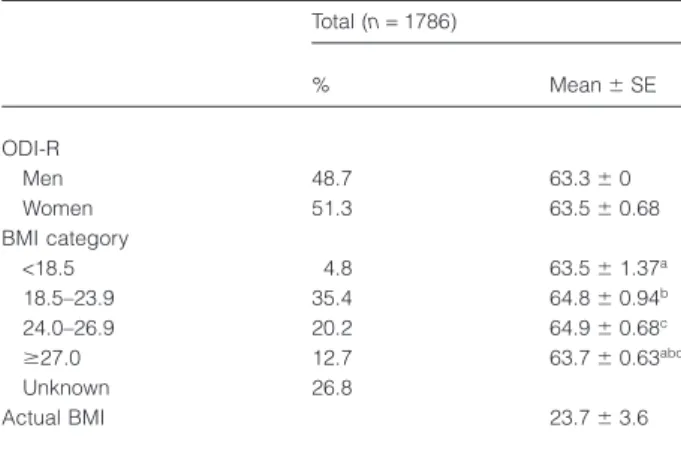
The impact of diet may involve aspects other than calorie level. The overall dietary index-revised (ODI-R), designed
by the second author (28–29), was calculated for the sur- veyed elderly (4), and involved combining data from both 24-h recall and a simplified food frequency questionnaire. Scores obtained from the following nine aspects were summed up with a maximum of 100 points (i) amount (number of servings) (10 points) and quality (5 points) of starchy foods; (ii) amount of vegetables (10 points); (iii) amount of fruit (10 points); (iv) amount (10 points) and quality (plant protein and fish) (5 points) of protein-rich foods; (v) amount of dairy products (10 points); (vi) P/S ratio (10 points); (vii) amount of dietary cholesterol (10 points); (viii) amounts of refined sugar (3 points), salt (4 points) and alcohol (3 points) and (ix) food diversity (10 points). The scores of the first five items and item ix were derived from the simplified food frequency questionnaire, and those of the remaining three items from 24-h recall. In men and women combined, lower mean ODI-R score was observed in people in the high-BMI group (Table 1), and there was a significant negative association between ODI-R and the risk of being obese (Table 2), in contrast with that
Rural China in 1990 Taiwan 1993–1996
Average calorie intake
2433 kcal 1897 kcal
Macronutrient composition
Food frequency consumed per year
Fat 18%
CHO 72% Protein
10%
Fat 34%
CHO 51% Protein
15%
0 100 200 300 400 0 100 200 300 400
Milk Fish Vegetable Salted Vegetable Fruits
Figure 5 Comparing dietary patterns between middle-aged (35–64 years) population residing in rural China in 1990 and those in Taiwan 1993–1996.
of the underweight. These findings suggest that overall dietary patterns or quality has certain effects on weight control. The mechanism behind this and possible con- founders should be sorted out carefully, because the data may have significant implications for future measures for obesity control.
Conclusions
Many lines of evidence have demonstrated that overweight and obesity are increasing health issues in Taiwan, not only because of their high prevalence, but also because of their adverse consequences for metabolic diseases in Asians. It is particularly alarming as our younger generation is being affected most rapidly, and the regional disparity also
requires a fine-tuning of effective public health measures. Correlates of obesity, however, explain only a small per- centage of the BMI variations. Our general understanding is that there is no easy way to reverse the trend in obesity because there have been drastic changes in our environment to which mankind has not been exposed before. New find- ings, ideas, tools and measures are required, which should be proposed, assessed, tested and proven to be effective through research approaches before being implemented nationally. However, none of these proposals will be ful- filled without concerted efforts from multiple disciplines and a joint force involving both private and public sectors. To increase our knowledge, to provide information and feasible measures for change at the individual level require that we also build an obesity-proof environment on a large scale with a systematic and comprehensive strategic plan involving all possible channels and parties. This needs to cover all age–sex groups and all locations, including schools, the community, work sites and rural as well as urban environments. Urgent action on obesity is needed.
Acknowledgements
Nutrition and Health Survey in Taiwan 1993–1996, elderly NAHSIT in 1999–2000, NAHSIT children in 2001–2002, NAHSIT household 2004–2008 have been supported by Department of Health (FN 82-02, DOH83, DOH84- FS-011, DOH85-FS-011, DOH86-FS-011, DOH87-FS, DOH88-FS, DOH89-88shu717, DOH90-FS-5-4, DOH91- FS-5-4, DOH93-FS-6-4, DOH94-FS-6-4).
Conflict of Interest Statement No conflict of interest was declared.
Table 1 Average ODI-R by BMI groups, Elderly Nutrition and Health Survey, 1999–2000
Total (n = 1786)
% Mean ⫾ SE
ODI-R
Men 48.7 63.3 ⫾ 0
Women 51.3 63.5 ⫾ 0.68
BMI category
<18.5 4.8 63.5 ⫾ 1.37a
18.5–23.9 35.4 64.8 ⫾ 0.94b
24.0–26.9 20.2 64.9 ⫾ 0.68c
ⱖ27.0 12.7 63.7 ⫾ 0.63abc
Unknown 26.8
Actual BMI 23.7 ⫾ 3.6
BMI, body mass index; ODI-R, overall dietary index-revised; All data were expressed as Mean ⫾ SE. The ODI-R of four BMI groups was compared by regression analysis, using SUDDAN. Common superscript letters indicates significant difference at P < 0.05.
Table 2 The relative risk of obesity and underweight (⫾CI) in relation to the quintiles of ODI-R score in the Elderly Nutrition and Health Survey in Taiwan, 1999–2000
Relative risk ODI-R
ODI-R quintiles
Q1
<55.3
Q2 55.3–61.1
Q3 61.1–66.1
Q4 66.1–71.8
Q5
>71.8
Pfor trend
Underweight* 21/112 21/112 14/122 19/133 15/129
Crude model† Ref. 1.23 (0.42–3.57) 0.74 (0.22–2.51) 1.17 (0.49–2.79) 0.77 (0.26–2.28) 0.61
Multivariate model†‡ Ref. 2.27 (0.75–6.84) 0.92 (0.26–3.28) 1.37 (0.61–3.08) 1.22 (0.41–3.64) 0.55
Obesity§ 63/112 54/112 58/122 36/133 35/129
Crude model† Ref. 0.92 (0.50–1.72) 0.87 (0.44–1.72) 0.51 (0.24–1.07) 0.42 (0.19–0.93) 0.01
Multivariate model†‡ Ref. 0.63 (0.31–1.26) 0.55 (0.28–1.07) 0.26 (0.13–0.54) 0.27 (0.11–0.61) <0.01
*BMI < 18.5.
†Logistic regression with design effect adjusted by SUDAAN.
‡Further adjusting for sex, age, education years, marriage status, stratum, smoking status, income and physical activity.
§BMI ⱖ 27.
BMI, body mass index; ODI-R, overall dietary index-revised.
References
1. Pan W-H, Chang Y-H, Chen J-Y, Wu S-J, Tzeng M-S, Kao M-D. Nutrition and Health Survey in Taiwan (NAHSIT) 1993–96: dietary nutrient intakes assessed by 24-hour recall. Nutr Sci J 1999; 24: 11–39.
2. Department of Health. Vital statistics: mortality in Taiwan. In: Health and Vital Statistics, Vol. 2. Author: Taipei, 2004. 3. Pan WH, Yen LL, Hung YT, Li LA, Hsiao SY, Yeh WT, Huang PC. Nutrition and Health Survey in Taiwan (NAHSIT) 1993–96: design, contents, and operations.J Nutr Sci 1999; 24: 1–10. 4. Pan WH, Hung YT, Shaw NS, Lin W, Lee SD, Chiu CF, Lin MC, Chen SY, Hong CM, Huang TY, Chang HY, Tu SH, Chang YH, Yeh WT, Su SC. Elderly Nutrition and Health Survey in Taiwan (1999–2000): research design, methodology and content. Asia Pac J Clin Nutr 2005; 14: 203–210.
5. Tu SH, Hung YT, Chang HY, Hang CMNS, Shaw Lin W, Lin YC, Hu SW, Yang YH, Wu TT, Chang YH, Su SC, Hsu HC, Tsai KS, Chen SY, Yeh CJ, Pan WH. Nutrition and Health Survey of Taiwan’s Elementary School Children 2001–02: research design, methods and contents.Asia Pac J Clin Nutr 2007; 16(Suppl. 2): 507–517.
6. Chu NF, Pan WH. Prevalence of obesity and its comorbidities among schoolchildren in Taiwan. Asia Pac J Clin Nutr 2007; 16(Suppl. 2): 601–607.
7. Lin YC, Yen LL, Chen SY, Kao MD, Tzeng MS, Huang PC, Pan WH. Prevalence of overweight and obesity and its associated factors. findings from National Nutrition and Health Survey in Taiwan 1993–96.Prev Med 2003; 37: 234–242.
8. Simmons D, Williams DR, Powell MJ. The Coventry Diabetes Study: prevalence of diabetes and impaired glucose tolerance in Europids and Asians.Q J Med 1991; 81: 1021–1030.
9. Pan WH, Flegal KM, Chang HY, Yeh WT, Yeh CJ, Lee WC. Body mass index and obesity-related metabolic disorders in Taiwanese and US whites and blacks: implications for definitions of overweight and obesity for Asians.Am J Clin Nutr 2004; 79: 31–39.
10. Deurenberg P, Yap M, van Staveren WA. Body mass index and percent body fat: a meta analysis among different ethnic groups. Int J Obes Relat Metab Disord 1998; 22: 1164–1171.
11. Chang CJ, Wu CH, Chang CS, Yao WJ, Yang YC, Wu JS, Lu FH. Low body mass index but high percent body fat in Taiwanese subjects: implications of obesity cutoffs.Int J Obes Relat Metab Disord 2003; 27: 253–259.
12. Chung S, Song MY, Shin HD, Kim DY, He Q, Heshka S, Wang J, Thornton J, Laferrere B, Pi-Sunyer FX, Gallagher D. Korean and Caucasian overweight premenopausal women have different relationship of body mass index to percent body fat with age.J Appl Physiol 2005; 99: 103–107.
13. Piers LS, Rowley KG, Soares MJ, O’Dea K. Relation of adi- posity and body fat distribution to body mass index in Australians of Aboriginal and European ancestry.Eur J Clin Nutr 2003; 57: 956–963.
14. Clinical Nutrition Committee of Taiwan Nutrition Society. (ed.)Clinical Nutrition Manual. Department of Health: Taiwan, 2006.
15. Chen W, Lin CC, Peng CT, Li CI, Wu HC, Chiang J, Wu JY, Huang PC. Approaching healthy body mass index norms for chil- dren and adolescents from health-related physical fitness. Obes Rev 2002; 3: 225–232.
16. Pan W-H, Chang H-Y, Yeh W-T, Hsiao S-Y, Hung Y-T. Preva- lence, awareness, treatment and control of hypertension in Taiwan: results of nutrition and health survey in Taiwan (NAHSIT) 1993–96.J Hum Hypertens 2001; 15: 793–798. 17. Pan WH, Yeh WT, Chang HY, Hwu CM, Ho LT. Prevalence and awareness of diabetes and mean fasting glucose by age, sex, and region: results from the Nutrition and Health Survey in Taiwan, 1993–96.Diabet Med 2003; 20: 182–185.
18. Chang HY, Yeh WT, Chnag YH, Tsai KS, Pan WH. Preva- lence of dyslipidemia and mean blood lipid values in Taiwan. results from the Nutrition and Health Survey in Taiwan. (NAHSIT, 1993–96).Chin J Physiol 2002; 45: 187–197.
19. Chang HY, Pan WH, Yeh WT, Tsai KS. Hyperuricemia and gout in Taiwan. Results from the Nutritional and Health Survey in Taiwan (NAHSIT 1993–96). J Rheumatol 2001; 28: 1640– 1646.
20. Chang YP, Yeh WT, Cheng YY, Pan WH. Excess metabolic syndrome and hyperuricemia in Taiwanese aborigines: environ- mental or genetic?J Genet Mol Biol 2007; 18: 29–33.
21. Martinez JA, Kearney JM, Kafatos A, Paquet S, Martinze- Gonzalez MA. Variables independently associated with self- reported obesity in the European Union.Public Health Nutr 1999; 2: 125–133.
22. Tremblay A. Physical activity and obesity. Baillieres Clin Endocrinol Metab 1999; 13: 121–129 doi 10.1053/ beem.1999.0010.
23. Kumanyika SK. Special issues regarding obesity in minority populations.Ann Intern Med 1993; 119: 650–654.
24. Hang CM, Lin W, Yang HC, Pan WH. The relationship between snack intake and its availability of 4th-6th graders in Taiwan.Asia Pac J Clin Nutr 2007; 16(Suppl. 2): 547–553. 25. Chen J, Peto R, Pan WH, Liu B, Campbell TC, Boreham J, Parpia B, Cassano P, Chen Z, Feng Z, Gelband H, Li J, Pan H, Root M, Wu Y, Youngman L.Mortality, Biochemistry, Diet and Lifestyle in Rural China. Geographic Study of the Characteristics of 69 Counties in Mainland China and 16 Areas in Taiwan. Oxford University Press: Oxford, 2006. [WWW document]. URL http://www.ctsu.ox.ac.uk/~china/monograph (text updated 26 January 2006; data updated 21 August 2003).
26. Farmer ME, Locke BZ, Moscicki EK, Dannenberg AL, Larson DB, Radloff LS. Physical activity and depressive symptoms: the NHANES I epidemiologic follow-up study.Am J Epidemiol 1988; 128: 1340–1351.
27. Blair SN, Kohl 3rd HW, Paffenbarger RS. Jr, Clark DG, Cooper KH, Gibbons LW. Physical fitness and all-cause mortality: a prospective study of healthy men and women.J Am Med Assoc 1989; 262: 2395–2401.
28. Su HH. Overall dietary quality indices and health status in the elderly of Taiwan. Master. School of Public Health, National Defense Medical Center, Taipei. 2007, 168.
29. Yang FY. The association between overall dietary index revised and metabolism syndrome. Master. School of Public Health, National Defense Medical Center, Taipei. 2004; 172.