A study of spatial structures of bremsstrahlung
continuum and Z eff based on visible spectroscopy
in LHD
Zhou Hangyu
Doctor of Philosophy
Department of Fusion Science
School of Physical Sciences
The Graduate University for Advanced Studies
2010 (School Year)
Abstract
Impurity control is significantly important to reduce substantial power loss and to achieve high performance plasmas in controlled nuclear fusion research. Effective ion charge, Zeff, is a key parameter to characterize the impurity contents in fusion plasmas and the radial distribution gives clear information on the impurity transport. The Zeff value has been observed using bremsstrahlung continuum in high-temperature plasmas. A Zeff diagnostic system based on a visible spectrometer has been newly designed and constructed instead of an old interference filter system in Large Helical Device (LHD) to eliminate line emissions and to obtain Zeff in low-density plasmas. An astigmatism-corrected Czerny- Turner-type visible spectrometer coupled with a charge coupled device (CCD) has been installed with a 44-channel optical fiber array to detect the visible bremsstrahlung continuum profile in LHD. The diagnostic system has been absolutely calibrated with a standard tungsten lamp and an integrated sphere to analyze the visible bremsstrahlung continuum at 530nm quantitatively.
A full vertical bremsstrahlung profile (-0.6m≤Z≤0.6m) has been successfully observed for horizontally elongated plasma cross section in both discharges using H2 gas- puffing at normal density range (ne≤1014cm-3) and solid H2 multi-pellet injection at extremely high-density range (ne≥1014cm-3). The line emissions are entirely eliminated from the signal due to the high spectral resolution with which the bremsstrahlung continuum can be clearly separated from spectral lines, whereas nonuniform bremsstrahlung emission originating in the ergodic layer is indentified in the radial profile for the normal discharges with outwardly shifted magnetic axis configurations (Rax>3.60m). At present, the lower half of the vertical bremsstrahlung profile (-0.6m≤Z≤0m) is applicable to the Zeff profile analysis for the gas-puff discharges in inwardly shifted magnetic axis configurations (Rax≤3.60m). On the contrast, the vertical bremsstrahlung profile measured from the pellet discharges is fully available for the Zeff profile analysis in all the magnetic axis configurations because the plasma edge boundary shrank in the high- density operation and the nonuniform bremsstrahlung emission disappeared.
Local bremsstrahlung emissivity profile has been derived from the vertical bremsstrahlung profile as a function of normalized minor radius, ρ, through Abel inversion taking finite β-effect into account. Errors in the calculation due to the magnetic surface distortion have been examined with uncertainty of the edge plasma boundary. The result
i
indicates that determination of the normalized minor radius for each observation chord gives the largest influence on the error estimation rather than the chord length determination. Thus, the Zeff profile has been calculated from the radial bremsstrahlung emissivity profile by considering the temperature and density profiles in a wide density range of 3.0≤ne≤30×1013cm-3 and for a variety of density profiles. The Zeff values measured in the present system are checked by neutral-beam-heated discharges with H2 and C pellet injections, in which the Zeff values should be close to 1 and 6, respectively. The result shows a good agreement between the measurement and the estimation. The line- averaged Zeff value decreases from 3.8 to 1.4 as the density varies from 3 to 9×1013cm-3 in the gas-puff discharges with Rax=3.6m, while it keeps a constant value close to 1.0 for density range of 9 to 30×1013cm-3 in the pellet discharges with Rax=3.85m. The Zeff profiles have been extensively analyzed in the LHD discharges. As a result, it is found that the Zeff
profile becomes generally flat in helical plasmas even if the density profile is changed to peaked, flat or hollow one. It indicates that the impurity partial pressure is radially constant to the electron or ion pressure.
Total bremsstrahlung radiation has been studied from the visible bremsstrahlung profile by integrating over the whole energy region and plasma volume. The total bremsstrahlung radiation is correlated with several plasma parameters for the gas-puff and pellet discharges. It is found that the total bremsstrahlung radiationquickly increases in proportion to the square of the density for the pellet discharges, while it is roughly constant against the density in the gas-puff discharges. The total radiation loss is entirely dominated by the total bremsstrahlung radiationin the high-density pellet discharges. The ratio of the total bremsstrahlung radiation to the total input power only ranges in 3-10% in the gas-puff discharge. However, the ratio starts to increase with the density in the pellet discharges and reaches 40% at ne=30×1013cm-3. Flat Zeff profiles are also found not only in the gas-puff discharges but also in the pellet discharges. It strongly suggests that the impurity accumulation is not occurred in the pellet discharges of LHD.
The Zeff profile diagnostics based on the visible bremsstrahlung in LHD has often become difficult because of the presence of the nonuniform visible bremsstrahlung emissions originating in the edge ergodic layer. For solving this problem, an alternative approach to the Zeff profile diagnostics using a space-resolved flat-field extreme ultraviolet (EUV) spectrometer has been newly adopted to detect the bremsstrahlung continuum in the EUV wavelength range of 7.0-7.5nm. The EUV bremsstrahlung intensity profiles have been measured and checked for all the magnetic configurations in LHD. It is found that the nonuniform bremsstrahlung emission can be entirely eliminated by use of the EUV
bremsstrahlung. As a result, the Zeff profile has been successfully measured for most of discharges regardless of magnetic field structures of the ergodic layer which can be usually controlled by the magnetic axis shift in the range of 3.5≤Rax≤4.1m. The Zeff profiles measured in the EUV range are compared with those measured in the visible range for inwardly shifted configurations (Rax≤3.60m). The result is in good agreement between the two Zeff profiles. It verifies that the use of the EUV bremsstrahlung continuum is a novel way for the Zeff diagnostics in toroidal plasmas with such nonuniform bremsstrahlung emissions at the plasma edge. Typical analysis on the EUV bremsstrahlung also shows a fairly flat Zeff profile with error bars of ±14% in the outwardly shifted configuration of Rax=3.75m at which the Zeff profile diagnostics is not available from the visible bremsstrahlung measurement.
iii
Contents
1 Introduction 1
1.1 Thermonuclear fusion research ··· 1
1.2 Impurity behavior in fusion plasmas ··· 4
1.3 Large Helical Device and impurity research ··· 5
1.4 Aim of the present study ··· 7
1.5 Structure of the thesis ··· 9
References ··· 11
2 Principle of Zeff diagnostics 13 2.1 Bremsstrahlung continuum radiation ··· 13
2.2 Effective ion charge ··· 15
3 Development of visible spectrometer system 19 3.1 Introduction ··· 19
3.2 Visible spectrometer system ··· 20
3.3 System calibration ··· 24
3.4 Experimental results ··· 27
3.4.1 Images and spectra ··· 27
3.4.2 Bremsstrahlung intensity profile ··· 29
3.5 Comparison with old system ··· 32
3.6 Summary ··· 34
v
Contents
Reference ··· 35
4 Reconstruction of bremsstrahlung profile 37 4.1 Introduction ··· 37
4.2 Principle of Abel inversion technique ··· 38
4.3 Slice and stack method based on magnetic geometry ··· 39
4.3.1 Determination of magnetic geometry ··· 40
4.3.2 Nonlinear fitting method for integrated bremsstrahlung profile ··· 44
4.4 Error estimation in Abel inversion calculation ··· 44
4.5 Density dependence of bremsstrahlung emission ··· 48
4.6 Summary ··· 50
References ··· 51
5 Analysis of radial Zeff profile 53 5.1 Introduction ··· 53
5.2 Experimental verification of measured Zeff values ··· 54
5.3 Comparison of Zeff profiles among different density profiles ··· 57
5.4 Zeff profiles for NBI discharges with single C pellet ··· 68
5.5 Summary ··· 71
References ··· 72
6 Evaluation of total bremsstrahung radiation 73 6.1 Introduction ··· 73
6.2 Experimental setup ··· 74
6.3 Analysis of total bremsstrahlung radiation ··· 78
6.4 Core bremsstrahlung radiation in different density regimes ··· 79
6.4.1 Emissivity profile of bremsstrahlung radiation ··· 79
6.4.2 Density dependence of total bremsstrahlung radiation ··· 82
6.4.3 Behavior of Zeff ··· 87
Contents
6.4.4 Bremsstrahlung radiation from ergodic layer ··· 89
6.5 Summary ··· 91
References ··· 92
7 Alternative approach to Zeff diagnostics 93 7.1 Introduction ··· 93
7.2 EUV spectrometer for bremsstrahlung profile measurement ··· 94
7.3 Comparison between visible and EUV bremsstrahlung profiles ··· 96
7.3.1 Visible and EUV spectra ··· 96
7.3.2 Visible and EUV bremsstrahlung profiles ··· 99
7.4 Analysis of radial Zeff profile from EUV bremsstrahlung ··· 99
7.5 Summary ··· 103
References ··· 104
8 Summary and conclusion 105
Acknowledgements 109
Publications 111
vii
Contents
List of Figures
1.1 Key parameter of reaction rate as a function of ion temperature ··· 2
1.2 Toroidal plasmas and external magnetic coils in tokamak and stellarator ··· 3
1.3 Schematic of Large Helical Device ··· 6
2.1 Bremsstrahlung radition from electron-ion coulomb collision ··· 14
2.2 Arrangement of Thomson scattering diagnostics in LHD ··· 16
3.1 Schematic top view of LHD with view line of fiber array ··· 21
3.2 Magnetic surfaces at horizontally elongated plasma cross section and parallel observation chords of fiber array ··· 21
3.3 Optical layout of 300mm astigmatism-corrected Czerny-Turner-type visible spectrometer ··· 23
3.4 Spectral resolution for three gratings as a function of entrance slit width ··· 24
3.5 Absolute sensitivities of three gratings for two entrance widths ··· 25
3.6 Relative sensitivities of two gratings for fiber channels ··· 26
3.7 Output CCD images against wavelength and fiber channel··· 27
3.8 Typical visible spectra in wavelength range of 450-600 nm at Z = 26mm for high density and low density cases ··· 28
3.9 Vertical profiles of chord-integrated bremsstrahlung intensity and magnetic surface structures with observation chords for Rax = 3.6m and Rax = 3.75m and nonuniform factor as a function of magnetic axis position ··· 30
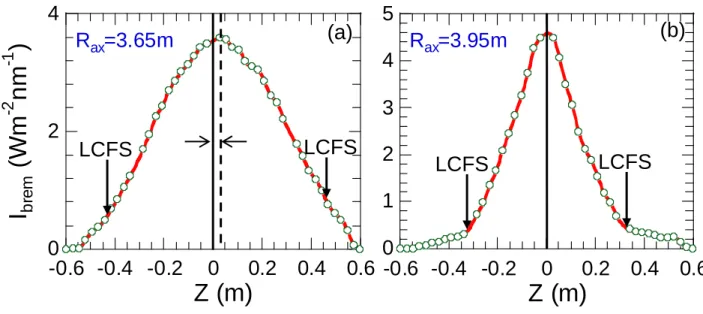
3.10 Vertical profiles of chord-integrated bremsstrahlung intensity in high-density plasmas with Rax = 3.65m and Rax = 3.95m ··· 31 3.11 Comparison of bremsstrahlung intensity profiles measured by visible spectrometer
ix
List of Figures
system and old interference filter system ··· 33 4.1 Circular cross section and coordinate for Abel inversion ··· 38 4.2 Nonaxisymmetric cross section for slice and stack method··· 39 4.3 Pressure profiles for deriving magnetic surface structures against normalized
radius ··· 41 4.4 Magnetic surface structures and electron temperature profiles ··· 42 4.5 Chord-integrated bremsstrahlung intensity, bremsstrahlung emissivity after Abel
inversion and normalized errors of intensity for two different fitting curves ··· 43 4.6 Chord-integrated bremsstrahlung intensity, observation chord length and
bremsstrahlung emissivity for β = 1.44%(8020) and their normalized
errors for different pressure profiles ··· 46 4.7 Chord-integrated bremsstrahlung intensity, observation chord length and
bremsstrahlung emissivity for β = 0.33%(8020) and their normalized
errors for different pressure profiles ··· 47 4.8 Profiles of chord-integrated bremsstrahlung intensity, electron density profiles and
bremsstrahlung emissivity for different density ranges as a function of normalized radius and bremsstrahlung emissivity as a function of the density at ρ = 0.2 ··· 49 5.1 Waveform of electron density with H2 multi-pellet injection and radial profiles of
electron density, electron temperature, bremsstrahlung emissivity and Zeff ··· 55 5.2 Waveform of electron density with C pellet injection and radial profiles of
electron density, electron temperature, bremsstrahlung emissivity and Zeff ··· 56 5.3 Waveforms of high-density discharge with multi-pellet injection for peaked density
profile ··· 58 5.4 Radial profiles of plasma parameters for a peaked density distribution as a function
of normalized radius ρ at t1 = 1.82 s, indicated in Fig. 5.3 ··· 60 5.5 Radial profiles of plasma parameters for a peaked density distribution as a function
of normalized radius ρ at t2 = 2.17 s, indicated in Fig. 5.3 ··· 61 5.6 Waveforms of stable discharge for flat density profile ··· 63 5.7 Radial profiles as a function of normalized radius ρ at t = 2.53 s, indicated in
List of Figures
Fig. 5.6 ··· 64 5.8 Waveforms of density rise discharge for hollow density profile ··· 66 5.9 Radial profiles as a function of normalized radius ρ at t = 1.13 s, indicated in
Fig. 5.8 ··· 67 5.10 Discharge waveforms with single C pellet injection ··· 69 5.11 Zeff and carbon ion density profiles for three different times during the density
decay phase denoted in Fig. 5.10 as a function of normalized radius ··· 70 6.1 Typical waveforms of gas-puff discharge and pellet discharge and radial profiles
of electron density and electron temperature ··· 76 6.2 Calculated bremsstrahlung radiation as a function of wavelength for different
central electron temperatures ··· 77 6.3 Typical visible bremsstrahlung profiles and local emissivity bremsstrahlung
profiles against normalized radius for gas-puff discharge and pellet discharge ··· 80 6.4 Wavelength-integrated bremsstrahlung radiation per unit volume and
bremsstrahlung radiation per unit normalized radius for gas-puff discharge
and pellet discharge as a function of normalized radius ··· 81 6.5 Total bremsstrahlung radiation for different magnetic axis configurations as a
function of line-averaged electron density ··· 83 6.6 Total radiation loss and total bremsstrahlung radiation as a function of
line-averaged electron density in gas-puff and pellet discharges ··· 84 6.7 Ratio of total bremsstrahlung radiation to NBI birth deposition power as a function
of line-averaged electron density ··· 85 6.8 Line-averaged effective ion charge and ratio of total number of carbon ions to total
number of electrons as a function of line-averaged electron density for different magnetic configurations ··· 86 6.9 Radial Zeff profiles for discharges with different densities in different magnetic
configurations as a function of normalized radius ··· 88 6.10 Radial profiles of local bremsstrahlung emissivity at different wavelengths as a
function of normalized radius ··· 90
xi
List of Figures
7.1 Arrangement of view chords at horizontally elongated plasma cross section
for EUV spectrometer and visible spectrometer ··· 95 7.2 EUV spectrum at 5-24 nm and visible spectrum at 450-600 nm ··· 97 7.3 Visible and EUV bremsstrahlung intensity profiles ··· 98 7.4 Radial profiles of electron density, electron temperature, bremsstrahlung emissivity,
Zeff from EUV bremsstrahlung and Zeff from visible bremsstrahlung ··· 101 7.5 Radial profiles of electron density, electron temperature, bremsstrahlung emissivity,
Zeff from EUV bremsstrahlung ··· 102
Chapter 1
Introduction
1.1 Thermonuclear fusion research
Exploration of fusion energy source is a critical approach to solve human-faced energy source crisis in the near future. Thermonuclear fusion [1-2] was identified as a possible energy source and investigated through experiments in 1950s. During the past 50 years, remarkable progress [3] has been made in thermonuclear fusion research and major facility aimed at demonstrating Deuterium-tritium (D-T) burning plasmas, i.e., ITER [4], has been planned 20 years ago and has been under construction at present.
The D-T reaction is a promising way to achieve thermonuclear fusion [5] because the reaction rate is entirely large in relatively low ion temperature range, e.g., 10keV, as seen in Fig. 1.1. The D-T reaction is expressed by the following equation;
1D2 + 1T3→ 2He4 (3.52MeV) + n1 (14.06MeV), (1.1) where n is the neutron, He the helium, so called α particle. The subscript and superscript
denote the atomic number and the atomic mass unit, respectively. In the fusion reaction, the difference in the biding energy of the atomic nucleus before and after the reaction is opened as the kinetic energy of 3.52 and 14.06MeV. α particles with energy of 3.52MeV
1
Chapter 1 Introduction
maintain high-temperature plasma in the steady state fusion reactor as the internal heating power, so called α heating, whereas the neutron is utilized for the output energy.
Ti (keV)
<συ> (m3 s-1 ) Fig. 1.1. Key parameter of reaction rate,
<συ>, as a function of ion temperature for different types of fusion reaction.
The ignition condition for D-T self-burning reaction is fundamentally defined by Lawson criterion [6]. In this criterion, however, the α-heating is not taken into account, assuming that the reactor is sustained only by the external heating source. The corrected ignition condition with the α heating can be then defined by
nTτE> 3 × 10²¹ m-3keVs, (1.2)
where n and T are the ion density and the ion temperature, respectively. The symbol of τE
means the energy confinement time which is defined by ratio of total stored energy to total heating power. Typical parameters for the ignition condition are given by n = 1020m-3, T = 10keV and τE = 3s.
Magnetic confinement fusion (MCF) is one of two main approaches to the thermonuclear fusion reactor. In the MCF high-temperature plasmas are totally confined by helical magnetic fields. Two toroidal devices with different magnetic field system, i.e. tokamak and stellarator, exist in the MCF as the most promising candidate for the fusion reactor. In tokamaks, the high-temperature plasma is confined by helical magnetic fields combined toroidal magnetic field from external toroidal magnets with poloidal magnetic field from internal inductive plasma current. In stellarators, on the contrary, the helical magnetic fields are fully generated by external helical magnets. Principles for the plasma confinement in both devices are illustrated in Fig. 1.2. Up to now, the plasma parameters in tokamaks have been close to the reactor condition, so called 'break even'. However, the
Chapter 1 Introduction
stellarator has inherent capability [7] of easy access to the steady state operation of the fusion reactor.
(a) Toroidal Field
Magnets
Plasma Magnetic Field Vacuum Vessel
Ohmic Transformer
(b)
Poloidal Field Magnets
Helical Field Magnets
Plasma
Fig. 1.2. Toroidal plasmas and external magnetic coils in (a) tokamak and (b) stellarator.
3
Chapter 1 Introduction
1.2 Impurity behavior in fusion plasmas
Impurities [8] play an important role in fusion plasmas. The impurities are mainly produced by sputtering based on the interaction [9] between plasmas and facing in-vessel components, e.g., divertor plates, vacuum vessel wall and radio-frequency antennas. The impurities can be divided into two groups of light impurities, e.g., C, N and O and heavy impurities, e.g., Ti, Fe and W. The light impurities are fully ionized and the heavy impurities are partially ionized in the present high-temperature plasmas because the ionization potential of impurity ions largely increases with the atomic number. At present the light impurity influx is well controlled by carrying out effective wall baking and discharge cleaning. The heavy impurity influx is kept at an extremely low level by installing carbon materials on the vacuum vessel.
Impurity contamination [10] is a critical issue for the fusion devices. The most critical influence of impurities is the radiation loss which leads to degrade the plasma performance. In particular, it is important for the heavy impurities, since the radiation loss quickly increases with the atomic number of impurities. Furthermore, if heavy impurities accumulate [11-12] in the plasma core, the central temperature is easy to drop. The exclusion of the heavy impurities from the plasma core should be also important to obtain the improved confinement such as internal transport barriers (ITBs) [13-14]. On the other hand, the effect of the radiation loss from light impurities on the plasma performance is quite different. The light impurities are fully ionized in the plasma core and the radiation is localized at the plasma edge [15-16]. This is often used to reduce the local heating load on divertor plates and vacuum vessel.
Another important influence of the light impurities is the dilution of the plasma fuel ions which leads to the reduction of the fusion output. The ignition of D-T fusion plasmas can be terminated by the presence of only 3% of carbon. Here, the purity of plasmas is defined by the effective ion charge;
e z
j jz j
z
j jz j
z
j jz j
eff n
Z n Z
n Z n
Z
∑
∑ ∑
== ,
2 ,
, ,
,
2
, , (1.3)
where nj,z is the ion density in a charge state of certain ion species, Zj and ne the electron density. The value of Zeff is more sensitive to the light impurities, since the concentration of light impurities in plasmas is usually much larger than that of heavy impurities. Zeff is
Chapter 1 Introduction
also important in analyzing the plasma resistivity which plays a key role in shaping the plasma current in tokamaks.
1.3 Large Helical Device and impurity research
Large Helical Device (LHD) is the largest superconducting device in the stellarators which consists of a set of l=2 / m=10 continuous helical coils and three sets of poloidal coils, as illustrated in Fig. 1.3. The major specification of LHD is summarized in Table 1.1. LHD is aimed to study the following objectives [17];
a. To achieve high performance steady state plasmas in fusion reactor relevant plasma regime,
b. To solve the existing physical issues in toroidal plasmas c. To contribute fusion technology development.
Major radius 3.6m Averaged plasma radius 0.64m
Plasma volume 30m3 Toroidal magnetic field 2.85T
Table 1.1 Major specifications in standard configuration of LHD device
LHD plasmas are initialized by electron cyclotron heating (ECH) and sustained by hydrogen neutral beam injection (NBI). Working gas is fueled by hydrogen gas puffing for normal discharges (ne≤1014cm-3) and by hydrogen multi-pellets injection for high density discharges (ne≥1014cm-3). Achieved plasma parameters [17] are listed in Table 1.2. For NBI, three tangential beams based on negative ion sources are employed generating total power of 16MW and one perpendicular beam from positive ion sources produces power of 7MW. ECH from three gyrotrons can supply heating power of 3.5MW. Ion cyclotron resonance heating (ICRH) mainly adopted for steady-state operation produces total power of 2.7MW.
5
Chapter 1 Introduction
Table 1.2 Achieved plasma parameters
Central ion temperature 13.5keV (ne=0.3×10¹⁹m-3) Central electron temperature 10keV (ne=0.5×10¹⁹m-3) Central electron density 1.1×10²¹m-3 (Te=0.4keV) Volume averaged beta 5%
Stored energy 1.62MJ
Fusion triple product 5.0×10¹⁹m-3skeV
Fig. 1.3. Schematic of Large Helical Device.
Chapter 1 Introduction
Impurity research is one of the critical issues in the LHD experiments. The main impurity in LHD plasmas is carbon. Most of the carbon influxes are believed to originate from the divertor plates on which the magnetic field lines are touched through divertor legs. Another impurity of iron sometimes appears in some magnetic configurations in which the divertor legs are spread out of the divertor plates. Extrinsic impurities such as neon and argon injected with gas puffing are usually used for ion temperature measurement and those such as titanium, molybdenum and tungsten injected through impurity pellet injector are used for the impurity transport and spectroscopic studies. Two favorable mechanisms on the impurity behavior are found in LHD. Impurity screening [18-19] in the plasma edge region with stochastic magnetic fields, so called ergodic layer, is experimentally verified by analyzing the ratio of CV+CVI to CIII+CIV. The impurity screening could be enhanced by increasing the density and changing the edge stochastic magnetic field structures. The experimental results are well reproduced by the three-dimensional edge transport code, EMC3-EIRENE [20]. On the other hand, impurity hole [21] with extremely hollow carbon profile is observed in high-Ti discharges after carbon pellet injection. Impurity transport [22] has been studied using active method [23] combining impurity pellet injection and high-spatial resolution bremsstrahlung measurement. The diffusion coefficient and the convection velocity are derived through a transport code analysis by minimizing residual errors between the experimental and simulated bremsstrahlung intensities. Several passive methods based on radial profile measurements of X-ray (≤0.5nm) [24] and extreme ultraviolet (EUV: ≤50nm) [25-26] impurity line emissions have been also applied to the impurity transport study in LHD.
1.4 Aim of the present study
Study of the impurity transport is fundamentally important in addition to the determination of the impurity concentration for understanding the impurity behavior perpendicular to the magnetic field and for improving the plasma performance in the field of fusion research. In LHD, high-density operation [27] (ne>1014cm-3) has been achieved in NBI (neutral beam injection) heated plasmas using hydrogen multi-pellets. An alternative direction to the fusion reactor is proposed in such a high-density regime. The study of the impurity content in the high-density regime is important in viewpoint of the increased bremsstrahlung continuum as well as the normal density regime (ne<1014cm-3) with gas puffing. A variety of density profiles, i.e., peaked, flat and hollow profiles, have been observed in LHD under different experimental conditions, in particular, heating power,
7
Chapter 1 Introduction
fueling method, magnetic axis position, while peaked density profiles are commonly observed as the typical case in tokamaks. It indicates that the particle transport in helical plasmas is quite different from that in tokamak plasmas. Impurity transport study is thus greatly interesting in terms of general understanding of toroidal plasmas on the impurity transport. In addition, it is important to investigate the impurity behavior in discharges with hydrogen and impurity pellet injections [28]. Especially, high-ion temperature discharges [29-30] are achieved by negative-ion-based neutral beam injection after impurity pellet injection, in particular, carbon pellet injection.
For the purposes mentioned above, a new diagnostic system for measuring visible bremsstrahlung profile is planned to obtain spatial structures of Zeff in LHD based on visible spectroscopy. In LHD the bremsstrahlung profile has been measured using an interference filter since 1998 when the LHD experiment was started. The diagnostic system [31] consists of photomultipliers and 82 optical fibers in addition to the interference filter with the transmission band of 6.2nm at the central wavelength of 536.6nm. However, the measurement was disturbed by strong line radiation [32] emitted from the thick ergodic layer [33] at plasma edge characterized by stochastic magnetic fields with length from 10 to 2000m and the presence of high density and low temperature plasmas. Therefore, the new bremsstrahlung measurement system is to be developed based on an astigmatism-corrected Czerny-Turner-type visible spectrometer with a short focal length to eliminate strong line emissions and to measure the bremsstrahlung intensity in lower density regime (ne<4×1013cm-3). In order to satisfy such conditions, good spectral and spatial resolutions have to be realized with high throughput of the Czerny-Turner-type visible spectrometer. A flat grating and two spherical mirrors were traditionally used for the Czerny-Turner-type spectrometer to transfer the fiber image to the focal plane. However, the astigmatism was always appeared in such a simple spectrometer system. The output image of the circular- shaped fiber had different focal spot sizes on both meridional and sagittal planes. Cross- talks between neighboring channels became something of a serious problem leading to worse spectral and spatial resolutions. The correction of the astigmatism is necessary in the new spectrometer system. In addition, a compact spectrometer is desired to achieve high throughout and to detect sufficient bremsstrahlung intensity even in low density discharges.
Abel inversion technique based on the magnetic surface geometry is also important to obtain the bremsstrahlung emissivity profile from the measured bremsstrahlung intensity profile. The magnetic surface geometry for nonaxisymmetric plasmas in LHD is calculated by variation moments equilibrium code (VMEC) in three-dimensional space. When the bremsstrahlung intensity profile is flat or hollow, the bremsstrahlung emissivity profile is
Chapter 1 Introduction
much hollowed after the Abel inversion. A large error is easily transferred to the central profile. In order to solve this problem, the iterative method is required assuming a special function suitable for variation of the bremsstrahlung emissivity profile. The uncertainties can be checked taking into account the profiles of bremsstrahlung intensity, chord length and bremsstrahlung emissivity as a function of the normalized radius in high-β plasmas with a large magnetic axis shift.
1.5 Structure of the thesis
In Chapter 2, the principle of Zeff diagnostics based on bremsstrahlung continuum is introduced. The bremsstrahlung emission due to free-free coulomb collisions between electrons and ions in high-temperature plasmas is evaluated in detail. The value of Zeff is defined by three parameters of bremsstrahlung emissivity, electron density and electron temperature.
In Chapter 3, the visible spectrometer system for the Zeff measurement is presented. An astigmatism-corrected Czerny-Turner-type visible spectrometer coupled with a charge- coupled device (CCD) is installed in LHD to measure the visible bremsstrahlung continuum. A 44-fiber parallel array is equipped to observe a full vertical profile in the horizontally elongated plasma cross section. The system is absolutely calibrated with a standard integrated sphere. Spectral images are checked and excellent performance of the present diagnostic system is verified having no astigmatism. Comparison of bremsstrahlung intensity profiles are presented between the new visible spectrometer system and the old interference filter system.
In Chapter 4, conversion method from the line-integrated bremsstrahlung intensity to the local bremsstrahlung emissivity profile is presented. Abel inversion technique is applied for nonaxisymmetric plasmas with finite β. The slice and stack method based on magnetic surface geometries are used for the Abel inversion. The influence of the magnetic surface distortion due to the finite β effect is examined as error estimation with the influence of unclear edge plasma boundary in the ergodic layer.
In Chapter 5, analysis of radial Zeff profile is performed. Zeff profile is calculated through radial bremsstrahlung emissivity profile as well as radial electron density and temperature profiles. The analysis is done for NBI discharges with H2 and C pellet injections as a benchmark estimation, in which the Zeff values should be close to 1 and 6,
9
Chapter 1 Introduction
respectively. After the benchmark test the Zeff profiles are analyzed for peaked, flat and hollow density profiles.
In Chapter 6, the total bremsstrahlung radiation power, by which the upper operational density range in the fusion reactor is practically limited, is evaluated in high- density discharges (ne≥1014cm-3) with hydrogen pellet injection. After comparison of the bremsstrahlung emissivity profiles between the gas-puff and pellet fueled discharges the total bremsstrahlung radiation power is analyzed with electron density, total radiation and deposited NBI power.
In Chapter 7, alternative approach to Zeff profile diagnostic is presented. The radial profile measurement of Zeff using visible bremsstrahlung (530nm) in LHD has often encountered difficulties in several outwardly shifted magnetic configurations because the intensity profile was largely deformed by the nonuniform visible bremsstrahlung emissions. A space-resolved flat-field extreme ultraviolet (EUV) spectrometer is newly adopted to measure the Zeff profile using the EUV bremsstrahlung continuum in the wavelength range of 7.0-7.5nm. The EUV bremsstrahlung intensity profiles are measured and checked for all the magnetic configurations with totally different magnetic field structures in the ergodic layer of LHD. The Zeff profiles measured in the EUV range are compared with those measured in the visible range for inwardly shifted magnetic configurations. The Zeff profile measured from EUV range is presented for outwardly shifted magnetic configurations.
In Chapter 8, the thesis is summarized and concluded.
Chapter 1 Introduction
References
[1] A. D. Sakharov, Plasma Physics and the Problem of Controlled Thermonuclear Reactions, 1961. 1: p. 21.
[2] L. J. Spitzer, D.J. Grove, W. E. Johnson et al., Problems of the Stellarator as a Useful Power Source PM-S-14, USAEC NYO-6074, 1954.
[3] L. A. Artsimovich et al., Proc. 3rd Int. Conf. on Plasma Physics and Controlled Nuclear Fusion Research, 1968. 3: p. 17.
[4] ITER Physics Basis, Nucl. Fusion, 1999. 39: p. 2137.
[5] J. Wesson, "Tokamaks (Third Edition)", Oxford Univ. Press, 2004. [6] J. D. Lawson, Proc. Phys. Soc. B, 1957. 70: p. 6.
[7] A. Iiyoshi et al., Nucl. Fusion, 1999. 39: p. 1245.
[8] C. D. Michelis and M. Mattioli, Rep. Prog. Phys. , 1984. 47: p. 1233.
[9] R. Parker, G. Janeschitz, H. D. Pacher et al., J. Nucl. Mater, 1997. 241-243: p. 1. [10] R. C. Isler, Nucl. Fusion, 1984. 24: p. 1599.
[11] J. Stober et al., Nucl. Fusion, 2003. 43: p. 1265. [12] H. Takenaga et al., Nucl. Fusion, 2003. 43: p. 1235. [13] H. Takenaga et al., Phys. Plasmas, 2001. 8: p. 2217. [14] P. C. Efthimion et al., Nucl. Fusion, 1999. 39: p. 1905.
[15] H. Kubo, S. Sakurai, N. Asakura et al., Nucl. Fusion, 2001. 41: p. 227.
[16] O. Gruber, A. Kallenbach, M. Kaufmann et al., Phys. Rev. Lett. , 1995. 74: p. 4217. [17] A. Komori et al., Nucl. Fusion, 2009. 49: p. 104015.
[18] M. B. Chowdhuri, S. Morita, M. Kobayashi et al., Phys. Plasmas, 2009. 16: p. 062502. [19] M. Kobayashi, Y. Feng, S. Masuzaki et al., Contrib. Plasma Phys., 2008. 48: p. 255. [20] Y. Feng, F. Sardei, J. Kisslinger et al., Contrib. Plasma Phys., 2004. 44: p. 57. [21] M. Yoshinuma, K. Ida, M. Yokoyama et al., Nucl. Fusion, 2009. 49: p. 062002. [22] S. Morita, M. Goto, M. Kobayashi et al., Plasma Sci. Tech., 2009. 11: p. 402. [23] H. Nozato, S. Morita, M. Goto et al., Phys. Plasmas, 2004. 11: p. 1920. [24] S. Muto and S. Morita, Rev. Sci. Instrum., 2001. 72: p. 1206.
[25] M. B. Chowdhuri, S. Morita, M. Goto et al., Rev Sci Instrum, 2007. 78: p. 023501.
11
Chapter 1 Introduction
[26] C. F. Dong, S. Morita, M. Goto and H. Y. Zhou, Rev Sci Instrum, 2010. 81: p. 033107. [27] R. Sakamoto, M. Kobayashi, J. Miyazawa et al., Nucl. Fusion, 2009. 49: p. 085002. [28] R. Katai, S. Morita, M. Goto et al., Jpn. J. Appl. Phys., 2007. 46: p. 3667.
[29] Y. Takeiri, S. Morita, and K. Ikeda et al., Nucl. Fusion, 2007. 47: p. 1078. [30] S. Morita, M. Goto, Y. Takeiri et al., Nucl. Fusion, 2003. 43: p. 899.
[31] H. Nozato, S. Morita, and M. Goto, J. Plasma Fusion Res. SERIES, 2002. 5: p. 442. [32] H. Nozato, S. Morita, and M. Goto, J. Plasma Fusion Res. SERIES, 2006. 7: p. 14. [33] S. Masuzaki, T. Morisaki, N. Ohyabu et al., Nucl. Fusion, 2002. 42: p. 750.
Chapter 2
Principle of Z eff diagnostics
2.1 Bremsstrahlung continuum radiation
Bremsstrahlung continuum radiation is emitted from charged particles accelerated by free-free coulomb collision in high-temperature plasmas. Since the mass of electrons is light in weight, the acceleration of electrons is much more dominant than that of ions for the bremsstrahlung radiation. The electron-electron or ion-ion coulomb collision does not emit the bremsstrahlung radiation. The bremsstrahlung radiation is therefore emitted by only the electron-ion coulomb collision.
The acceleration of electrons due to the electron-ion coulomb collision (see in Fig. 2.1) is expressed by
4 0 2 ,
2
r m e Z m
a F
e i
e πε
=
= (2.1)
where r is the distance between electron and ion, Zi the charge of ion and me the mass of electron. The radiation power emitted from the accelerated electron can be given by the following equation [1];
13
Chapter 2 Principle of Z
effdiagnostics
) , / 1 (
/ ) ( ) (
6 2 2 3
2 2 2
3 0 2
c v
c a v a c P e
− ×
= r − r r
πε (2.2)
where v is the velocity of electron. If
2
⎟⎠
⎜ ⎞
⎝
⎛ c
v << 1, the radiation power can be rewritten by
6 .
2 3 0 2
c a P e
= πε (2.3)
θ hν r
Ion
Electron b
Fig. 2.1. Bremsstrahlung radition from electron-ion coulomb collision
Taking into account the duration of the collision (= 2r/v), the bremsstrahlung radiation power per collision is expressed by the following equation when Eq. (2.1) is substituted into Eq. (2.3);
) . 2 ( 6 2
2 3 0
2 6
v m cr
e Z v
r dP P
e i
= πε
= (2.4)
Integrating Eq. (2.4) over r, the bremsstrahlung radiation power per unit volume is obtained by the following equation;
Chapter 2 Principle of Z
effdiagnostics
∫
== 1 ,
2 24 3 3 2 2
0 2
2 6
r dr m c
e Z n rdr n
dPv n n P
e i i e i
e
brem π π ε
∫
(2.5)where ne and ni are the electron and ion densities, respectively. If the value of r is smaller than the minimum limit, the classical process has to be replaced by the quantum mechanics process. Thus, by considering Maxwellian velocity distribution for charged particles the bremsstrahlung radiation power per collision is expressed by [2];
, 6 exp
3 16
2 2 / 1 2 2 / 1
3 2
6
,λ = ⎜⎜⎝⎛ πe ⎞⎟⎟⎠ e ei iλ ff ⎛−⎜⎜⎝ eλ⎟⎟⎠⎞
brem T
hc T
g Z n n m c
P e (2.6)
where Te is the electron temperature and gff is the free-free gaunt factor. Since various ions in different charge states exist in fusion plasmas, the Eq. (2.6) has to be summed. The bremsstrahlung radiation power per unit volume and per unit wavelength is finally given by
12400) 10 exp(
89 . 1
2 2 / 1
2 28
,λ e λ eλ
ff eff e
brem T T
g Z
P = × n −
−
(W⋅cm-3⋅Å-1), (2.7)
where the units of ne, Te, and λ are given in cm-3, eV and Å, respectively.
2.2 Effective ion charge
Effective ion charge, Zeff, is defined to characterize the impurity content in the fusion plasmas. The Zeff is defined by
, .
2 ,
, ,
,
2 ,
e z
j jz j
z
j jz j
z
j jz j
eff n
Z n Z
n Z n
Z
∑
∑ ∑
== (2.8)
The value of gff, is calculated by Karzas and Latter [3]. It weakly depends on Te and can be approximated by the following relation [4] in the range of 0.03keV ≤ Te≤ 10.0keV;
(2.9) .
35 . 1 e0.15
ff T
g =
From Eq. (2.7), Eq. (2.8) and Eq. (2.9), the Zeff is given by
15
Chapter 2 Principle of Z
effdiagnostics
) . 12400 exp(
10 92 . 3
2
2 35 . 0 , 27
e e
e brem
eff n T
T Z P
λ λ
λ
−
= × (2.10)
According to Eq. (2.10), the Zeff can be calculated from three parameters of bremsstrahlung emissivity, electron density and temperature. The electron density and temperature are measured by Thomson scattering diagnostics [5] in LHD, by which the entire profiles along major radius on the mid-plane can be observed as shown in Fig.2.2. The radial profiles of Te and ne consisting of 200 data positions can be measured with spatial resolution of 1.5~3cm and temporal resolution of 1~100ms. The radial profile of the visible bremsstrahlung emissivity is measured with an absolutely calibrated visible spectrometer system which is explained in the following chapters in detailed.
Fig. 2.2. Arrangement of Thomson scattering diagnostics for observation of horizontally elongated plasma cross-section in LHD.
Chapter 2 Principle of Z
effdiagnostics
References
[1] Z. L. Xiang and C. X. Yu, "High-temperature Plasma Diagnostic Technology", Shang Hai Sci. and Tech. Press, 1982.
[2] W. Finkelnburg and T. Peters, Handbüch der Physik, 1957. 28: p. 79. [3] W. J. Karzas and R. Latter, Astrophys. J. Suppl., 1961. 55: p. 167.
[4] S. Morita and J. Baldzuhn, IPP-report III/199 (Max-Planck-Institut für Plasmaphysik, Garching , Germany, 1994).
[5] K. Narihara, I. Yamada, H. Hayashi et al., Rev. Sci. Instrum., 2001. 72: p. 1122.
17
Chapter 2 Principle of Z
effdiagnostics
Chapter 3
Development of visible spectrometer
system
3.1 Introduction
Effective ion charge, Zeff, is a key parameter for evaluating the impurity content in fusion plasmas. When the Zeff profile is measured in high-temperature plasmas, significant progress can be given for the impurity transport study in addition to the knowledge on the plasma collisionality and the plasma purity [1]. This information is entirely necessary for understanding the transport nature of magnetically confined toroidal plasmas. The Zeff profile diagnostics based on the visible bremsstrahlung continuum measurement is planned in the Large Helical Device (LHD). Up to this day the visible bremsstrahlung continuum has been always measured through an interference filter [2-4] coupled with optical fibers and photomultipliers. However, line emissions [5] existing within the transmission wavelength band of the interference filter have always disturbed the exact diagnostics on visible bremsstrahlung continuum. In LHD, the presence of extremely strong line emissions resulted from low-temperature and high-density plasmas in the thick ergodic layer [6-7], which particularly characterizes the LHD edge plasmas, were a serious problem in the visible bremsstrahlung diagnostics [8]. In order to eliminate the line emission, therefore, an astigmatism-corrected Czerny-Turner-type visible spectrometer coupled with a charge-coupled device (CCD) has been designed in LHD to achieve a good spatial
19
Chapter 3 Development of visible spectrometer system
resolution and high throughput. The visible bremsstrahlung measurement was also measured through a micro-spectrometer [9] in W7-AS, whereas the system has no spatial resolution.
A standard Czerny-Turner-type spectrometer [10-11] is basically characterized by two spherical mirrors which can collimate the incident light against flat grating and transfer the image at the entrance slit to the exit slit. However, the astigmatism [12-14] still remains in such a simple spectrometer system due to different focus spots between meridional and sagittal planes. Focal images are thus deformed resulting in cross-talk between the fiber channels. To solve this problem, a computer-optimized toroidal mirror for correcting the astigmatism is added to the present visible spectrometer. Another requirement for the visible bremsstrahlung diagnostics is that the spectrometer should be bright to detect weak visible bremsstrahlung from low-density plasmas. Therefore, a compact Czerny-Turner- type spectrometer (Model: MK-300, Bunkoh-Keiki Co.LTD) is applied with a focal length of 300mm.
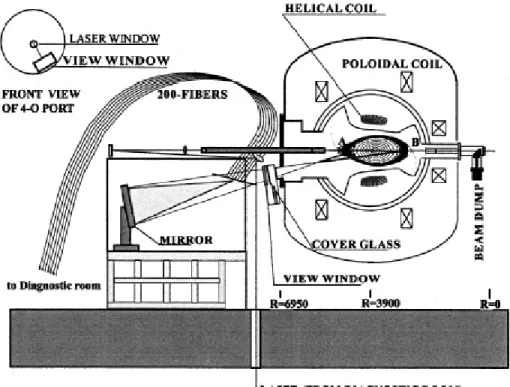
The diagnostic instrument was installed on a large rectangular glass window (220mm in horizontal size and 1300mm in vertical size) of LHD. The visible bremsstrahlung continuum is measured at a horizontally elongated cross section of the LHD elliptical plasmas through a 44-fiber parallel array. A full vertical bremsstrahlung emission profile is thus measured in the range of -0.6m ≤ Z ≤ 0.6m. As a result, the influence of the line emission was entirely removed from the bremsstrahlung continuum analysis. However, the vertical profile of the measured visible bremsstrahlung continuum was unfortunately still nonuniform. In this chapter, the visible bremsstrahlung profile diagnostics in LHD is presented with the study of the nonuniform visible bremsstrahlung emission profile, resulting from the low-temperature and high-density edge plasmas in the ergodic layer.
3.2 Visible spectrometer system
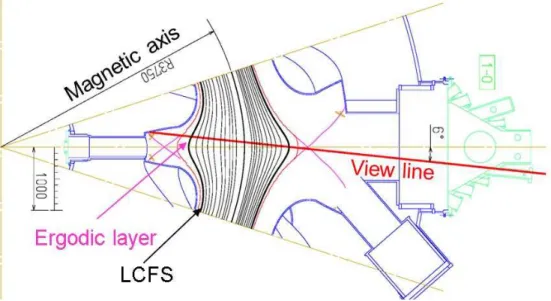
The parallel fiber array is installed on a rectangular glass window port of LHD with a small angle of 6° from the axis perpendicular to the toroidal magnetic filed in order to avoid nonuniform bremsstrahlung emission resulting from the inboard side of the torus, as illustrated in Fig. 3.1. Since the rectangular glass window has enough large vertical size (1300mm×220mm), the full vertical bremsstrahlung profile of LHD plasmas (-0.6m ≤ Z ≤
Chapter 3 Development of visible spectrometer system
FIG. 3.1. Schematic top view of LHD (Rax=3.75m) with view line of fiber array. View angle is tilted by 6° from port center axis perpendicular to toroidal magnetic field.
FIG. 3.2. Magnetic surfaces at horizontally elongated plasma cross section and parallel observation chords of fiber array. R and Z denote major radius and vertical distance from equator plane, respectively. Fiber channels mean sequential numbers of fibers.
21
Chapter 3 Development of visible spectrometer system
0.6m) can be observed using parallel view chords, as shown in Fig. 3.2. The vertical fiber array consists of 44 parallel optical fibers with core and clad diameters of 100μm and 125μm, respectively. An optical lens with the focal length of 30mm set to each fiber defines spatial resolution of 30mm at the plasma center. It is seen in the figure that the ergodic layer near the inboard side x-point, at which the nonuniform bremsstrahlung continuum is strongly emitted, moves to upper side from the equator plane (Z=0) by tilting the observation chord at the small angle of 6°.
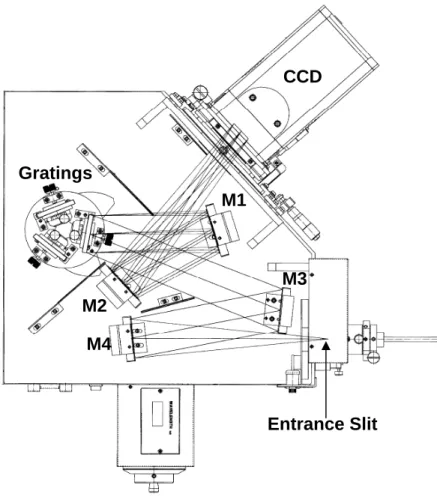
Figure 3.3 shows optical layout of the astigmatism-corrected Czerny-Turner-type visible spectrometer. The visible spectrometer consists of one removable entrance slit, four mirrors, three gratings and three masks. The short focal length of 300mm makes a high throughput optical system. The inner wall of the spectrometer is covered with carbon powder to reduce the visible light reflection. The optical mirrors and gratings are coated with aluminum and magnesium fluoride, respectively. The three masks are used for eliminating the unnecessary scattered light. The removable entrance slit can adjust the slit width in the range of 0-500μm through an external electric controller. The fiber array closely set to the entrance slit is arranged with interval of 128μm between each fiber. As a result, the spectral intensity and resolution can be optimized by choosing an appropriate slit width. The slit width of 60μm is used when a good spectral resolution is required and the slit width of 130μm is used when a high spectral intensity is required. Four mirrors consist of one toroidal mirror (M4), one flat mirror (M3) and two spherical mirrors (M1 and M2), as seen in Fig. 3.3. In particular, the curvature of the toroidal mirror is optimized by a computer simulation which calculates all the possible optical paths. Thus, the astigmatism, which is the main problem in the multi-channel fiber array measurement, can be entirely corrected for both the sagittal and meridional planes. The three gratings of 120, 300, 1200 grooves/mm have different blaze wavelengths of 330nm, 500nm, 200nm, respectively. All the gratings mounted in a rotatable turret can be also controlled by the electric controller. Among them, the 300 grooves/mm grating is usually used in the experiment to measure the wavelength interval of 450-600nm with the central wavelength of 530nm. In this case a wider wavelength range of 200nm to 900nm can be observed by changing the central wavelength.
The CCD (Andor SOLIS-DU934N) is adopted as a 2-dimensional detector for recording output images at the focal position. The size of CCD is 13.3mm × 13.3mm with 1024 pixels × 1024 pixels and the size of unit pixel is 13μm × 13μm. The CCD is usually cooled at the temperature of -20°C to reduce the thermal noise and operated in full-image and multi-track modes. The full-image mode is used to check the spectral and spatial
Chapter 3 Development of visible spectrometer system
resolutions by accumulating enough counts with long exposure time. The multi-track mode is set for the routine experiment making vertical 12 pixels into one through the binning to improve signal-to-noise ratio and time resolution. The CCD is then usually operated at the exposure time of 31ms and the time resolution of 100ms with vertical readout speed of 11 μs/line and horizontal readout time of 0.4 μs/pixel. A little higher time resolution of 80ms is alternatively used with the exposure time of 12ms according to the discharge waveform. The exposure time can be precisely defined by use of a mechanical shutter mounted in front of the CCD the motion of which is synchronized with the CCD operation.
CCD
M1
M2 M4 Gratings
M3
Entrance Slit
FIG. 3.3. Optical layout of 300mm astigmatism-corrected Czerny-Turner-type visible spectrometer (M1: spherical mirror, M2: spherical mirror, M3: flat mirror, M4: toroidal mirror).
23
Chapter 3 Development of visible spectrometer system
3.3 System calibration
The spectral resolution of the visible spectrometer is checked by the line emission at wavelength of 546nm from a standard mercury lamp. Figure 3.4 shows the spectral resolution for three different gratings as a function of the entrance slit width. The spectral width, Δλ, is defined as the full width at half maximum (FWHM) of the line spectrum. The slit width of 60μm improves the spectral resolution to about 35% compared to the case of the 130μm slit width. The spectral resolution seems to improve linearly with the groove density. The 1200 grooves/mm grating is used to check the presence of line emissions within the wavelength interval to be measured.
0.1
1
10
60 80 100 120 140
(n m)
Entrance slit width ( μ m)
120 G/mm
300 G/mm
1200 G/mm
Δλ
FIG. 3.4. Spectral resolution, Δλ, at FWHM for three gratings as a function of entrance slit width. Solid squares, solid circles and solid diamonds indicate 120 grooves/mm, 300 grooves/mm and 1200 grooves/mm gratings, respectively.
Chapter 3 Development of visible spectrometer system
Absolute sensitivity calibration of the present diagnostic system is performed with an integrating sphere using the same optical system as the actual measurement. The efficiency of the three gratings for different entrance slit widths is absolutely calibrated in the wavelength range of 450-600nm (510-550nm for 1200 grooves/mm grating), as plotted in Fig. 3.5. The variable, ds, denotes the width of the entrance slit. The 300 grooves/mm grating shows the best sensitivity resulting from the large effective ruled area and the optimum braze wavelength. The sensitivity of 1200 grooves/mm grating is less in two orders compared to other two gratings. The 300 grooves/mm grating is therefore favorable to the present purpose as well as the 120 grooves/mm grating, since the bremsstrahlung emission is very weak in low-density discharges. The entrance slit width of ds = 130μm is also better for the present measurement, because the sensitivity of the optical system is increased by 50% compared with that of ds = 60μm.
1200 G/mm (ds=60μm) 1200 G/mm (ds=130μm)
120 G/mm (ds=60μm) 120 G/mm (ds=130μm) 300 G/mm (ds=60μm) 300 G/mm (ds=120μm)
1
10
100
1000
450 500 550 60
10 -7 W. m -2 .n m -1 .sr . -1 s -1 /( co u n ts .s -1 )
Wavelength (nm)
0
3
FIG. 3.5. Absolute sensitivities of three gratings with different grooves for two entrance widths, ds, in wavelength range of 450-600nm.
25
Chapter 3 Development of visible spectrometer system
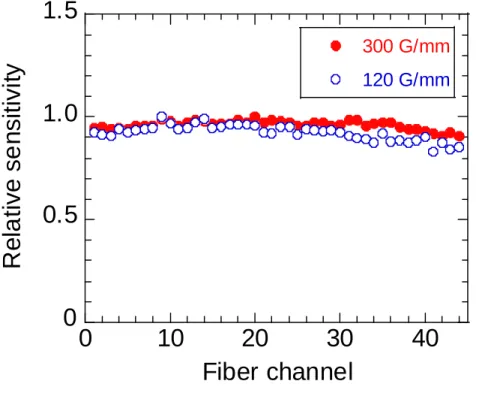
The relative sensitivity among fiber channels is examined with the integrating sphere. Figure 3.6 shows the result for the 120 grooves/mm and 300 grooves/mm gratings. The data measured at the central wavelength of 530nm are normalized by the intensity at the central chord of #22. The sensitivity profile for the 300 grooves/mm grating is relatively flat indicating the sensitivity difference within 10% to the central chord intensity, whereas the 120 grooves/mm grating has a scattered sensitivity profile. As a result, we conclude that the 300 grooves/mm grating is the best choice for the present study.
0
0.5
1.0
1.5
0 10 20 30 40
300 G/mm 120 G/mm
R e la ti ve se n s it ivi ty
Fiber channel
FIG. 3.6. Relative sensitivities of two gratings for fiber channels from 1 to 44. Sensitivity is normalized to central channel.
Chapter 3 Development of visible spectrometer system
3.4 Experimental results
3.4.1 Images and spectra
The output images are recorded by the CCD operated in the full-image mode. The 300 grooves/mm grating is used at the central wavelength of 480nm. The entrance slit is fully opened to check the fiber image. The results shown in Fig. 3.7 trace all the fiber images of Hβ 486.13nm, CIII 465.15nm and OII 459.59nm. The image of each fiber chord is clearly isolated indicating negligible crosstalk between adjacent channels, which leads to an excellent spatial resolution in the present diagnostic system. It is also examined that the well-defined good images are not entirely deformed when the wavelength is changed. The good focal image is resulted from the corrected astigmatism, in particular, by use of the toroidal mirror. Since the size of the images and the interval between the images are constant, a fixed vertical binning value can be used for the multi-track mode in the CCD operation.
FIG. 3.7. Output CCD images against wavelength and fiber channel with 300 grooves/mm grating at central wavelength of 480nm. Images of Hβ 486.13nm, CIII 465.15nm and OII 459.59nm are clearly visible.
27
Chapter 3 Development of visible spectrometer system
0
1
2
3
4
5
6
7
10
4c o u n ts /c h H β 48 6 .13
CI II 4 6 5 .1 5 O II 45 9. 59 C II 51 4. 5
(a)
0
1
2
3
450 500 550 600
10
4c o unt s /c h
Wavelength (nm)
H β 48 6. 13
C II I 46 5 .15 O II 45 9. 59 C II 51 4. 5 CI I 5 6 4 .8
(b)
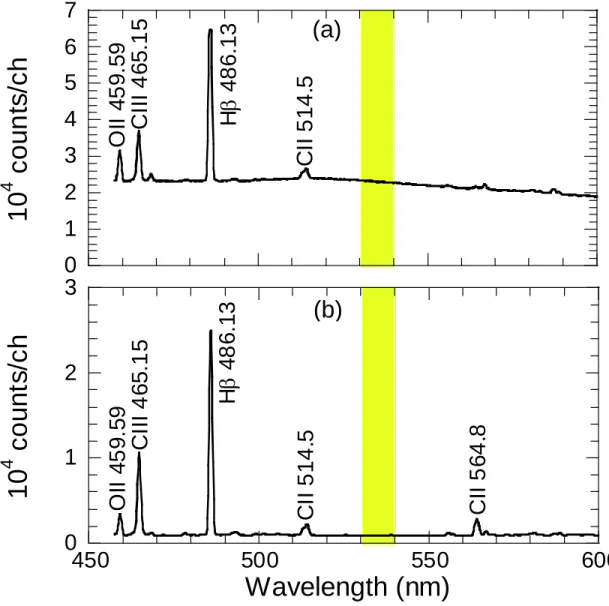
FIG. 3.8. Typical visible spectra in wavelength range of 450-600 nm at Z = 26mm for (a) ne = 2.9 × 1014cm-3 and (b) ne = 2.0 × 1013cm-3. Hatched areas indicate spectral region (530-540nm) for bremsstrahlung continuum measurement.
Chapter 3 Development of visible spectrometer system
The visible spectra are measured with the 300 grooves/mm grating at the central wavelength of 530nm. Figure 3.8(a) shows a typical visible spectrum measured at high- density discharge with ne = 2.9 × 1014cm-3. The spectral interval of 530-540nm used for the bremsstrahlung profile measurement is indicated with the hatched area. The absence of line emissions in this region is always confirmed using the 1200 grooves/mm grating. The bremsstrahlung continuum intensity is quite strong in such high-density discharges, e.g., 2.3 × 10⁴ counts/ch, where the well-known line emission such as Hβ 486.13nm easily saturates at 65,536counts in the present 16bit CCD detector. The bremsstrahlung intensity is, on the other hand, very weak at low density discharge with ne = 2.0 × 1013 cm-3, as seen in Fig. 3.8(b), e.g., 0.1 × 10⁴ counts/ch. We have to say, however, the counts for the bremsstrahlung continuum are still enough for the analysis. These results demonstrate high performance of the present diagnostic system.
3.4.2 Bremsstrahlung intensity profile
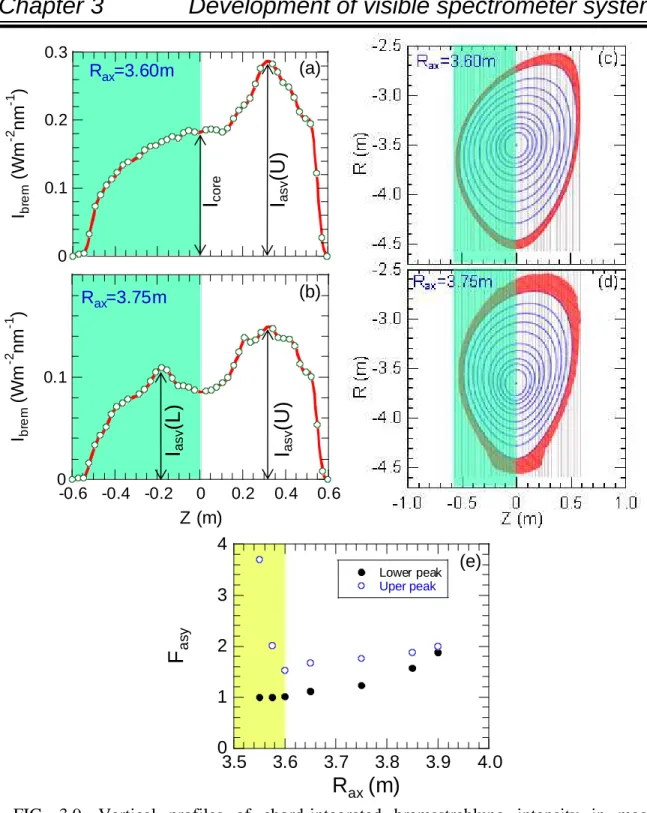
A typical profile of the chord-integrated bremsstrahlung emission is measured at standard magnetic configurations of Rax = 3.60m and Rax = 3.75m in LHD, as shown in Figs. 3.9 (a) and (b), respectively. Nonuniform bremsstrahlung emission peak is clearly seen in the upper half profile (0 ≤ Z ≤ 0.6m). Here, we define the values of Icore, Iasy(U)and Iasy(L) as the chord integrated bremsstrahlung intensity at center (Z = 0) and the maximum intensities at upper half and lower half (-0.6 ≤ Z ≤ 0m), respectively. In the upper half profiles the peak position is found at Z = 0.32m. Hatched areas in the two figures denote the lower half region. In the case of Rax = 3.60m, however, the lower half profile is monotonic, whereas in case of the Rax = 3.75m, an nonuniform emission peak is also appeared at Z = -0.18m. For understanding the reason, the magnetic surface structures are plotted in Figs. 3.9 (c) and (d) with structures of the ergodic layer, which is characterized by the presence of thick stochastic magnetic field layer surrounding the last closed flux surface (LCFS). The thick ergodic layer is located in particular at the regions near X-points in the inboard and outboard sides of the torus, where the magnetic flux density is very high. Then, the nonuniform bremsstrahlung profile appeared in the upper half indicates the presence of low-temperature and high-density plasma at the region around the inboard or outboard side X-point. The magnetic configuration dependence of the nonuniform bremsstrahlung profile is further checked as a function of the plasma axis position. The maximum intensity relative to the central chord intensity, 'nonuniform factor', Fasy, defined as the ratio of Iasy(U)/ Icore or Iasy(L)/Icore, is here introduced. It characterizes the intensity increase in the chords lying further away from the central chord. Figure 3.9(e) displays the
29