The roles of vesicular GABA transporter
during embryonic development
Kenzi Saito
Doctor of Philosophy
Department of Biosystems Science
School of Advanced Sciences
The Graduate University for Advanced Studies
2010
CONTENTS
CONTENTS ... i
ABBREVIATIONS ... iv
ORIGINAL PUBLICATION ... v
SUMMARY ... vi
Background ... 1
1 Summary of inhibitory neurotransmission ... 1
2 VGAT ... 4
2.1 Molecular characteristics ... 4
2.2 Energy-dependence of VGAT ... 5
2.3 Expression of VGAT ... 7
3 Involvement of GABA in development of non-neural tissues ... 8
3.1 Morphogenic role of inhibitory neurotransmission ... 8
4 Non-vesicular release ... 10
4.1 Tonic inhibition ... 10
4.2 Control of the extracellular GABA level ... 11
4.3 Reverse transport of GAT-1 ... 11
5 GABA in circuit formation ... 12
AIMS of the STUDY ... 14
MATERIALS AND METHODS ... 15
1 Animals ... 15
1.1 Construction of the Targeting Vector ... 15
1.2 Creation of a VGAT knockout allele ... 16
1.3 GAD67 knockout mice ... 16
2 Western blotting ... 17
3 Histology ... 17
4 Measurement of extracellular GABA concentrations and patch-clamp recordings in forebrain slice ... 18
5 Electrophysiological recordings in spinal cord ... 20
6 In situ hybridization of conditional VGAT knockout mouse ... 21
6.1 Tissue preparation ... 21
6.2 RNA probes ... 22
6.3 In situ hybridization ... 22
RESULTS ... 24
1 Generation of conditional VGAT mice ... 24
2 Generation of VGAT mice ... 29
3 Birth defects of VGAT mice ... 31
3.1 Omphalocele and Cleft palate ... 31
3.2 Immobility and lower body weight in VGAT fetuses ... 33
3.3 Reduction of trapezius muscle, hepatic congestion and decrease of alveolar spaces in VGAT fetuses ... 35
3.4 Changes of neurotransmitter levels in forebrain ... 38
4 VGAT-independent GABA release in the forebrain ... 40
4.1 Lack of inhibitory synaptic transmission in VGAT KO striatal neurons ... 40
4.2 Presence of VGAT-independent GABA release in VGAT forebrains ... 40
4.3 Tonic conductance in VGAT KO striatal neurons ... 41
5 Functional formation of VGAT KO spinal cord circuit ... 43
6 Comparison of developmental deficits between VGAT KO and GAD67 KO mice ... 49
DISCUSSION ... 51
1 Increase in overall GABA and glycine contents in VGAT forebrains ... 51
3 VGAT KO mice and motor circuit formation ... 54
4 Differences in phenotypic severity between GAD67 and VGAT mice ... 55
5 Developmental defects of non-neural tissues in mice with impaired inhibitory neurotransmission ... 56
CONCLUSION ... 59
ACKNOWLEDGEMENTS ... 60
REFERENCES ... 61
ABBREVIATIONS
AMPA -amino-3-hydroxy-5-methyl-4-isoxazolepropionic acid AP-5 D-2-amino-5-phosphonovaleric acid
CNQX 6-cyano-7-nitroquinoxaline-2,3-dione
CNS central nervous system
Ctrl control
DR dorsal root
GABA -aminobutyric acid
GABAAR GABAA receptor
GABAT GABA transaminase
GAD glutamic acid decarboxylase
GAT GABA transporter
GlyR glycine receptor
IPSCs inhibitory postsynaptic currents KCC K+-Cl- cotransporter
KO knockout
MNs motoneurons
NKCC Na+- K+-2Cl- cotransporter
NMDA N-methyl-D-aspartate
NSCLP non-syndromic cleft lip with or without cleft palate
PCR polymerase chain reaction
SNPs single nucleotide polymorphisms
SVs synaptic vesicles
VGAT vesicular GABA transporter
VIAAT vesicular inhibitory amino acid transporter VMAT vesicular monoamine transporter
VGluT vesicular glutamate transporter VAChT vesicular acetylcholine transporter
VR ventral root
ORIGINAL PUBLICATION
This thesis is based on the following original article and on some unpublished results. The article has been included at the end of the book.
Kenzi Saito, Toshikazu Kakizaki, Ryotaro Hayashi, Hiroshi Nishimaru, Tomonori Furukawa, Yoichi Nakazato, Shigeo Takamori, Satoe Ebihara, Masakazu Uematsu, Masayoshi Mishina, Jun-ichi Miyazaki, Minesuke Yokoyama, Shiro Konishi, Koichi Inoue, Atsuo Fukuda, Manabu Fukumoto, Kenji Nakamura, Kunihiko Obata, and Yuchio Yanagawa. The physiological roles of vesicular GABA transporter during embryonic development: a study using knockout mouse. Molecular Brain 2010 Dec 30; 3: 40
SUMMARY
This thesis describes the generation and analysis of vesicular GABA transporter (VGAT) KO mice to elucidate the functional role of VGAT during embryonic development. I have four main points of discussion: (1) generation of VGAT KO mice, (2) morphological defects in the VGAT KO mice, (3) VGAT-independent GABA release, and (4) spinal circuit formation in the absence of VGAT.
In the mammalian central nervous system, inhibitory neurons release GABA and glycine as neurotransmitters. In GABAergic neurons, GABA is synthesized from glutamate by two glutamic acid decarboxylases (GADs), GAD65 and GAD67. GABA is transported into synaptic vesicles (SVs) by a VGAT and is released from axon terminals by Ca2+-dependent exocytosis. GABA activates either ionotropic GABAA or metabotropic GABAB receptors, which localize to either pre- or post-synaptic membranes. The activation of the receptors is terminated by the reuptake of GABA into axon terminals and/or glial cells by plasma membrane GABA transporters (GATs). As GABA and glycine share the same vesicular transporter and VGAT is thought to be the only vesicular transporter for inhibitory amino acids, VGAT is essential for inhibitory neurotransmission via SVs.
Recent gene KO studies on inhibitory neurotransmission have elucidated not only essential roles in neural functions but also an unexpected contribution to development of non-neural tissue. For example, deletion of the GAD67 gene leads to a non-neural developmental defect, cleft palate, and loss of VGAT results in cleft palate as well as omphalocele. Omphalocele is a herniation of the gut and liver through the umbilical ring. These studies have offered a conditional gene
KO technique for further understanding the role of inhibitory neurotransmission. (1) Conditional VGAT mice based on the Cre/loxP system were generated. The conditional VGAT mice were crossed with mice expressing Cre recombinase in germ cells to obtain VGAT KO mice. Western blotting revealed the VGAT protein to be successfully eliminated from the VGAT KO brain. In addition, VGAT KO mice exhibited substantial increases in overall GABA and glycine, but not glutamate, levels in the forebrain, while the expression of GABA-synthesizing enzymes did not differ between controls and KOs.
(2) Although previous studies elucidated that the deletion of genes related to inhibitory neurotransmission leads to unexpected developmental defects such as cleft palate and omphalocele, rather less attention has been paid to other developmental abnormalities. To further explore the role of inhibitory neurotransmission in proper embryonic development, a comprehensive histological analysis was performed in controls and KOs.
VGAT KO mice were dead at birth, and had a cleft palate and omphalocele, confirming previously reported phenotypes. Their body weight at embryonic day (E) 18.5 was significantly lower than that of wild-type littermates. Histological examination revealed a decrease in trapezius muscle mass, hepatic congestion, and little alveolar space in the VGAT KO mice.
(3) In the last two decades, there is increasing evidence of neurotransmission outside synapses. Non-vesicular release is thought to be involved in this process. However, since it remains unclear to what extent the vesicular release contributes to the amount of GABA released, it is important to determine whether GABA is present in the extracellular space in the VGAT KO brain. To this end, whether or not GABA release could be confirmed in VGAT KO brain was investigated.
At first, GABAAR-mediated synaptic currents were recorded using a whole-cell patch-clamp method. Electrophysiological recordings from E17.5 striatal neurons showed that the VGAT KO mice exhibited no spontaneous miniature inhibitory postsynaptic currents (IPSCs), suggesting the absence of vesicular release in the striatum. To investigate the presence of non-vesicular GABA release and the reversal of GAT-1, the amounts of GABA released from the forebrain slices were quantified. The slices were incubated in a small chamber containing artificial cerebrospinal fluid (ACSF) with or without a GAT-1 inhibitor, nipecotic acid, and the amount of GABA released into the ACSF was measured by HPLC. Without nipecotic acid, the amount of GABA in ACSF did not differ between controls and KOs. Blocking GAT-1 by nipecotic acid increased the amount of GABA in the ACSF. These results indicate that GABA can be released by VGAT-independent non-vesicular mechanisms in the embryonic mouse forebrain and that the plasma membrane GAT does not release, but rather than recovers the extracellular GABA.
(4) There is increasing evidence that GABA and glycine have neurotrophic effects in the developing nervous system, in which synapse formation are still immature. In such a situation, inhibitory neurotransmission must act non-synaptically. However, it is debatable whether or not vesicular GABA release is required for the neural circuit formation. To explore this issue, the responses to dorsal-root stimulation were examined in the control and VGAT KO mice.
Spontaneous IPSCs were absent in spinal cord motoneurons of VGAT KO mice. However, electrical stimulation of the dorsal root evoked excitatory, but not inhibitory, responses in the motoneurons. The latency of this excitatory response was similar to that of the control preparations. These results indicate that the
glycine-mediated synaptic responses. VGAT KO mice at E17.5-18.5 were completely immobile and stiff, and none of them responded to mechanical stimuli by pinching of the tail. Therefore, the lack of inhibitory transmission to motoneurons in VGAT KO mice likely resulted in defects in the spontaneous and stimulus-induced movements in vivo.
This study provides evidence that VGAT has an essential role not only in GABA- and/or glycine-mediated neurotransmission but also in embryonic development. Another significant achievement of this study is the generation of conditional VGAT mice. This provides an opportunity to further understand roles of GABAergic neurotransmission. For example, distinct groups of inhibitory neurons contain different peptides and different calcium-binding proteins. Different classes of inhibitory neurons have precise patterns of axon targeting. These distinct subtypes of inhibitory neurons appear to contribute to specific functions in the brain. The conditional VGAT mouse provides a new tool to study the subtype-specific and circuit-specific role of inhibitory neurons in brain functions.
Background
1 Summary of inhibitory neurotransmission
Figure 1 provides an overview of GABAergic neurotransmission. In GABAergic neurons, GABA is synthesized from glutamate by two glutamic acid decarboxylases (GADs), GAD65 and GAD67. GABA is transported into synaptic vesicles by a vesicular GABA transporter (VGAT) and is released from axon terminals via Ca2+-dependent exocytosis. GABA activates either ionotropic GABAA or metabotropic GABAB receptors, which are localized to either pre- or postsynaptic membranes. The activation of the receptors is terminated by the reuptake of GABA into axon terminals and/or glial cells by plasma membrane GABA transporters (GATs)
Whereas GABA is ubiquitous in the central nervous system, glycine is best known as an inhibitory neurotransmitter in the brainstem and spinal cord. As GABA and glycine share VGAT for vesicular transport (Wojcik et al., 2006), GABAergic or glycinergic phenotype is specified by the cytosolic availability of GABA or glycine. Indeed, GABA and glycine can be coreleased from the same vesicles (Jonas et al., 1998; Kotak et al., 1998). As virtually all GABA is synthesized by GAD65 and GAD67 in embryonic brain (Ji et al., 1999), it is certain that these specify the GABAergic phenotype. On the other hand, specifying the glycinergic phenotype appears to require vigorous cytosolic accumulation even though glycine is a structural unit that makes up proteins. The key component is GlyT2, a plasma membrane transporter for glycine in neurons (Supplisson and Roux, 2002). Glycinergic neurotransmission was not detected in GlyT2 KO mice (Gomeza et al., 2003). In the development of the
trapezoidal body (MNTB) to the lateral superior olive (LSO) changes from GABA-dominant to glycine-dominant. In this synapse, the corelease of GABA and glycine from the same vesicles was observed, and the developmental decrease in GABAergic components appeared to parallel a decrease in GAD65 and GAD67 expression (Nabekura et al., 2004).
The effects of GABAA and glycine receptor activation largely depend on the intracellular Cl concentration. In mature neurons, Cl equilibrium potential is more negative than the resting membrane potential for a relatively low intracellular Cl concentration. Therefore, the activation of GABAA and glycine receptors causes Cl influx, leading to membrane hyperpolarization. This low Cl concentration is mostly due to the activity of potassium-chloride cotransporter 2 (KCC2), which exports the Cl (Delpire, 2000).
In certain circumstances, however, the activation of GABAA and glycine receptors induces membrane depolarization (Ehrlich et al., 1999; Gao and Ziskind-Conhaim, 1995; Owens et al., 1996; Singer et al., 1998; Stein and Nicoll, 2003; Wu et al., 1992). In immature neurons, the expression of KCC2 is low and instead the expression of Na- and K-coupled cotransporter 1 (NKCC1) is high. Since NKCC1 promotes the Cl accumulation, the Cl concentration is high enough for Cl efflux via GABAAR activation, leading to membrane depolarization (Delpire, 2000).
Figure 1. An overview of GABAergic neurotransmission.
2 VGAT
2.1 Molecular characteristics
The rodent VGAT cDNAs were identified by two separate groups based on genetic studies of C. elegans. unc-47 of C. elegans had been predicted to function in the storage of GABA in presynaptic terminals (McIntire et al., 1993). In 1997, the same group predicted the amino acid sequence of the UNC-47 protein and identified its rat homologue. They further demonstrated that the rat unc-47 homologue expressed in PC12 cells has a substantial ability to accumulate GABA. Finally, they concluded that the unc-47 homologue is a vesicular GABA transporter (McIntire et al., 1997).
Sagné et al. independently identified a mouse VGAT cDNA based on a C. elegans genomic sequence covering unc-47. They also pointed out that VGAT mRNAs are localized to both GABAergic and glycinergic neurons in rat brain and VGAT-transfected cells significantly accumulated GABA and glycine. Conclusively, they denominate VGAT as VIAAT, short for “vesicular inhibitory amino acid transporter” (Sagné et al., 1997).
According to Ebihara et al. (2003), the mouse VGAT gene is extremely compact, spanning about 4.7 kb. The gene consists of three exons interrupted by two introns. They also proposed that there is an alternative splicing variant of VGAT. However, Oh et al. (2005) insisted that VGAT is composed of two exons and that the splicing variant is an artifact of PCR.
Exon 1 encodes a large, hydrophilic N-terminal domain and exon 2 and 3 encode a nine/ten-transmembrane domain and the C-terminal domain. Based on computer predictions, McIntire et al. (1997) suggested that VGAT has a cytosolic
localization for both N- and C-termini and a ten-transmembrane topology. Recently, using epitope-specific antibodies, Martens et al. (2008) proposed that the C-terminus faces the vesicle lumen and VGAT has a nine-transmembrane domain.
In this study, I planned to insert loxP sites into intron 1 and 3’-downstream of exon 2 and 3. As described above, since exon 2 and 3 encode a putative transmembrane domain, VGAT should be inactivated by Cre-dependent recombination of this region.
2.2 Energy-dependence of VGAT
Prior to the molecular cloning of vesicular transporters, the neurotransmitter uptake mechanism had been studied in purified SVs extracted from the brain. Driving force for neurotransmitter uptake into SVs is produced by a vacuolar H-ATPase (V-ATPase), which raises a proton electrochemical gradient (H+). H+ is constituted of two components, the membrane potential () and the pH gradient (pH). Glutamate and monoamine (e.g. dopamine, serotonin, and noradrenalin) uptake predominantly depends on (Bellocchio et al., 2000; Takamori et al., 2000a) and pH (Varoqui and Erickson, 1996), respectively. GABA and glycine uptake, however, is driven by both and pH, because the accumulation partially inhibited when is reduced or pH is dissipated (Hell et al., 1991; Hell et al., 1990). Since GABA and glycine are neutral amino acids, the coupling of GABA uptake with a proton antiport (Hell et al., 1991) had been expected to be accompanied by the efflux of positive charge or influx of negative charge. Indeed, GABA and glycine uptake is Cl-dependent (Hell et al., 1990; Kish et al., 1989). Recently, Juge et al. (2009) used reconstituted proteoliposomes containing VGAT to demonstrate that VGAT is a Cl-GABA co-transporter. Figure
2 shows thermodynamics of VGAT.
Figure 2. The stoichiometry of vesicular GABA/glycine transport. The vesicular uptake of one neurotransmitter is coupled with one proton antiport. V-ATPase charges positively and acidified SVs, providing the driving force for neurotransmitter uptake. A Cl- symport can provide an electrical shunt for efficient proton transport.
2.3 Expression of VGAT
After the molecular cloning of VGAT, development of an antibody specific to the VGAT elucidated its distribution. VGAT is localized to both GABAergic and glycinergic, but not glutamatergic, neuronal terminals (Chaudhry et al., 1998; Dumoulin et al., 1999; Takamori et al., 2000a).
The first evidence that VGAT/VIAAT is not expressed in non-neuronal tissues came from McIntire et al. (1997), who detected the 2.5-kb mRNA transcript in the brain, but not in twelve non-neuronal tissue samples (liver, kidney, lung, heart, gut, pancreas, spleen, ovary, testis, adrenal, muscle, and skin) by Northern blotting. However, they described that VGAT/VIAAT was detected in spleen, testis, and pancreas by RT-PCR. Later, several studies reported that VGAT/VIAAT was expressed in the pancreas (Chessler et al., 2002; Hayashi et al., 2003), pituitary (Mayerhofer et al., 2001), and testis (Geigerseder et al., 2003).
In the rat cerebral cortex, VGAT expression was low at birth, increased gradually through the first and second postnatal weeks and then achieved the adult pattern during the third postnatal week (Minelli et al., 2003). Using whole-mount in situ hybridization, Oh et al. (2005) reported that the VGAT mRNA is first detected at E10 in the ventral mesencephalon, hindbrain, and spinal cord and is widespread throughout the CNS at E11.5. These regions include the medial ganglionic eminence, a major source of cortical interneurons.
3 Involvement of GABA in development of non-neural tissues
3.1 Morphogenic role of inhibitory neurotransmission
GABA was first suggested to be a morphogen from studies on the teratogenic effect of diazepam over 30 years ago, where maternally-administered diazepam induced cleft palate in the offspring (Miller and Becker, 1975). Subsequent studies confirmed that GABA itself suppresses palatogenesis in utero and in culture (Tocco et al., 1987; Wee and Zimmerman, 1983; Zimmerman, 1985). Further indications that GABAergic transmission has morphogenic roles come from studies with KO mice, in which genes related to inhibitory neurotransmission are deleted. However, there is a discrepancy between the old studies and recent genetic studies.
GAD67. Two independent studies found that the GAD67 KO mice exhibited a cleft palate without other craniofacial malformations (Asada et al., 1997; Condie et al., 1997). Cleft palate is an anomaly with unfused palatal shelves. GAD65 KO mice do not have such developmental defects (Asada et al., 1996; Kash et al., 1997).
GABRB3. The involvement of GABA in morphogenesis is further strengthened by cleft palate in mice lacking the GABAAR 3 subunit, GABRB3 (Homanics et al., 1997). The 3 subunit is widely distributed in the embryonic and adult brain (Fritschy et al., 1994; Laurie et al., 1992; Pirker et al., 2000). Although nineteen GABAAR subunits have been cloned, there are no reports of similar developmental defects in KO mice lacking the other subunits (Boehm et al., 2004;
Vicini and Ortinski, 2004).
KCC2. Hubner et al. (2001) reported that KCC2 KO mice display omphalocele, a herniation of abdominal organs through the umbilical ring. KCC2 is required for GABA- and/or glycine-induced hyperpolarizing responses (Delpire, 2000). In the KCC2 KO mice, GABAergic and/or glycinergic neurotransmission continued to act in an excitatory, but not an inhibitory, manner. In addition to having omphalocele, KCC2 KO mice could not breathe properly and had lung atelectasis, a lack of gas in alveoli (Hübner et al., 2001).
VGAT/VIAAT. During the course of the present study, it was reported that VGAT KO mice display a cleft palate and omphalocele (Wojcik et al., 2006).
These studies not only provide new insight into the roles of inhibitory neurotransmission in non-neural tissue development, and they also shed light on the need for a conditional gene KO strategy to avoid the developmental influences frequently seen in conventional KO mice.
4 Non-vesicular release
4.1 Tonic inhibition
In research into inhibitory neurotransmission, considerable attention has focused on fast and precisely timed inhibitory neurotransmission, phasic inhibition. In phasic inhibition, postsynaptic GABAARs are activated by exposure to a high concentration of neurotransmitter via synaptic release (Owens and Kriegstein, 2002b). In the last two decades, there has been increasing interest in tonic inhibition, in which GABAARs primarily located outside synapses can be activated by a low concentration of extracellular neurotransmitter and are less desensitized (Farrant and Nusser, 2005). Tonic inhibition can be seen in cerebellar granule cells (Brickley et al., 1996; Chadderton et al., 2004; Hamann et al., 2002; Kaneda et al., 1995; Rossi et al., 2003; Wall and Usowicz, 1997), hippocampal CA1 interneurons (Semyanov et al., 2003) and pyramidal cells (Demarque et al., 2002; Glykys and Mody, 2007), dentate gyrus granule cells (Maguire et al., 2005; Stell and Mody, 2002), striatal GABAergic projection neurons (Ade et al., 2008), neocortical pyramidal neurons and interneurons (Olah et al., 2009), and olfactory bulb mitral cells (Wu et al., 2007). The nature of tonic inhibition varies with the area of the brain investigated and developmental stage. While tonic currents are usually investigated in slice preparations or cultured neurons, their detection in cerebellar granule cells in vivo proves that the phenomenon is not an artifact of in vitro preparations (Chadderton et al., 2004). Tonic currents are usually measured as the difference in currents between the absence and presence of GABAAR blockers. The properties of the source that releases the GABA responsible for tonic inhibition can be examined using various
treatments. As vesicular GABA accumulation and the subsequent release require
H+ across the vesicle membrane and Ca2+ influx, respectively (see section 2.2), the currents in the presence of a H+ dissipater or under Ca2+-free conditions could essentially be considered non-vesicular GABA release.
4.2 Control of the extracellular GABA level
Tonic inhibition is influenced by the extracellular amount of GABA. The amount is regulated by a buffering system (Cherubini and Conti, 2001; Glykys and Mody, 2007). Once released, GABA diffuses throughout synaptic cleft until it is taken up by plasma membrane transporters. High-affinity transport systems in the neuronal and glial membranes terminate the activation of GABAARs and keep the extracellular neurotransmitter concentration low.
4.3 Reverse transport of GAT-1
While VGAT is located in the vesicular membrane and acts on transmitter storage into SVs, GATs distribute to the cell membrane of neurons and astrocytes and take up transmitters from the extracellular space. The uptake of GABA takes place in parallel with the co-transport of two sodium ions and one chloride ion into the cell (Kanner, 2006; Lu and Hilgemann, 1999). As reviewed in section.1, GATs are the most effective component of the GABA buffering system. However, a high intracellular sodium concentration could theoretically lead to the reversal of GATs (Attwell et al., 1993), and the reverse transport by GATs may be an important source of extracellular GABA.
Wu et al. investigated non-vesicular GABAergic transmission in cultured hippocampal neurons. They found that GABAergic transmission was not inhibited by four different methods generally used to block vesicular release. This
non-vesicular transmission was intensively blocked by GAT-1 antagonists, thus suggesting that GAT-1 actively releases GABA (Wu et al., 2007). Demarque et al. found tonic GABAAR activation in developing hippocampal CA1 pyramidal neurons, in which synaptic contacts has not formed. In contrast to Wu et al., they showed that the tonic currents were not sensitive to a GAT-1 inhibitor, through the cellular mechanism of this tonic inhibition could not be defined (Demarque et al., 2002). Findings that do not support the involvement of GAT reverse transport have come from the GAT1 KO mouse. In this mouse, tonic currents were enhanced, suggesting that GAT-1 operates to recover the extracellular GABA (Jensen et al., 2003). Many researchers have reported that the tonic currents are enhanced rather than suppressed by GAT-1 blockers (Demarque et al., 2002; Olah et al., 2009; Rossi et al., 2003; Semyanov et al., 2003; Wall and Usowicz, 1997). Although the significance of reverse transport by GAT-1 is still controversial, it is certain that GAT-1 influences tonic inhibition by controlling extracellular GABA levels.
5 GABA in circuit formation
It has been widely recognized that GABA and glycine have a trophic role in the developing CNS (Ben-Ari, 2002; Ganguly et al., 2001; Kandler et al., 2002; Owens and Kriegstein, 2002b; Tapia et al., 2001; Varju et al., 2001). During the brain development, transmitter-evoked electrical activity is functional despite the immature synapse formation. As mentioned, GABA evokes the membrane depolarization in immature neurons, which is sufficient to cause Ca2+ influx (Ben-Ari, 2002; Ganguly et al., 2001; Liu et al., 2006; Owens et al., 1996). The percentage of neurons exhibiting an increase in Ca2+ in response to GABA gradually declines during neuronal development (Ganguly et al., 2001; Liu et al.,
2006). Using cultured neurons from embryonic rats, Ganguly et al. (2001) showed that this developmental transition of GABAergic action from depolarizing to hyperpolarizing is indeed mediated by GABA itself. They also showed that the transition was delayed by the blocking of GABAARs and correlated with an increase in KCC2 expression. Liu et al. (2006) observed similar phenomena in cultured chick neurons. Furthermore, GABAergic and/or glycinergic signals are involved in neural circuit formation in the retina (Blankenship and Feller, 2010). In contrast, the blocking of GABAergic and glycinergic transmission in spinal cord explants from rat embryos had little effect on the differentiation of the membrane properties of motoneurons (Xie and Ziskind-Conhaim, 1995). Also, despite the negligible presence of GABA in the brain, GAD65 and GAD67 double KO mice appeared to have a normal brain histology: the formation of the cerebellar Purkinje cell layer, and the growth of axons and dendrites occurred normally (Ji et al., 1999).
AIMS of the STUDY
The aims of this thesis are to establish conditional VGAT KO mice and to investigate the physiological roles of VGAT during embryonic development. The following are the specific aims.
(1) Although previous studies elucidated that the KO mice of genes related to inhibitory neurotransmission can lead to cleft palate and omphalocele, rather less attention has been paid to other developmental defects. To further explore the role of inhibitory neurotransmission in embryonic development, a comprehensive histological analysis was performed with controls and KOs.
(2) Although there is no doubt that synaptic neurotransmission is a basic form of inhibitory communication, there is increasing evidence of non-vesicular GABA release and tonic inhibition. However, since it remains unclear to what extent vesicular release contributes to the overall amount of GABA released, it is important to determine whether GABA is present in the extracellular space in the VGAT KO brain. To this end, whether or not GABA is released in the VGAT KO brain was investigated.
(3) Although the outstanding research with cultured VGAT KO neurons by Wojcik et al. showed that VGAT has a dominant role in the storage of GABA and glycine into SVs, it is unclear whether functional neural circuits are formed without vesicular GABA and glycine release. The functional importance of VGAT to the circuit formation was examined using electrophysiological recordings from the spinal cord.
MATERIALS AND METHODS
1 Animals
All animal procedures were conducted in accordance with the guiding principles of the NIH under the review and approval of the Animal Care and Use Committee of the Animal Care and Experimentation Committee, Gunma University, Showa Campus (Maebashi, Japan). Every effort was made to minimize the number of animals used and their suffering.
1.1 Construction of the Targeting Vector
Genomic BAC clones containing the mouse VGAT (mVGAT) locus were purchased, and the regions covering the entire VGAT gene were subcloned (Ebihara et al., 2003). A genomic fragment spanning exons 1-3 of the mVGAT gene was used for the targeting vector (Figure 3; targeting vector). The HindIII (in the 5’-flanking region) - KpnI (in the 3’-flanking region) fragment (7.5 kb) was subcloned into pBluescript II KS(-), and the 5’-loxP site was introduced into the XbaI site (in intron 1). The 5’-loxP site was flanked by a KpnI site artificially introduced for Southern blot analysis. The 7.5-kb fragment was used as the 5’ homologous region containing the 5’-flanking region, exons 1-3, and the 3’-flanking region. The frt-flanked phosphoglycerate kinase (PGK) promoter-driven neomycin-resistance gene (PGK-Neo) cassette for positive selection of ES clones and the 3’-loxP site were inserted into the KpnI site (in the 3’-flanking region). The KpnI-BstEII fragment in the 3’-flanking region (3.5 kb) was added as the 3’ homologous region. An MC1-DT-ApA cassette for negative selection (Yanagawa et al., 1999) was ligated to the 3’ end of the homologous region.
1.2 Creation of a VGAT knockout allele
The linearized targeting vector was introduced by electroporation into ES cells (CCE) of 129/SvEv mouse origin, and G418-resistant colonies were screened by Southern blot analysis using probes outside of the targeting vector. KpnI-digested genomic DNA prepared from ES cell colonies was hybridized with 5’ probes. The correctly targeted ES clones were injected into C57BL/6 blastocysts to produce germline chimeras. The germline chimeras were mated with C57BL/6 mice to establish the VGATfloxneo/+ mouse line. VGATfloxneo/+ mice were crossed with CAG-Cre mice (Sakai and Miyazaki, 1997) to excise exons 2 and 3 (VGAT knockout allele), and VGAT mice were obtained. Then VGAT mice were intercrossed to generate VGAT mice. When timed matings of the VGAT mice were performed, the morning of the day the vaginal plug was detected was designated E0.5.
Genotypes of VGAT, VGAT and VGAT mice were determined by PCR using the following oligonucleotides: primer P1 (5’-AGTCTGATCCCGTGGCACTTCCAACTC-3’) corresponding to intron 1 of the VGAT gene and primers P2 (5’-TCAGAGGCTTCTTCCTAGGGCTGCTG-3’) and P3 (5’-GACCTCCCCCATTGCATAGAATGGCAC-3’) corresponding to the 3’-flanking region of the VGAT gene. The primer set of P2 and P3 amplified a 183-bp fragment specific for the wild-type allele, and the primer set of P1 and P3 yielded a 430-bp fragment specific for the KO allele.
1.3 GAD67 knockout mice
Homozygous GAD67-GFP (neo) (GAD67GFP/GFP) mice were used as GAD67 KO (GAD67) mice. The generation of the GAD67-GFP (neo) mice and their genotyping by PCR were described previously (Kaneko et al., 2008;
Tamamaki et al., 2003). In the GAD67-GFP (neo) mice, a cDNA encoding enhanced green fluorescent protein (EGFP) followed by an SV40 polyadenylation signal was targeted to the locus encoding GAD67 by homologous recombination, and the GAD67 gene was disrupted.
2 Western blotting
Homogenates prepared from E18.5 mouse brain were separated by 7.5% SDS-polyacrylamide gel electrophoresis, transferred to nitrocellulose membrane (Whatman, Maidstone, UK), and probed with antibodies specific for VGAT (1:1000) (Takamori et al., 2000b), GAD65/67 (1:1000) (Asada et al., 1996), synaptophysin (1:1000) (Synaptic Systems, Goettingen, Germany), and -actin (1:10000) (Abcam, Cambridge, UK). After the membranes were washed with Tris-HCl buffered saline containing 0.05% (w/v) Tween 20, the bound antibodies were visualized with horseradish peroxidase-conjugated goat anti-mouse IgG or anti-rabbit IgG (Jackson ImmunoResearch Laboratories, West Grove, PA) using the ECL Western blotting detection system (GE Healthcare, London, UK). Protein levels were quantified using Light Capture and its software (ATTO, Tokyo, Japan). Expression levels were normalized to -actin or synaptophysin levels, and the values are expressed as means ± SE. Statistical significance was assessed using Student’s t-test.
3 Histology
VGAT, VGAT and VGAT mice at E18.5 were investigated. Samples were fixed in 10% (vol/vol) formaldehyde, dehydrated with a graded series of ethanol solutions, and embedded in paraffin. Three-micrometer-thick sections were prepared, immersed in xylene to remove the paraffin, rehydrated, and
stained with hematoxylin-eosin. VGAT and VGAT mice were mixed together and are referred to as control mice.
4 Measurement of extracellular GABA concentrations and patch-clamp recordings in forebrain slice
Coronal slices were obtained from E17.5 mice. Pregnant mice were deeply anesthetized through inhalation of halothane, and the brain was rapidly removed from the embryo and placed in cold (4°C), oxygenated, modified artificial cerebrospinal fluid (ACSF). The solution contained 220 mM sucrose, 2.5 mM KCl, 1.25 mM NaH2PO4, 12.0 mM MgSO4, 0.5 mM CaCl2·2H2O, 26.0 mM NaHCO3, and 30.0 mM glucose (330-340 mOsm). Coronal slices (400 µm) were cut in modified ACSF using a vibratome (VT-1000; Leica, Wetzlar, Germany). The slices were kept in oxygenated standard ACSF consisting of 126 mM NaCl, 2.5 mM KCl, 1.25 mM NaH2PO4, 2.0 mM MgSO4, 2.0 mM CaCl2, 26.0 mM NaHCO3 and 20.0 mM glucose with 95% O2-5% CO2 at room temperature.
Whole cell patch-clamp recordings were performed as previously described (Yamada et al., 2007). The slices were transferred to a recording chamber on the stage of a microscope (BX51; Olympus, Tokyo, Japan) and continuously perfused with oxygenated, standard ACSF at a flow rate of 2 ml/min and 32°C. Striatal neurons in the slices were viewed on a monitor via a 40x water-immersion objective lens with an infrared differential interference contrast (IR-DIC) filter and a CCD-camera (ORCA-ER C4742-95; Hamamatsu Photonics, Hamamatsu, Japan).
Patch electrodes were fabricated from borosilicate capillary tubing 1.5 mm in diameter (GD-1.5, Narishige, Tokyo, Japan) using a pipette puller (P-97; Sutter Instrument, Novato, CA). The electrode resistance ranged from 6 to 8 M.
The pipette solution contained 130 mM CsCl2, 2 mM MgCl2, 0.5 mM EGTA, 10 mM HEPES, 3 mM MgATP, and 0.4 mM GTP (pH 7.3 with CsOH). Membrane currents and membrane potentials were recorded using an Axopatch 700A amplifier and digitized at 2 kHz by a Digidata 1332A data-acquisition system (Axon Instruments, Union City, CA). Data were acquired using pClamp9 (Axon Instruments) software and stored on a hard disk for off-line analysis using Clampfit9 (Axon Instruments). Series resistance compensation was not applied. Whole cell recordings were performed in the voltage-clamp mode (Vh = -60 mV) in the presence of the AMPA/kainate receptor antagonist 6-cyano-7-nitroquinoxaline-2,3-dione, (CNQX; Tocris, Ellisville, MO) (10 µM), the NMDA receptor antagonist D-2-amino-5-phosphonovaleric acid (AP-5; Tocris) (50 µM), the GABAB receptor antagonist CGP55845 (Tocris) (3 µM), and tetrodotoxin (TTX; Wako, Osaka, Japan) (0.3 µM). All drugs were applied by superfusion or pressure application from a micropipette in the vicinity of the recorded neurons. Values of amplitudes and interevent intervals in mIPSCs are expressed as means
± SD.
Extracellular GABA and taurine concentrations were measured by HPLC. Slices were kept for 1 hour in oxygenated ACSF for recovery. Two coronal slices were then transferred to a submerged-type small chamber (1.5 ml volume) filled with filtered ACSF (Minisart; Sartrius, Göttingen, Germany) and aerated with 95% O2-5% CO2. The slices were incubated for 1h at 37ºC in ACSF with or without nipecotic acid (300 µM), and 120 µl of supernatant was collected and stored at -80 ºC for HPLC.
GABA and taurine concentrations were measured by HPLC with an electrochemical detection system (ECD-300 series; Eicom, Kyoto, Japan) as
was injected by an autoinjector (M231XL; Gilson, Lewis Center, OH) with a 20-l sample loop. A 5-µm ODS column (150 x 3 mm, Eicom) was used as the analytical column and kept at 30 ºC in a column oven (ATC-300; Eicom). The mobile phase consisted of 60 mM NaH2PO4・2H2O, 9.6 mM Na2HPO4・12H2O, 0.015 mM EDTA・ 2Na, and 30% methanol at pH 6.0. The mobile phase was filtered through 0.45-µm membrane filters and degassed with a degasser (DG-300, Eicom). A flow rate of 0.5 ml/min was maintained using an isocratic pump (EP-300, Eicom). Data were recorded on a data processor (EPC-300, Eicom), and sample concentrations were determined by comparing the peak areas with an external standard. Total GABA, glycine, and glutamate levels in the E18.5 mouse forebrain were measured as described previously (Fujii et al., 2007; Tamamaki et al., 2003).
The drugs used were SR95531 (Sigma, St. Louis, MO) and nipecotic acid (Sigma).
5 Electrophysiological recordings in spinal cord
Embryos (E17.5-18.5) of control (VGAT; n = 19, VGAT; n = 12) and VGAT (n = 30) mice were decapitated and eviscerated, and the spinal cord was removed by ventral laminectomy. The isolated spinal cord was placed in a recording chamber perfused with oxygenated Ringer’s solution (118.4 mM NaCl, 3 mM KCl, 2.52 mM CaCl2, 1.25 mM MgSO4, 25 mM NaHCO3, 1.18 mM KH2PO4, and 11.1 mM D-glucose aerated with 5% CO2 in O2) at room temperature. Recordings from motoneurons (MNs) in the isolated spinal cord were performed as described previously (Nishimaru et al., 2005). Briefly, visually guided whole-cell tight-seal recording of MNs was performed with patch electrodes pulled from thick walled borosilicate glass to a final resistance of 5-8 M. The electrode tips were filled with 138 mM K-gluconate, 10 mM HEPES, 1 mM CaCl2,
5 mM ATP-Mg, and 0.3 mM GTP-Li. Intracellular signals were amplified with a Multiclamp 700B amplifier (Molecular Devices, Union City, CA), digitized at 5 kHz with the Digidata 1440A data acquisition system (Molecular Devices) and saved on a hard disk for off-line analysis. Electrical recordings and the stimulation of lumbar ventral roots (VRs) were performed using glass suction electrodes. MNs were identified visually as cells with large soma in the ventral horn and by observing the antidromic firing activated by the electrical stimulation of the adjacent VR. Extracellular signals of MNs through the VRs were amplified 10,000 times and bandwidth-filtered at 0.1-3000 Hz with an AC amplifier (World Precision Instruments Inc., Sarasota, FL). Dorsal roots (DRs) were electrically stimulated (a single pulse: 100 µs duration, 50-500 µA in intensity) at 10-sec intervals by a glass-suction electrode placed in close proximity to the DR ganglia. All drugs (CNQX, AP5, strychnine, picrotoxin and bicuculline; Sigma-Aldrich, St. Louis, MO) were dissolved in Ringer's solution and bath-applied to the preparation. Analysis was performed using pClamp 10 software (Molecular Devices). Summary statistics report the mean ± SE unless otherwise specified.
6 In situ hybridization of conditional VGAT knockout mouse
6.1 Tissue preparation
The brain was quickly removed, embedded in OCT compound (Sakura finetek), and frozen in 2-methylbutane pre-cooled by liquid nitrogen. Blocks were stored at -80°C until use for cryosectioning. Ten or 20 µm-cryosections were mounted on silane-coated slides, and air-dried. Slides were kept at -80°C until processing for in situ hybridization.
6.2 RNA probes
Specific primers for VGAT were designed based on the cDNA sequences of VGAT and GAD67, respectively. Digoxigenin (DIG) -labeled transcripts were synthesized using an RNA labeling kit (Roche) by in vitro transcription. The specificity of these probes was proven by sense strand hybridization.
6.3 In situ hybridization
After postfixation in 4% paraformaldehyde-PBS followed by three washes with PBS, sections were acetylated for 10 min in 0.25% acetic anhydride in 0.1 M triethanolamine-HCl. After three washes in PBS, the section were preincubated for 1 h at 72°C with hybridization buffer in a chamber humidified with 1 x saline sodium citrate (SSC)(150 mM NaCl and 15 mM sodium citrate), and 50% formamide. The sections were then hybridized for 12-24 h at 72°C with 1 ng/µl of DIG-labeled probe for VGAT or GAD67 in the hybridization buffer. The sections were next treated at 72°C with the following solutions: (1) for 15 min and 30 min with 1 × SSC, 50%(v/v) formamide; and (2) for 30 min with 0.1 × SSC. After two brief washes with Tris-buffered saline (TBS)(100 mM Tris-HCl[pH 7.5], 150 mM NaCl) and one 5-min wash with TNT buffer (100 mM Tris-HCl[pH 7.5], 150 mM NaCl, and 0.05% Tween 20), the sections were put in blocking solution containing 1% blocking reagent (Roche) in TNT buffer for 10 min, and then incubated with alkaline phosphatase-labeled anti-DIG antibody (Roche) in the blocking solution for 1-2 h at room temperature. Following two brief washes with TBS and one 5-min wash with TNT buffer, the sections were pre-equilibrated with AP buffer (100 mM Tris-HCl[pH 9.5], 150 mM NaCl, and 10 mM MgCl2). The coloring reaction was carried out in AP buffer containing 225 µg/ml of nitroblue tetrazolium (NBT) and 525 µg/ml of 5-bromo-4-chloro-3-indolyl phosphate (BCIP)
at room temperature with shading. The reaction was terminated by rinsing the sections in distilled water. Following rapid dehydration through an ascending ethanol series and clearing in xylene, the slides were coverslipped with Mount Quick (Daido Sangyo).
RESULTS
1 Generation of conditional VGAT mice
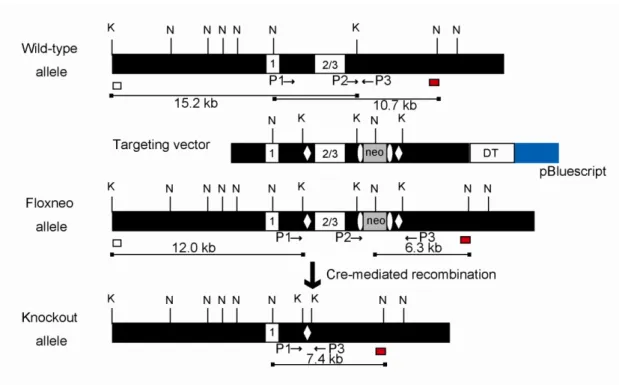
The targeting strategy used for the generation of VGAT KO mice is shown in Figure 3. Exons 2 and 3 encode the putative transmembrane domain and C-terminus of the VGAT protein (Ebihara et al., 2003; Sagné et al., 1997), and accordingly, the deletion of these regions was expected to destroy the function of the protein. Selection markers have been shown to affect gene expression. To enable removal of the selection marker, a PGK-Neo cassette flanked by frt sites was inserted into the 3’-flanking region, which can be removed with Flp recombinase. The advantage of this strategy is that it can be done in vivo, after germline transmission of the target allele, and the excision does not disturb the loxP-flanked region. Correctly targeted ES cell clones were microinjected into blastocysts to generate chimeric mice. These mice were then crossed with C57BL/6 mice to generate heterozygous mice carrying one floxneo allele (VGATfloxneo/+ mice).
VGATfloxneo/floxneo mice were born at the expected frequency, did not have a cleft palate or omphalocele, and were overtly indistinguishable from their wild-type littermates. Western blotting showed that the level of VGAT protein in VGATfloxneo/floxneo brains was no different from that in wild-type brains. These results suggest that a loxP sequence and a frt-flanked PGK-neo gene inserted into intron 1 and the 3’-flanking region of the VGAT gene, respectively, do not affect the expression of the VGAT protein (Figure 4A, B). The absence of the PGK-Neo cassette also did not show any influence on the VGAT expression either (data not shown). However, it is unknown whether two kind of conditional VGAT alleles have the same level of efficiency of recombination or not.
To establish whether the VGATfloxneo allele is useful for the conditional inactivation of the VGAT gene, VGATfloxneo/floxneo mice were crossed with mice in which Cre recombinase is driven by the Gng7 promoter (Gng7Cre) to obtain VGATfloxneo/floxneo; Gng7Cre/+ mice (referred to this as conditional KO mice). Gng7, the G protein 7-subunit, is most highly expressed in GABAergic projection neurons in the striatum (Wang et al., 2001; Watson et al., 1994). In Gng7Cre mice, the Cre recombinase gene is knocked in Gng7 locus. Cre recombinase activity was found predominantly in the caudate-putamen, nucleus accumbens, and olfactory tubercle (Kishioka et al., 2009).
Conditional KO mice survived postnatally and had no obvious developmental defects. The loss of VGAT expression was monitored by in situ hybridization using a DIG-labeled VGAT RNA antisense probe. In control striatum, VGAT gene expression gradually increased during the first postnatal week. No such expression pattern was observed in the KO striatum (Figure 5). Furthermore, conditional KO mice showed severe motor deficits including hindlimb clasping, postural instability, and abnormal locomotor activity, consistent with a pivotal role for GABAergic projection neurons in motor control (Bolam et al., 2000; DeLong, 1990; Grillner et al., 2005). These observations indicate that the conditional VGAT mice established in this study would be useful for investigating various aspects of VGAT function during development and adult neurotransmission. In addition to solving the problem of perinatal lethality, the conditional VGAT mice can now be crossed to a mouse that express Cre recombinase in a region- and cell type-specific manner, providing the opportunity for manipulation of specific neuronal circuits.
Figure 3. VGAT targeting strategy.
Exons are represented by numbered white boxes. LoxP sites (open diamonds) and a PGK-Neo cassette (neo; gray box) flanked by the frt sites (open ellipses) were introduced into the wild-type VGAT locus by homologous recombination to produce the floxneo allele. The probes used for Southern blot analysis are indicated as white (5’ probe) and red (3’ probe) boxes. The expected sizes of the KpnI- and NcoI-digested genomic DNA fragments hybridized with the 5’ and 3’ probes, respectively, are indicated as lines under the schemes. Relevant restriction sites are indicated as follows: K, KpnI; N, NcoI. PCR primers are indicated as arrows.
Figure 4. VGAT expression is normal in adult VGATfloxneo/floxneo and VGAT
mice.
Figure 5. Striatum-specific deletion of VGAT.
Three control (upper panels) and three KO (lower panel) mouse brains were processed for in situ hybridization at postnatal day (P) 1, 3, and 5. Representative images are shown. VGAT mRNA expression gradually increased in the control striatum, while no such change was observed in the KO striatum. See the signal in septum as a reference for comparison. Abbreviations: St, striatum; Cx, cortex; Sep, septum. Scale bar = 500 m.
2 Generation of VGAT mice
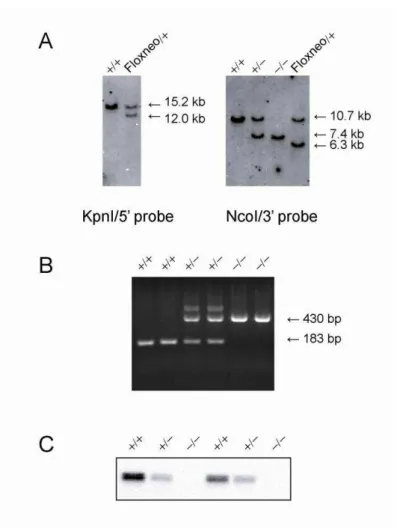
The VGAT KO allele generated by crossing VGATfloxneo/+ mice with CAG-Cre mice, in which Cre recombinase is expressed ubiquitously (Sakai and Miyazaki, 1997). Genotyping was performed by Southern blot analysis (Figure 6A) and PCR (Figure 6B), and the DNA sequences around the loxP site in the KO allele were also confirmed (data not shown). VGAT mice were viable and developed normally to adulthood, except that their VGAT levels were reduced by about half (Figure 4C, D). To obtain homozygous VGAT KO (VGAT) mice, the VGAT mice were intercrossed. Western blot analysis revealed that no VGAT protein was expressed in the E18.5 VGAT brain, whereas VGAT expression in the VGAT mouse brain was reduced to about half of the WT level (Figure 6C).
Figure 6. Disruption of the mouse VGAT gene
(A) Left, Southern blot analysis of KpnI-digested genomic DNA isolated from VGAT () and VGATfloxneo/+ (Floxneo/+) mice using the 5' probe indicated in Figure 3. The wild-type allele corresponds to the 15.2-kb band, whereas the floxneo allele corresponds to the 12.0-kb band. Right, Southern blot analysis of NcoI-digested genomic DNA isolated from VGAT (), VGAT (), VGAT (), and VGATfloxneo/+ (Floxneo/+) mice using the 3' probe indicated in A. The wild-type allele, knockout allele, and floxneo allele correspond to the 10.7 kb, 7.4 kb, and 6.3 kb bands, respectively.
(B) Genotyping of offspring from intercrosses of VGAT+/- mice by PCR. Three primers were used (see Methods). Primers P2 and P3 produce a 183- bp fragment that represents the wild-type allele, whereas P1 and P3 produce a 430-bp fragment that represents the knockout allele.
(C) Western blot analysis of E18.5 whole brain homogenates from VGAT (), VGAT (), and VGAT () mice using an anti-VGAT antibody directed against an N-terminal epitope. VGAT expression was completely abolished in VGAT mice ().
3 Birth defects of VGAT mice
3.1 Omphalocele and Cleft palate
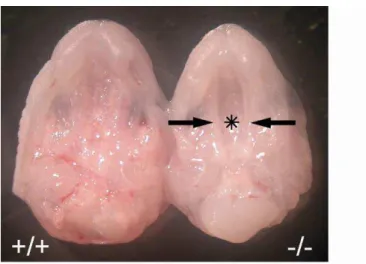
All E18.5 VGAT fetuses displayed a cleft palate (Figure 7) and omphalocele (Figure 8), phenotypes consistent with those described by Wojcik et al. (2006).
Figure 7. Cleft palate in VGAT mice
Ventral views of the upper jaw of E18.5 VGAT () and VGAT () mice. In contrast to the completely fused palate of VGAT mice, the secondary palatal shelves of VGAT mice do not contact each other (arrows), and the nasal cavity (asterisk) could be seen.
Figure 8. Omphalocele in VGAT mice
(A) Lateral views of E18.5 VGAT () and VGAT () mice. An arrow indicates omphalocele containing protruded organs in the VGAT mouse. In addition, the VGAT mouse showed an extremely hunched position in contrast to the VGAT mouse.
(B) Ventral view of the E18.5 VGAT mouse.
3.2 Immobility and lower body weight in VGAT fetuses
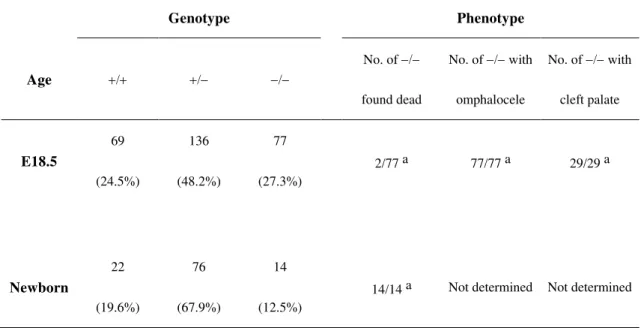
No VGAT mice survived beyond birth (Table 1). To estimate the time of death, we performed timed matings of the VGAT mice and obtained the fetuses via cesarean section. Among the E18.5 offspring derived from the intercrosses, VGAT fetuses were obtained at the expected Mendelian ratio (27.3%, 77 VGAT of 282 littermates) and more than 97% (75 of 77) were alive (as judged by umbilical beats or heartbeats, Table 1). When delivered by cesarean section on E18.5, both VGAT (7 of 7) and VGAT (11 of 12) fetuses began respiration, but none of the VGAT fetuses (n = 7) began to breathe, suggesting that VGAT mice died at birth due to respiratory failure.
The body weight of the E18.5 VGAT fetuses was significantly lower than that of VGAT and VGAT fetuses (VGAT: 1.18 0.11 grams, n = 17; VGAT: 1.20 0.08 grams, n = 45; VGAT: 1.05 0.11 grams, n = 32 [mean SD], P < 0.001, one-way ANOVA, post hoc Fisher’s least significant difference test), indicating that VGAT mice exhibit growth retardation.
The hunched posture of the VGAT mice (Figure 8) suggests neuromotor dysfunction. To evaluate the neuromotor function of E18.5 fetuses, a tail pinching test was performed. VGAT (n = 16) and VGAT (n = 53) fetuses responded to the pinching with a twisting of the trunk. However, no such response was observed among the VGAT fetuses (n = 16), suggesting severely impaired neuromotor function.
Table 1. Genotypes of offspring from intercrosses of VGAT mice and phenotypes of VGAT mice
Genotype Phenotype
Age
No. of found dead
No. of with omphalocele
No. of with cleft palate
E18.5
69
(24.5%)
136
(48.2%)
77
(27.3%)
2/77 a 77/77 a 29/29 a
Newborn
22
(19.6%)
76
(67.9%)
14
(12.5%)
14/14 a Not determined Not determined
a affected/examined
3.3 Reduction of trapezius muscle, hepatic congestion and decrease of alveolar spaces in VGAT fetuses
In previous studies on VGAT mutant mice, rather little attention has been paid to developmental defects other than cleft palate and omphalocele. To further explore the morphogenic function of VGAT, a comprehensive histological analysis was conducted.
Through the histological analysis of multiple tissues, marked changes were found in the trapezius muscle, ribs, liver, and lung. First, as can be seen in Figure 9A and B, trapezius muscle was thinner in VGAT fetuses than in the control fetuses. This result may be attributable to the stretching of the trapezius muscle due to the hunched posture of the fetus. However, it actually appears to be due to atrophy because the same phenotype was found when control and VGAT fetuses were sampled with care to keep similar posture. Second, the lower ribs were depressed, and their position was retracted toward the inside compared to the control (Figure 9C, D). Furthermore, the spaces between each rib appeared narrower in the VGAT mice (Figure 9C, D). Third, not only omphalocele (Figure 8) but also hepatic congestion was characteristic of VGAT embryos (Figure 9E, F). Together with the penetration of the abdominal cavity by the rib, it is obvious that VGAT liver is under external pressures. This indicates an increase in intra-abdominal pressure in VGAT fetuses. These results imply the hunched posture to be caused by an imbalance between the dorsal and ventral muscle strength, but it could not be ruled out that the thin trapezius muscle results from continuous stretching. Although omphalocele can be caused by a malformation of the ventral body wall (Brewer and Williams, 2004), the rectus abdominis muscle showed no apparent abnormality in VGAT mice (data not shown). Finally, the
(Figure 9G, H), indicating that the lungs had not been dilated. Consistent with the report by Fujii et al. (2007), who observed impairment of the respiratory network in VGAT KO mice, the VGAT mice lacked autonomous and joggling-induced breathing movements. A possible cause of atelectasis is reported to be a defect in the diaphragm (Baertschi et al., 2007). However, histological examination did not detect any difference in the diaphragm between the VGAT and control mice.
The alterations in the VGAT muscle, liver and lung were likely caused by the loss of VGAT in the CNS, but not the loss of VGAT in the peripheral tissue, because VGAT transcripts were detected in brain and spinal cord, but not in muscle, liver, or lung (McIntire et al., 1997; Sagné et al., 1997).
(Next page) Figure 9. Histological analysis of VGAT mice
(A, B) The trapezius muscle (bounded partly by white dashed lines) was thinner in VGAT mouse (B) than control mice (A). Scale bar: 200 µm. (C, D) The lower VGAT ribs (arrow in D) were depressed, and positioned on the inside compared to the control ribs (arrow in C). H, heart; L, liver.
(E, F) Red blood cell congestion was characteristic of VGAT liver, but not control liver. Scale bar: 200 µm.
(G, H) The VGAT lung contained much less alveolar space than the control lung. Scale bar: 500 µm.
Figure 9
3.4 Changes of neurotransmitter levels in forebrain
As neurons are not capable of de novo synthesis of the neurotransmitters glutamate and GABA from glucose, they depend on glial cells for the supply of glutamine as the glutamate precursor (Bak et al., 2006). In addition, the system for degrading both GABA and glycine is mainly localized to glial cells (Cherubini and Conti, 2001; Sato et al., 1991). Thus, the metabolism of neurotransmitters is closely linked between neurons and glial cells. Given that loss of VGAT should impair the packing of GABA and glycine into SVs and the subsequent synaptic release, the neurotransmitter metabolism may be affected in VGAT mice.
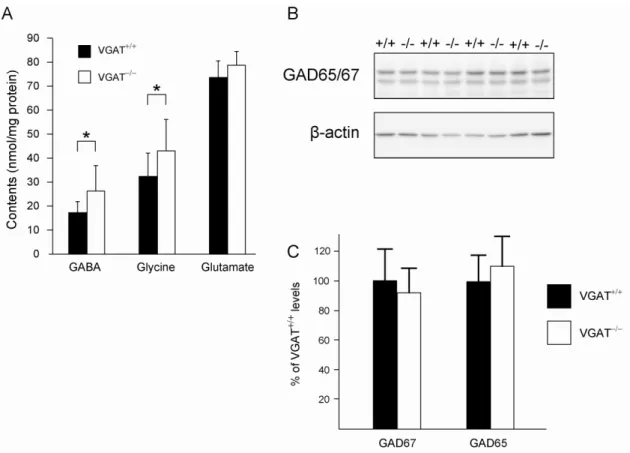
To study whether the deletion of VGAT changes GABA/glycine levels, we measured the amount of the neurotransmitters GABA, glycine and glutamate in E18.5 VGAT forebrain by HPLC. As shown in Figure 10A, VGAT fetuses showed significant increases in GABA and glycine, but not glutamate, compared to VGAT fetuses. To test whether the increase in GABA was due to the elevated expression of GABA-synthesizing enzymes, I analyzed the expression of GAD65 and GAD67. A Western blot analysis showed that the expression levels of both GAD65 and GAD67 in VGAT and VGAT brains were similar (Figure 10B and C). These results indicate that the increase in GABA was not likely due to elevated levels of GABA-synthesizing enzymes in VGAT embryos.
Figure 10. Neurotransmitter levels and the expression of GAD65 and GAD67.
(A) Neurotransmitter levels of E18.5 mouse forebrain. VGAT mice showed significantly higher levels of GABA and glycine, but not glutamate, than VGAT mice. Values represent means ± SD (*P<0.05; Student’s t-test, n = 5-13 per group).
(B) Western blotting of GAD65/67, and -actin. The expression levels of GAD65 and GAD67 in whole brain homogenate did not differ significantly between VGAT (+/+) and VGAT () mice. Equal amounts of protein were loaded and probed with an antibody that recognizes both GAD65 and GAD67.
(C) Quantification of GAD65 and GAD67 expression. Expression levels were normalized to -actin expression. Data are presented as a percentage of VGAT levels. There were no significant differences (P = 0.80, Student’s t-test).
4 VGAT-independent GABA release in the forebrain
4.1 Lack of inhibitory synaptic transmission in VGAT KO striatal neurons
To examine the effect of VGAT deficiency on GABAergic transmission in striatal neurons, we recorded GABAAR-mediated synaptic currents using the whole-cell patch-clamp method. The pipette solution contained a high concentration of cesium chloride so that the GABAAR-mediated currents at -60 mV were inward and most potassium currents were blocked (Yamada et al., 2007). GABAAR-mediated mIPSCs were detected in VGAT mice (n = 2) and their amplitudes and interevent intervals were 22.9 14.8 pA and 4.80 6.74 sec, respectively (Figure 11Aa). In contrast, GABAAR-mediated mIPSCs could not be detected in VGAT mice (n = 4) (Figure 11Ab). These results suggest that GABAergic synaptic transmission is absent in striatal neurons of VGAT mice.
4.2 Presence of VGAT-independent GABA release in VGAT forebrains To investigate the presence of non-vesicular GABA release, we quantified the amount of GABA released from forebrain slices of E17.5 mice. The slices included cerebral cortex and striatum, and the striatum was composed predominantly of GABAergic neurons (Bolam et al., 2000).
As shown in Figure 11B, the extracellular GABA level at E17.5 was not significantly different from that in VGAT mice (Student’s t-test, P = 0.91). It is worth noting that GABA can be released into the extracellular space in the absence of VGAT, as it could be detected in samples from VGAT mice.
Because non-vesicular GABA release can occur via a reversal of the plasma membrane GABA transporter GAT-1 under normal, non-pathological