Appendix
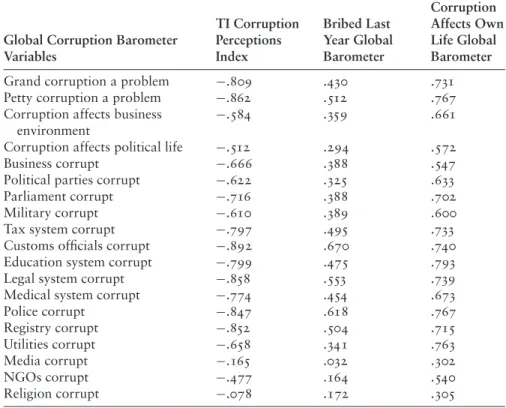
table A1-1. Transparency International Corruption Perceptions Index 2005 and Corruption Perceptions Global Corruption Barometer 2004: Correlations
Global Corruption Barometer Variables
TI Corruption Perceptions Index
Bribed Last Year Global Barometer
Corruption Affects Own Life Global Barometer
Grand corruption a problem −.809 .430 .731
Petty corruption a problem −.862 .512 .767
Corruption affects business −.584 .359 .661
environment
Corruption affects political life −.512 .294 .572
Business corrupt −.666 .388 .547
Political parties corrupt −.622 .325 .633
Parliament corrupt −.716 .388 .702
Military corrupt −.610 .389 .600
Tax system corrupt −.797 .495 .733
Customs officials corrupt −.892 .670 .740
Education system corrupt −.799 .475 .793
Legal system corrupt −.858 .553 .739
Medical system corrupt −.774 .454 .673
Police corrupt −.847 .618 .767
Registry corrupt −.852 .504 .715
Utilities corrupt −.658 .341 .763
Media corrupt −.165 .032 .302
NGOs corrupt −.477 .164 .540
Religion corrupt −.078 .172 .305
N = 61
251
252 Appendix
UK SWE FIN
USA DEN
AUS
BEL CAN HOL
BOT FRA
POR
SLO
SAF SKR
PHL ARG POL
EST
CZK
CRO HUN
PAN LAT
UKR
RUS GEO
BULCOL
ROM BLRAZR
LIT
NIG
UGA
2 4 6 8 10
TI Corruption Index 2005 0 .1 .2 .3 .4
ICVS Bribery Share bandwidth = .2 r2 = .547 N = 35 r2 with quadratic term added .683
TI Corruption Perceptions Index and ICVS Measures of Bribery Lowess Plot of Corruption Perceptions
figure A1-1.
BRZ BO S
NIC TU R
ARG INS MAC
LIT
PRU MEXIND
SKR
PHLPOL MOL URU
IT A
GHA CR I
UKR
KEN BUL
VNZ ROM POR
FRA
GEO GUA SAF
ISR
CRO JPN
LAT
RU S SPN
GRE
PAK TAI IRE
MAL CZK WGR
USA CAN
EST UKSWZ
HOL ICE
AST LUX
NOR DEN
FINSNG
2 4 6 8 10
TI Corruption Index 2005 1 1.5 2 2.5 3
Grand Corruption Problem TI Global Corruption Barometer
r2 = .655 N = 55
and TI Global Corruption Barometer 2005 Grand Corruption Perceptions Lowess Plot of TI Corruption Perceptions Index 2005
figure A1-2.
Appendix 253
-1 -.5 0 .5 1
Petty Corruption Factor Score TI Global Corruption Barometer 2004 east bloc
no bloc west bloc
r2 = .638 N = 53
by Bloc
Petty Corruption Factor Score
figure A1-3.
254 Appendix
W = Western bloc E = former and present Communist countries * In neither bloc
E E
* W
W
E
*
E W
E
*
* W
E
W *
E
*
* E
* E
W
*
*
* E
W
E
* W
* * E
*
*
* W
W
W W
* E
E W
E
*
E *
*
W W
*
*
*
*
**
E W
E
E
*
*
E
E
*
*
W *
W
*
*
*
* W
* E
*
* WW
12345Fairness of Legal System EIU Imputed
.2 .3 .4 .5 .6
Gini Index of Economic Inequality
r2 = .131 N = 88 r2 = .279 N = 65 without Former and Present Communist Nations Fairness of Legal System EIU Imputed
by Gini Index of Economic Inequality
figure A2-1.
SLV BEL
BUL CZK
CYP
ROM LUX WGR
UKR SPN FIN
LAT CAN
HUN AUS
SLO
BNG BLR
HOL
SRI
RUS TAI
PAK AST
SER IND EGY
UK SWE
ITA
POL DEN
NOR
ISR
SKR LIT
GHA
MOL IRE
JPNFRA SWZ
VTN EST
INS POR
NIG GRE USA
CHN
ALG SNG
MOR NZ
TUN JOR
UGA URU
IRN TURPRU
PHL CRI
ARG MAL ELS
DOM MEX
NIC COL THA VNZ HON
BOT
KEN PAN
CHL
ZIM GUA BRZ
SAF
246810TI Corruption Perceptions Index 2004
.2 .3 .4 .5 .6
Gini Index of Economic Inequality bandwidth = .2
Lowess Plot of Corruption and Inequality
figure A2-2.
Appendix 255
BEL
CYP LUX WGR
SPN FIN CAN
AUS
BNG HOL
SRI TAI
PAK AST
IND EGY UK SWE
ITA DEN
NOR
ISR
SKR GHA IRE
JPNFRA SWZ
INS POR
NIG GRE USA
ALG SNG
MOR NZ
TUN JOR
UGA URU
IRN TURPRU
PHL CRI
ARG MAL ELS DOM MEX
NIC COL THA VNZ HON
BOT
KEN PAN
CHL
ZIM GUA BRZ
SAF
246810TI Corruption Perceptions Index 2004
.2 .3 .4 .5 .6
Gini Index of Economic Inequality bandwidth = .2
Former and Present Communist Nations Excluded Lowess Plot of Corruption and Inequality
figure A2-3.
8.78182 6.76429
3.99231 3.04167 2.82
0 2 4 6 8
TI Corruption Perceptions Index 2003 Most Fair
4 3 2 Least Fair
r2 = .733 for 86 cases with imputation r2= .722 for 55 cases without imputation by EIU Fairness of Legal System
TI Corruption Perceptions Index
figure A2-4.
256 Appendix
SER ARG
ARM
AUS
AST
AZR BNG
BLR
BEL
BOS BOT
BRZ
UK
BUL
CAN
CHL
COL CRI
CRO CYP
CZK
DEN
DOM EGY ELS EST
FIN
FRA
GEO GHA
GRE
HON GUA HUN
ICE
IND
INS IRN
IRE ISR
ITA JPN
KEN
LAT LIT
LUX
MAC
MAL
MEX
MOL
MOR
HOL NZ
NIC
NIG
NOR
PAK PAN PRU
PHL
POL POR
ROM RUS
SAU
SEN
SNG
SLV SLO
SAF SKR
SPN
SRI
SWE SWZ
TAI
THA TUN
TUR
USA
UGA UKR
URU
VNZ
WGR
246810TI Corruption Perceptions Index 2003
0 .2 .4 .6
Most People Can Be Trusted [Imputed]
r2 = .420 N = 83
Corruption by Generalized Trust [Imputed]
figure A2-5.
BNG TRK HAI CH D
MYN
CDI EQ G
NIGANG TAJ
PAR
SO M KEN PAKDC GSUD AZR IN S
UZBET HLIBIRQ CMR GEO CAM KYRVNZ PNGBRN
ALB NGR
RUS SL LBYPHL GUA
ECU
AF G UGA BOLNEP KA ZERI
VTN UKR
ZAM BLR
HON NIC ZIM GAM
MAC ARG YMN
MOZ ALGSER ARM MLI MAL
TAN BO SBNNMOLIRN
GA B MNG IND
ROM LEB DOM
RW A SEN
MO R SRI CHN
POL LAO
CRO SAU EGY BRK
SYR GHA PANPRU
MEX JAM TUR
BRZ THA CU B
BUL COL
MRT
CRI LATELS
CZK GRE KUW SLV SA FNAM
LIT
TUN
SKR ITA
HUNMAL
JOR CYP URU
SLO BO T
OMN POR EST ISR
SPN JPN
IRE CHLBEL
FRA USA CAN WGR HOL
UK AST NOR SWZ AUS
SWE SNG
DEN FIN
NZ
246810TI Corruption Perceptions Index 2005
2 4 6 8 10
Uneven Economic Development r2 = .636 N = 139
TI Corruption Perceptions Index and Uneven Economic Development Failed States 2006
figure A2-6.
Appendix 257
table A3-1. Factor Analysis of Government Effectiveness Measures: World Economic Forum Executive Opinion Survey 2004
Variable Loading Communality
Judicial independence .919 .908
Efficiency of legal system .976 .971
Efficiency of legislative system .913 .852
Wastefulness of government spending .876 .801
Favoritism of government decision-making .942 .901 Transparency of government decision-making .934 .883
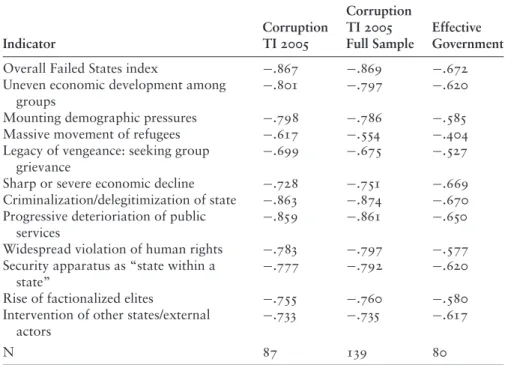
table A3-2. Correlations of Corruption, Effective Government, and Failed State Indicators (2006)∗
Corruption
Corruption TI 2005 Effective
Indicator TI 2005 Full Sample Government
Overall Failed States index −.867 −.869 −.672
Uneven economic development among groups
−.801 −.797 −.620
Mounting demographic pressures −.798 −.786 −.585 Massive movement of refugees −.617 −.554 −.404 Legacy of vengeance: seeking group
grievance
−.699 −.675 −.527
Sharp or severe economic decline −.728 −.751 −.669 Criminalization/delegitimization of state −.863 −.874 −.670 Progressive deterioriation of public
services
−.859 −.861 −.650
Widespread violation of human rights −.783 −.797 −.577 Security apparatus as “state within a
state”
−.777 −.792 −.620
Rise of factionalized elites −.755 −.760 −.580
Intervention of other states/external actors
−.733 −.735 −.617
N 87 139 80
∗Failed state indicators from http://www.fundforpeace.org/programs/fsi/fsindicators.php, accessed May 15, 2006.
258 Appendix
table A3-3. Model of Perceived Corruption: Gallup International Millennium Survey 2000
Variable Coefficient Std. Error t Ratio
Country governed by the will of the people −.217∗ ∗ ∗ ∗ .028 −7.88
All are equal under the law .070∗ ∗ ∗ ∗ .009 7.61
Government does good job handling crime .084∗ ∗ ∗ ∗ .009 9.48 Standard of living matters most in life .037∗ ∗ ∗ .014 2.57 Discrimination on political beliefs common .035∗ ∗ ∗ ∗ .007 5.13
Age −.006∗ ∗ .003 −1.68
Attended college/university −.018 .018 −.99
Gini (You average index) transition countries .006∗ ∗ ∗ .002 2.77 Gini (You average index) other countries .004∗ ∗ ∗ ∗ .001 3.65
Constant .093 .070 1.34
Estimates are regression coefficients with standard errors clustered by country Number of countries: 52; Number of observations: 33,935
R2=.225; RMSE = 1.000
∗p < .10;∗ ∗p < .05;∗ ∗ ∗p < .01;∗ ∗ ∗ ∗p < .0001 (all tests one-tailed except for constants)
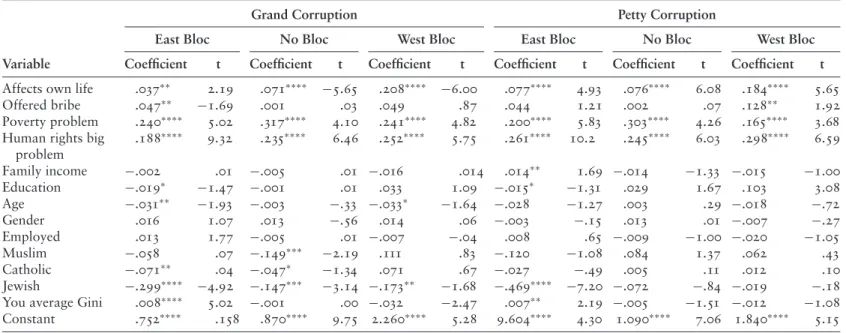
table A3-4. Models of Grand and Petty Corruption a Problem: Transparency International Global Corruption Barometer 2004
Grand Corruption Petty Corruption
East Bloc No Bloc West Bloc East Bloc No Bloc West Bloc
Variable Coefficient t Coefficient t Coefficient t Coefficient t Coefficient t Coefficient t Affects own life .037∗ ∗ 2.19 .071∗ ∗ ∗ ∗ −5.65 .208∗ ∗ ∗ ∗ −6.00 .077∗ ∗ ∗ ∗ 4.93 .076∗ ∗ ∗ ∗ 6.08 .184∗ ∗ ∗ ∗ 5.65
Offered bribe .047∗ ∗ −1.69 .001 .03 .049 .87 .044 1.21 .002 .07 .128∗ ∗ 1.92
Poverty problem .240∗ ∗ ∗ ∗ 5.02 .317∗ ∗ ∗ ∗ 4.10 .241∗ ∗ ∗ ∗ 4.82 .200∗ ∗ ∗ ∗ 5.83 .303∗ ∗ ∗ ∗ 4.26 .165∗ ∗ ∗ ∗ 3.68 Human rights big
problem
.188∗ ∗ ∗ ∗ 9.32 .235∗ ∗ ∗ ∗ 6.46 .252∗ ∗ ∗ ∗ 5.75 .261∗ ∗ ∗ ∗ 10.2 .245∗ ∗ ∗ ∗ 6.03 .298∗ ∗ ∗ ∗ 6.59
Family income −.002 .01 −.005 .01 −.016 .014 .014∗ ∗ 1.69 −.014 −1.33 −.015 −1.00
Education −.019∗ −1.47 −.001 .01 .033 1.09 −.015∗ −1.31 .029 1.67 .103 3.08
Age −.031∗ ∗ −1.93 −.003 −.33 −.033∗ −1.64 −.028 −1.27 .003 .29 −.018 −.72
Gender .016 1.07 .013 −.56 .014 .06 −.003 −.15 .013 .01 −.007 −.27
Employed .013 1.77 −.005 .01 −.007 −.04 .008 .65 −.009 −1.00 −.020 −1.05
Muslim −.058 .07 −.149∗ ∗ ∗ −2.19 .111 .83 −.120 −1.08 .084 1.37 .062 .43
Catholic −.071∗ ∗ .04 −.047∗ −1.34 .071 .67 −.027 −.49 .005 .11 .012 .10
Jewish −.299∗ ∗ ∗ ∗ −4.92 −.147∗ ∗ ∗ −3.14 −.173∗ ∗ −1.68 −.469∗ ∗ ∗ ∗ −7.20 −.072 −.84 −.019 −.18 You average Gini .008∗ ∗ ∗ ∗ 5.02 −.001 .00 −.032 −2.47 .007∗ ∗ 2.19 −.005 −1.51 −.012 −1.08 Constant .752∗ ∗ ∗ ∗ .158 .870∗ ∗ ∗ ∗ 9.75 2.260∗ ∗ ∗ ∗ 5.28 9.604∗ ∗ ∗ ∗ 4.30 1.090∗ ∗ ∗ ∗ 7.06 1.840∗ ∗ ∗ ∗ 5.15
∗p < .10;∗ ∗p < .05;∗ ∗ ∗p < .01;∗ ∗ ∗ ∗p < .0001 (all tests one-tailed except for constants) Estimates are regression coefficients with standard errors clustered by country Summary of Diagnostics for TI Global Corruption Barometer Models
Grand Corruption Petty Corruption
East Bloc No Bloc West Bloc East Bloc No Bloc West Bloc
N 7208 11629 10717 7331 11716 10742
R2 .164 .263 .337 .187 .253 .276
RMSE .635 .607 .765 .705 .660 .804
Countries 12 16 19 12 16 19
259
260 Appendix
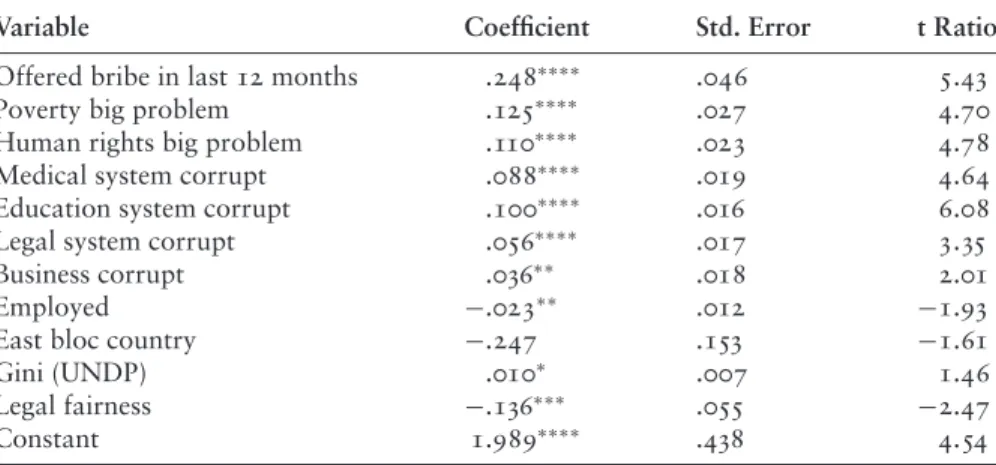
table A3-5. Model of Corruption Affects Own Life: Transparency International Global Corruption Barometer 2004
Variable Coefficient Std. Error t Ratio
Offered bribe in last 12 months .248∗ ∗ ∗ ∗ .046 5.43
Poverty big problem .125∗ ∗ ∗ ∗ .027 4.70
Human rights big problem .110∗ ∗ ∗ ∗ .023 4.78
Medical system corrupt .088∗ ∗ ∗ ∗ .019 4.64
Education system corrupt .100∗ ∗ ∗ ∗ .016 6.08
Legal system corrupt .056∗ ∗ ∗ ∗ .017 3.35
Business corrupt .036∗ ∗ .018 2.01
Employed −.023∗ ∗ .012 −1.93
East bloc country −.247 .153 −1.61
Gini (UNDP) .010∗ .007 1.46
Legal fairness −.136∗ ∗ ∗ .055 −2.47
Constant 1.989∗ ∗ ∗ ∗ .438 4.54
Estimates are regression coefficients with standard errors clustered by country. Number of countries: 52; Number of observations: 33,935
R2=.225; RMSE = 1.000
∗p < .10;∗ ∗p < .05;∗ ∗ ∗p < .01;∗ ∗ ∗ ∗p < .0001 (all tests one-tailed except for constants)
table A3-6. Aggregate Model of Corruption Affects Own Life: Transparency International Global Corruption Barometer 2004
Variable Coefficient Standard Error t Ratio
Average Gini (You data) .011∗ ∗ .006 1.82
Trust (imputed) −.981∗ ∗ .469 −2.09
Regulation of business (World Bank) −.173∗ .106 −1.64 Informal sector (Executive Opinion Survey) .097∗ .068 1.43
Constant 1.947∗ ∗ ∗ ∗ ∗ .399 4.88
N = 51; R2=.635; RMSE = .348
∗p < .10;∗ ∗p < .05;∗ ∗ ∗p < .01;∗ ∗ ∗ ∗p < .0001 (all tests one-tailed except for constants)
Appendix 261
-2 -1 0 1 2
Denmark Iceland Singapore Norway Finland Sweden UK Netherlands Luxembourg New Zealand Australia Switzerland West Germany Austria USA South Africa Malaysia Tunisia Ireland Canada Taiwan France Ghana Estonia Botswana Chile Japan Israel Belgium India Cyprus ThailandJordan Morocco Spain Indonesia China Portugal Malta Greece Uganda Costa Rica Slovenia Brazil Lithuania South Korea Egypt Hungary Vietnam Uruguay Kenya Algeria Sri Lanka El Salvador Latvia Slovakia Turkey Colombia Czech Mexico Nigeria Italy Romania Serbia Macedonia Russia Philippines Croatia Georgia Bosnia Bulgaria Bangladesh Zimbabwe Honduras Poland Dominican Republic Panama Ukraine Peru Pakistan Guatemala Argentina Nicaragua Venezuela
figure A3-1. Government Effectiveness Factor Scores (World Economic Forum Exec- utive Opinion Survey 2004)
262 Appendix
INS GEO
RUS UGA
PHL UKR
BLR SER
ARG
IND ROM CH
POL EGY
CRO BRZ COL BUL
LAT
CRI CZK
SLV
SAF LIT TUN
HUN
ITA
BOT
SLO EST POR
SPN JPN
BELFRA
USA WGR
CAN HOLUK
AST
AUS NOR
SWZ
SWE DEN
NZ FIN
.2.4.6.81Pickpocketing Frequency (ICVS)
2 4 6 8 10
TI Corruption Perceptions 2005 r2 = .659 N = 48
Pickpocketing and Corruption
figure A3-2.
INS GEO
RUS UGA
PHL UKRBLR
ARG SER
IND ROM
CHN CROPOL
EGY BRZ
BUL COL
CRI SLVLAT CZK
SAF
LIT
TUN HUN
ITA BOT
SLO EST
POR SPN
JPN BELFRA USA
WGR
CAN UK
HOL
AST AUS
NOR
SWZ SWE
DEN FIN
NZ
0.05.1.15Frequency of Assaults
2 4 6 8 10
TI Corruption Perceptions Index 2005 r2 = .000 N = 48
TI Index and ICVS Surveys Frequency of Assault and Corruption
figure A3-3.
Appendix 263
BEL WGR
SPN
FIN
CAN AUS
HOL AST
EGY
IND
UK
SWE ITA
DEN
NOR FRA
JPN
SWZ PORINS
USA
NZ TUN
UGA
PHL
CRI ARG
COL
BOT BRZ
SAF
.2.4.6.81Pickpocketing Frequency (ICVS)
.2 .3 .4 .5 .6
Gini Index of Economic Inequality
r2 = .244 N = 31 excluding present and former Communist nations r2=. 023 N = 48 for all countries
Pickpocketing and Economic Inequality Former and Present Communist Countries Excluded
figure A3-4.
RUS BRZ
LIT
EST COL
CRI UKR
ARG SAF
LAT
CZK GEO
BLR HUN
BUL SER
EGY
ROM SLV
POL UGA
POR TUN
BOT PHLITA
CRO SPN IND
INSJPN
SLO HOL
FINBEL AST
WGR
NIR
SWE FRA
UK SWZ
USA NOR
AUS DEN
CANNZ
.2.4.6.81Pickpocketing Frequency (ICVS)
.2 .4 .6 .8 1
Police Performance (ICVS) r2 = .653 N = 48 excluding China
ICVS Surveys
Pickpocketing and Police Performance
figure A3-5.
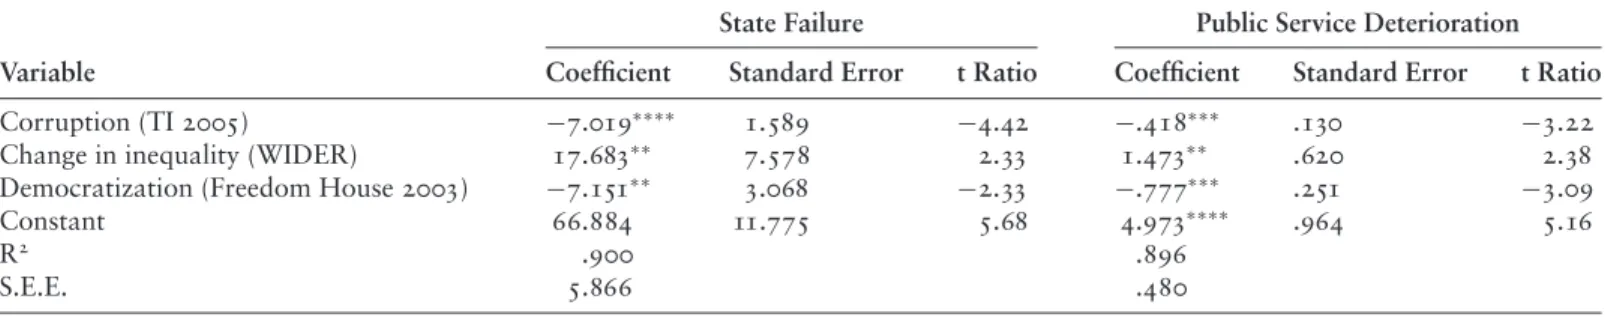
table A4-1. Determinants of State Failure and Public Service Deterioration in Transition Countries
State Failure Public Service Deterioration
Variable Coefficient Standard Error t Ratio Coefficient Standard Error t Ratio
Corruption (TI 2005) −7.019∗ ∗ ∗ ∗ 1.589 −4.42 −.418∗ ∗ ∗ .130 −3.22
Change in inequality (WIDER) 17.683∗ ∗ 7.578 2.33 1.473∗ ∗ .620 2.38
Democratization (Freedom House 2003) −7.151∗ ∗ 3.068 −2.33 −.777∗ ∗ ∗ .251 −3.09
Constant 66.884 11.775 5.68 4.973∗ ∗ ∗ ∗ .964 5.16
R2 .900 .896
S.E.E. 5.866 .480
N = 21
∗p < .10;∗ ∗p < .05;∗ ∗ ∗p < .01;∗ ∗ ∗ ∗p < .0001
264
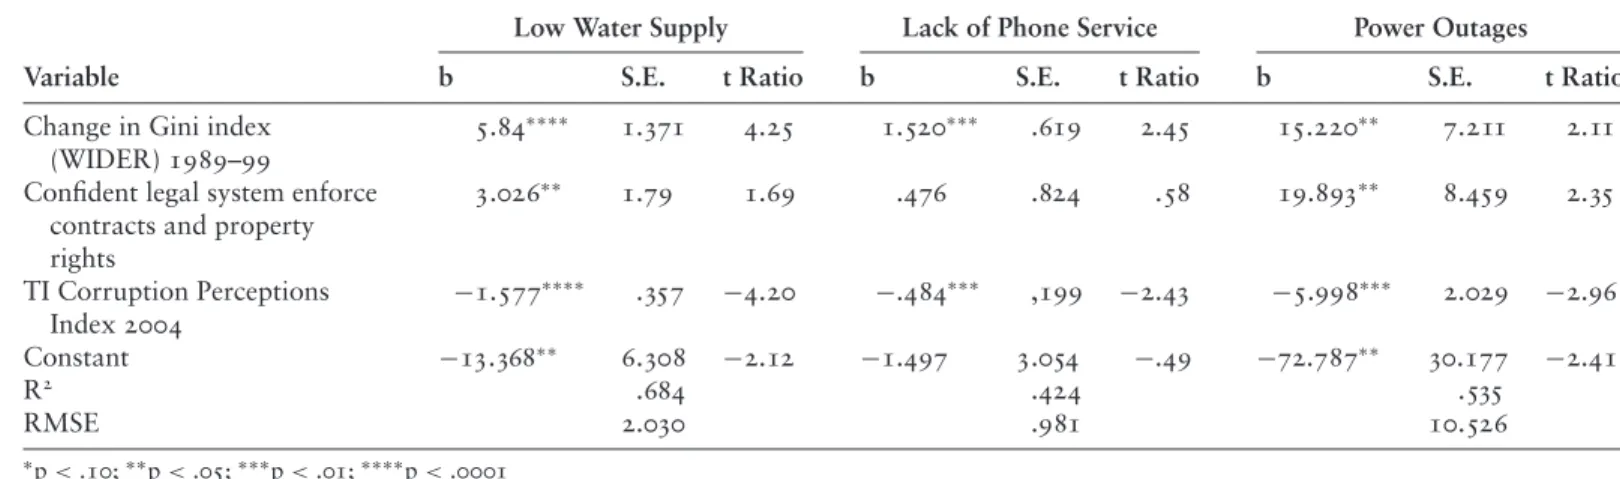
table A4-2.Determinants of Service Interruption in Transition: Aggregate Models from BEEPS 2005 (Robust Standard Errors)
Low Water Supply Lack of Phone Service Power Outages
Variable b S.E. t Ratio b S.E. t Ratio b S.E. t Ratio
Change in Gini index (WIDER) 1989–99
5.84∗ ∗ ∗ ∗ 1.371 4.25 1.520∗ ∗ ∗ .619 2.45 15.220∗ ∗ 7.211 2.11
Confident legal system enforce contracts and property rights
3.026∗ ∗ 1.79 1.69 .476 .824 .58 19.893∗ ∗ 8.459 2.35
TI Corruption Perceptions Index 2004
−1.577∗ ∗ ∗ ∗ .357 −4.20 −.484∗ ∗ ∗ ,199 −2.43 −5.998∗ ∗ ∗ 2.029 −2.96
Constant −13.368∗ ∗ 6.308 −2.12 −1.497 3.054 −.49 −72.787∗ ∗ 30.177 −2.41
R2 .684 .424 .535
RMSE 2.030 .981 10.526
∗p < .10;∗ ∗p < .05;∗ ∗ ∗p < .01;∗ ∗ ∗ ∗p < .0001 N = 21
265
266 Appendix
table A4-3. Determinants of Shares of Business Sales on Credit in Transition BEEPS 2005 Aggregate Model (With Robust Standard Errors)
Variable Coefficient Std. Error t Ratio
Change in Gini index (WIDER) 1989–99 −18.551∗ ∗ ∗ 8.897 −2.53 Corruption Perceptions Index (TI) 6.695∗ ∗ ∗ ∗ 1.504 4.45 Chamber of Commerce membership 28.374∗ ∗ ∗ ∗ 8.897 3.19
Constant 37.423∗ ∗ 13.206 2.83
RMSE = 6.16; R2=.866; N = 21
∗p < .10;∗ ∗p < .05;∗ ∗ ∗p < .01;∗ ∗ ∗ ∗p < .0001
Appendix 267
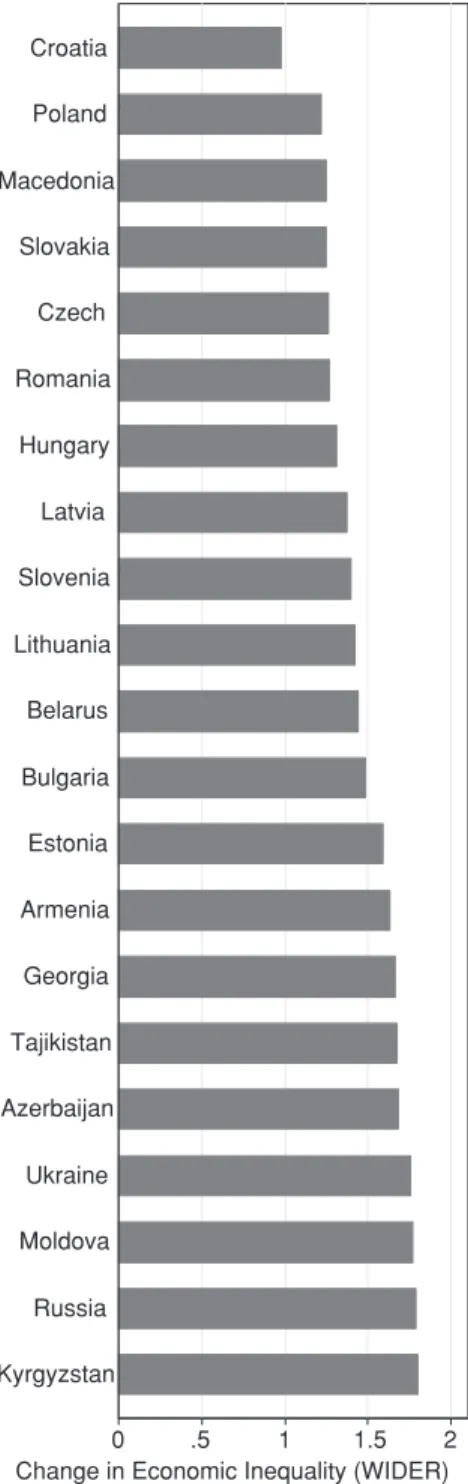
0 .5 1 1.5 2
Kyrgyzstan Russia Moldova Ukraine Azerbaijan
Tajikistan Georgia Armenia Estonia Bulgaria Belarus Lithuania Slovenia Latvia Hungary Romania Czech Slovakia Macedonia
Poland Croatia
Change in Economic Inequality (WIDER)
figure A4-1. Changes in Economic Inequality (WIDER Measures) from 1989 to 1999: Transition Countries.
268 Appendix
0 .2 .4 .6 .8
Georgia Azerbaijan Ukraine Belarus Armenia Russia Moldova KazakhstanLatvia Bulgaria Romania Uzbekistan Bosnia Croatia Albania Lithuania Poland Slovenia HungaryCzech Slovakia
Shadow Economy 2000
figure A4-2.
0 .1 .2 .3 .4
Georgia Azerbaijan Ukraine Belarus Russia Latvia Moldova Kazakhstan
Uzbekistan Lithuania Romania Bulgaria Czech Slovakia
Croatia Poland Slovenia Hungary
Change in Shadow Economy 1989-2000
figure A4-3.
Appendix 269
0 1 2 3 4
Slovenia Estonia Hungary Lithuania Czech Bulgaria Slovakia Latvia Poland Croatia Belarus Bosnia Armenia Romania Russia Macedonia
Albania Uzbekistan
Moldova Ukraine Kyrgyzstan Kazakhstan Turkmenistan Tajikistan
Georgia Azerbaijan
TI Corruption Perceptions Index 2004 Transition Countries
figure A4-4.
270 Appendix
-6 -4 -2 0
Estonia Hungary Czech Poland Slovakia Belarus Bulgaria Latvia Romania Russia Ukraine
Change in TI Corruption Index 1998-2004
figure A4-5.
Appendix 271
0 .1 .2 .3
UkraineSerbia Czech Bulgaria Bosnia Latvia Hungary Croatia Armenia Russia Belarus Slovakia Georgia Moldova LithuaniaEstonia Azerbaijan Poland Slovenia Romania Macedonia
Generalized Trust 1995
figure A4-6.
272 Appendix
0 .2 .4 .6
Georgia Aerbaijanz
Russia Kyrgyzstan Kazakhstan Ukraine Bulgaria Moldova Macedonia
Tajikistan Albania
Bosnia Croatia Lithuania
Serbia Belarus Romania Latvia Czech Slovakia Armenia Hungary Poland Slovenia Uzbekistan
Estonia
Courts Not Fair BEEPS 2002 Survey
figure A4-7.
Appendix 273
BLR HUN
CZE SLO
MAC SLV
CRO
ROM POL
LAT LIT
BUL
RUS
KAZ EST
ARM
UKR KGZMOL UZB
AZR GEO
01234TI Corruption Perceptions Index
.2 .3 .4 .5
Gini Index of Inequality (Dutta/Mishra) r2 = .349 N = 22
(Transparency International and Dutta/Mishra Estimates) Corruption and Economic Inequality Transition Countries
figure A4-8.
CRO POL
MAC SLO CZE
ROM HUN
LAT SLV
LIT
BLR BUL
EST
ARM
GE OTAJ AZR
UKRMOL RU S
KG Z
01234TI Corruption Perceptions Index
1 1.2 1.4 1.6 1.8
Gini Index of Inequality Change (WIDER) r2 = .231 N = 21
Corruption and Change in Economic Inequality Transition Countries (Transparency International and WIDER Estimates)
figure A4-9.
274 Appendix
SLOCZ E
HUN SLV
PO L LIT
CRO UZB
ROM BUL
LAT KAZ
MOL
RUS ARM
BLR UKR
AZR
GEO
.2.3.4.5Economic Inequality Dutta/Mishra Estimates
.2 .3 .4 .5 .6 .7
Size of the Shadow Economy 2000 r2 = .509 N = 19
Dutta/Mishra Estimates and Schneider Estimates
Economic Inequality and Size of Shadow Economy Transition Countries
figure A4-10.
HUN SLV
POL
CRO SLOCZE
BUL
ROM LIT
MOL
LAT RUS
BLR UKR
AZR GEO
11.21.41.61.8Change in Economic Inequality WIDER Estimates 0 .1 .2 .3 .4
Change in Shadow Economy 1989-2000 r2= .503 N = 16
(WIDER Estimates and Schneider Estimates)
Changes in Economic Inequality and Shadow Economy Transition Countries
figure A4-11.
Appendix 275
UZB
SLVPO L HUN
ARM
SLO CZE LAT
ROM BLR
LIT CROBO SALB
MOL
BUL UKR
KAZ RUS
AZR
GEO
.2.3.4.5.6.7Size of the Shadow Economy 2000
.3 .4 .5 .6 .7
(Courts Not Fair BEEPS 2002) r2 = .616 N = 21
Size of Shadow Economy and Belief Courts Not Fair Transition Countries (Schneider Estimates and 2002 BEEPS Survey of Businesspeople)
figure A4-12.
UZB
SLV POL
HUN SLOCZE
LAT
ROM BLR
LIT
CRO
MOL
BUL
UKR
KAZ RUS
AZR
GEO
0.1.2.3.4Change in Shadow Economy 1989-2000
.3 .4 .5 .6 .7
(Courts Not Fair BEEPS 2002) r2 = .580 N = 18
(Schneider Estimates and 2002 BEEPS Survey of Businesspeople) Change in Shadow Economy and Belief Courts Not Fair Transition Countries
figure A4-13.
276 Appendix
SLO CZE
HUN SLV
POL LIT
CRO
ALB BOS
UZB ROM
BUL LAT
KAZMOL RUS
ARM BLR
UKR
AZR GEO
01234TI Corruption Perceptions Index
.2 .3 .4 .5 .6 .7
Size of the Shadow Economy 2000 r2 = .504 N = 21
Transparency International 2004 and Schneider Estimates Corruption and Size of Shadow Economy Transition Countries
figure A4-14.
HUN SLV
POLCRO SLO
CZEBUL
ROM LIT
UZB KAZMOL LAT
RUS BLR
UKR
AZR GEO
01234TI Corruption Perceptions Index
0 .1 .2 .3 .4
Change in Shadow Economy 1989-2000 r2 = .643 N = 18
Corruption and Change in Shadow Economy Transition Countries Transparency International 2004 and Schneider Estimates
figure A4-15.
Appendix 277
HUN
POL SLO
CZE
BUL
ROM
LAT
RUS BLR
UKR
-6-4-20Change in TI Corruption Perceptions Index
0 .1 .2 .3 .4
Change in Shadow Economy 1989-2000 r2 = .659 N = 10
Transparency International 2004 and Schneider Estimates Change in Corruption and in Shadow Economy Transition Countries
figure A4-16.
EST
UZB SLV
POL HUN
ARM SLO
CZE LAT
ROM BLR LIT
CRO
BOS
ALB
TAJ MAC
MOL BUL
UKRKAZ KGZ RUS
AZR GEO
01234TI Corruption Perceptions Index
.3 .4 .5 .6 .7
(Courts Not Fair BEEPS 2002) r2 = .464 N = 25
Corruption and Perception that Courts Are Not Fair Transition Countries (Transparency International and 2002 BEEPS Survey of Businesspeople)
figure A4-17.
278 Appendix
TUR TAJ AZR UZB
GEO KGZ RUS
ALB UKRKAZ BLR
MAC SER
BOS
ARM MO L
ROM CRO
POL
BUL
LAT
CZE
SLO LIT
HUN
SLV EST
20406080100Failed States Index 2006
2 3 4 5 6
TI Corruption Perceptions Index 2005
r2 = .722 N = 27 r2 with Wider Change in Economic Inequality = .429 N = 21 Transition Countries
Failed States Index and TI Corruption Perceptions Index 2005
figure A4-18.
TUR TAJ
AZR UZB
GEO KGZ RUS ALB
UKR KAZ BLR
MAC
SER BO S ARM MOL
ROM
CRO POL
BUL
LATCZE SLO
LIT HUN
SLV EST
345678Public Service Deterioration Failed States 2006
2 3 4 5 6
TI Corruption Perceptions Index 2005 r2 = .693 N = 27 r2 with Change in Inequality = .475 N = 21
TI Corruption Perceptions Index 2005 Transition Countries Public Service Deterioration Failed States and
figure A4-19.
Appendix 279 table A5-1. Rankings on Transition Indicators for Romania
Transition # Overall #
Measure Value Rank Ranked Rank Ranked
TI Corruption Index 2004 1.4 13 26 88/90 146
TI Corruption Index 2005 3 11 27 85/87 160
Change in Corruption TI 1998–2004
−1.6 8 11 28/32 85
Change in Corruption 1996–2004 World Bank
−.11 11 26 84/86 151
Trust .16 19/20 21 82 94
Shadow economy share∗ .34 10 21 47/48 90
Change in share of shadow economy 1989–2000∗
.164 8 18 – –
Gini index (WIDER) 1999∗ .299 5 16 29 60
Gini index (Dutta/Mishra)∗ .311 8 22 – –
Change in Gini index (WIDER) 1989–99∗
1.261 6 21 6 44
Change in Gini index (Rosser/Rosser/Ahmed)∗
.048 7 16 – –
Courts not fair (BEEPS 2002)∗ .38 10 26 – –
Rule of law (nations in transition) 2004∗
4.38 10 27 – –
Democratization (nations in transition) 2004∗
3.25 10 27 – –
GDP per capita Penn World Tables 2000
5023 17 23 77 136
GDP growth 1975–2003 UNDP −.8 6 14 69 76
UN Human Development Index (1990)
.772 12 18 46/47 82
Uneven economic development (Failed States)∗
6 6/8 27 33/39 146
Failed States Index∗ 62.6 11 27 102 146
Internal conflicts (ICRG) 10.5 14 20 32/56 154
Ethnic tensions (ICRG) 3.5 13/14 20 87/97 141
∗Low values indicate better performance.
Rankings based upon number of transition countries rated. Multiple rankings indicate countries tied.
– Data not available or only transition countries ranked.
280 Appendix
table A5-2. Perceptions of Romanians on Inequality, Corruption, Government Performance, Democracy, the Market, Fellow Citizens, Their Government, Connections, and Gift Payments
Attitude Percent Agreeing
Inequality has increased 91.6
Satisfied with the way democracy works 33.5
Satisfied with the way the market works 13.4
Most people can be trusted 34.1
Trust government 24.5
Is the current government fighting corruption 17.9
Corruption decreased in current government 8.1
Satisfied with government efforts to reduce corruption 10.1 Satisfied with government performance in fighting corruption 23.3
Government measures to fight corruption good 37.7
Satisfied with police fighting corruption 26.9
Satisfied with courts fighting corruption 21.9
Satisfied with media fighting corruption 64.4
Most members of parliament are corrupt 85.0
Most government ministers are corrupt 79.0
Most businesspeople are corrupt 75.0
Most politicians are corrupt 74.0
Most politicians are corrupt 69.0
Most members of local council are corrupt 58.0
Most teachers are corrupt 57.0
Most government functionaries are corrupt 56.0
Most professors are corrupt 36.0
Most journalists are corrupt 26.0
Satisfied with government performance on the quality of life 25.0 Satisfied with government performance on public safety 14.0 Satisfied with government performance on privatization 19.0
Have connections for medical treatment 35.1
Trust President 38.5
Trust Parliament 15.1
Trust city hall 43.9
Trust justice system 22.0
Trust police 36.7
Trust army 66.3
Trust political parties 9.9
Have connections for finding job 11.1
Have connections to rely on in the business world 6.6
Have connections for problem at city hall 20.7
Have connections to help get loan from bank 10.0
Have connections for problem with county government 5.4
Have connections to deal with courts/lawyers 11.6
Have connections to deal with police 15.6
Have connections to rely on in foreign country 11.2
Made “extra” payments to doctor 25.0
Made “extra” payments to bank in getting loan .7
Made “extra” payments to police 1.4
Made “extra” payments to courts 3.2
Made “extra” payments to city officials 2.5
Made “extra” payments to county officials .3
Appendix 281
table A5-3. Likelihood that Romanians Would Pay an Atentie (Gift/Bribe) for Public Service: World Bank Corruption Diagnostic Survey 2000
Paying “Gift”
Public Service Paying “Gift” Voluntarily
Hospital stay 66 37
Emergency 62 29
Dentist 56 39
Medical specialist 52 33
Gas installation/repair 40 31
Power connection or repair 33 28
General practitioner 32 17
Building permit 29 19
Driving license 27 17
Vocational school 27 8
Elementary school 25 9
Real estate registration 22 16
Telephone connection/repair 22 16
Courts 22 16
High school 21 10
Loan application 19 8
Water connection/repair 18 15
University 17 9
Employment office 16 9
Passport 15 12
Unemployment benefits 11 7
Identity card 8 4
Police (crime victims only) 4 3
Source: Anderson et al. (2001, 13)
282 Appendix
table A5-4. Simultaneous Equation Model of Optimism for the Future and Perceptions of Government Handling Corruption Well from Aggregated Surveys
Variable Coefficient Std. Error t Ratio
Optimism for the future
Government success in controlling corruption 1.848∗ ∗ ∗ ∗ .327 5.65 GDP growth rate (Penn World Tables) 2.838∗ ∗ ∗ .890 3.19
Constant 39.894∗ ∗ ∗ ∗ 6.218 6.42
RMSE = 14.411; R2=.591; N = 17 Government success in controlling corruption
Optimism for the future 1.036∗ ∗ ∗ ∗ .206 5.04
Informal market (Heritage Foundation) −23.952∗ ∗ ∗ 8.401 −2.85
Constant 30.822 19.826 1.55
RMSE = 9.145; R2=.702; N = 17
∗p < .10;∗ ∗p < .05;∗ ∗ ∗p < .01;∗ ∗ ∗ ∗p < .0001
Endogenous variables in bold; endogenous dependent variables in bold italics. Exogenous variables: Trust in justice, quality of life next year.
Growth rate in gross domestic product for the year taken from Penn World Tables from 1996– 2000 and from http://www.dfat.gov.au/geo/fs/roum.pdf for 2001–3. Informal market estimate and wage and price controls taken from Heritage Foundation, http://www.heritage.org/research/ features/index/downloads/PastScores.xls.
Appendix 283 table A5-5. Satisfaction with Democracy in Romania: Ordered Probit
Independent Variable Coefficient Std. Error t Ratio
Quality of life next year .086∗ ∗ .047 1.85
State of national economy in three years .246∗ ∗ ∗ ∗ .045 5.49
Life satisfaction .187∗ ∗ ∗ ∗ .054 3.44
Wealth (can afford consumer goods) −.022 .012 −1.75 Performance of government on quality of life .249∗ ∗ ∗ .104 2.44 Performance of government in enhancing public
safety
.364∗ ∗ ∗ .124 2.94
Performance of government in reducing corruption
.238∗ ∗ ∗ ∗ .049 4.89
Romania needs a strong leader −.112∗ ∗ ∗ .043 −2.62 State should control media and political parties −.043∗ ∗ .025 −1.75 Supporter of PSD (former Communist party) .140∗ ∗ ∗ ∗ .028 4.90
Age −.003∗ .002 −1.44
Made “extra” payments when visiting doctor −.108∗ −.080 −1.35
Made “extra” payments to court −.324∗ .200 −1.62
Made “extra” payments to city officials −.030 .225 −.13 Made “extra” payments to county officials 1.804 .797 1.36
Made “extra” payments to police −.189 .259 −.73
Made “extra” payments to bank −.021 .399 −.53
Have any connections to rely upon+ .069∗ ∗ .034 2.07 Have connections to rely upon for medical
treatment+
.102 .070 1.46
Have any connections to rely upon in court/lawyer+
.116 .100 1.16
Have any connections to rely upon at city hall+ .116 .078 1.46 Have any connections to rely upon dealing with
county+
.091 .131 .69
Have any connections to rely upon for police problem+
.181∗ ∗ .078 2.06
Have any connections to rely upon for bank loan+ .198∗ ∗ .103 1.93 Have any connections to rely upon for finding
job+
.157∗ .102 1.54
Have any connections to rely upon in business world+
.013 .121 .11
Have any connections to rely upon in foreign country
−.249∗ ∗ .099 −2.51
∗p < .10;∗ ∗p < .05;∗ ∗ ∗p < .01;∗ ∗ ∗ ∗p < .0001
−2∗Log Likelihood Ratio = 2560.94; N = 1082
Coefficients for variables other than “connections” are for “any connections.” Cut points omitted.
+Two-tailed test of significance (all other tests one-tailed).
284 Appendix table A5-6. Satisfaction with Market Economy in Romania: Ordered Probit Independent Variable Coefficient Standard Error t Ratio
Quality of life next year .125∗ ∗ ∗ .045 2.79
Satisfaction with income .085∗ ∗ .051 1.68
Life satisfaction .108∗ ∗ .058 1.87
Wealth (can afford consumer goods) −.020 .013 −1.56 Performance of government on quality of
life
.424∗ ∗ ∗ .103 4.10
Performance of government in enhancing public safety
.188∗ .124 1.52
Performance of government in reducing corruption
.254∗ ∗ ∗ ∗ .048 5.33
Most businesspeople are corrupt −.086∗ ∗ .04 −2.13
Trust in private firms .178∗ ∗ ∗ ∗ .036 5.01
Age .001 .002 .69
Made “extra” payments when visiting doctor
−.069 .078 −.89
Made “extra” payments to court .068 .177 .39
Made “extra” payments to city officials .249 .206 1.21 Made “extra” payments to county officials .134 .804 .17
Made “extra” payments to police −.226 .277 −.82
Made “extra” payments to bank −.090 .399 −.23
Have any connections to rely upon −.044∗ .034 −1.30 Have connections to rely upon for medical
treatment
.006 .071 .09
Have any connections to rely upon in court/lawyer
−.106 .102 −1.03
Have any connections to rely upon at city hall
−.051 .081 −.63
Have any connections to rely upon dealing with county
−.151 .139 −1.08
Have any connections to rely upon for police problem
−.047 .088 −.05
Have any connections to rely upon for bank loan
−.129 .105 −1.22
Have any connections to rely upon for finding job
−.132 .102 −1.29
Have any connections to rely upon in business world
.185 .805 .23
Have any connections to rely upon in foreign country
−.351∗ ∗ ∗ .102 −3.45
∗p < .10;∗ ∗p < .05;∗ ∗ ∗p < .01;∗ ∗ ∗ ∗p < .0001
−2∗Log Likelihood Ratio = 2462.92; N = 1086
Coefficients for variables other than “connections” are for “any connections.” Cut points omitted.
Appendix 285 table A5-7. Trust in Government Scale in Romania: Regression Analysis
Independent Variable Coefficient Std. Error t Ratio
Generalized trust .213∗ ∗ ∗ ∗ .048 4.41
Direction of country right or wrong .237∗ ∗ ∗ .051 4.65
Inequality change −.097∗ ∗ .035 2.78
Wealth (can afford consumer goods) .000 .007 .02
Performance of government on quality of life .103∗ .065 1.58 Performance of government in enhancing public
safety
.588∗ ∗ ∗ ∗ .080 7.37
Performance of government in reducing corruption
.231∗ ∗ ∗ ∗ .032 7.14
Supporter of PSD (reformed Communist party now in power)
.237∗ ∗ ∗ ∗ .019 12.73
State should control media and political parties −.031∗ ∗ .017 −1.89 Live in Bucharest (capital) −.284∗ ∗ ∗ ∗ .069 −4.14 Frequency attendance at religious services .027∗ .018 1.50 Frequency of contact with officials .049∗ ∗ ∗ .019 2.57 Made “extra” payments when visiting doctor .025 .055 .45
Made “extra” payments to court −.049 .136 −.36
Made “extra” payments to city officials .245 .144 1.70 Made “extra” payments to county officials −.174 .364 −.48
Made “extra” payments to police −.051 .176 −.29
Made “extra” payments to bank .053 .239 .22
Have any connections to rely upon −.00003 .176 −.29
Have connections to rely upon for medical treatment
−.002 .048 −.04
Have any connections to rely upon in court/lawyer
.046 .068 .69
Have any connections to rely upon at city hall .053 .057 .92 Have any connections to rely upon dealing with
county
.005 .094 .05
Have any connections to rely upon for police problem
.027 .060 .45
Have any connections to rely upon for bank loan .008 .073 .12 Have any connections to rely upon for finding job −.119∗ ∗ .067 −1.79 Have any connections to rely upon in business
world
−.046 .082 −.56
Have any connections to rely upon in foreign country
−.158∗ ∗ .068 −2.30
∗p < .10;∗ ∗p < .05;∗ ∗ ∗p < .01;∗ ∗ ∗ ∗p < .0001 R2=.481; RMSE = .708; N = 1052
Coefficients for variables other than “connections” are for “any connections.”