Single-molecule observation of
conformational changes
in membrane proteins
reconstituted in a giant liposome
Yasuhiro Onoue
Abbreviations
AB-NTA N-(5-amino-1-carboxypentyl)iminodiacetic acid ADP Adenosine-5’-diphosphate
AFM Atomic force microscopy Alexa 488-maleimide Alexa Fluor 488 C5 maleimide ATP Adenosine-5’-triphosphate
Biotin-maleimide N-6-(biotinylamino)hexanoyl-N’-[2-(N-maleimido)ethyl]
piperazine, hydrochloride
Carboxyfluorescein 5-(and-6)-carboxyfluorescein (mixed isomers) DCCD 1,3-dicyclohexylcarbodiimide
DIC Differential interference contrast microscopy DM n-decyl-β-D-maltoside
DMSO Dimethyl sulfoxide
DTT Dithiothreitol
E. coli Escherichia coli
EDTA Ethylenediamine-N,N,N’,N’-tetraacetic acid EPR Electron paramagnetic resonance
FRET Fluorescence resonance energy transfer
HEPES 4-(2-hydroxyethyl)-1-piperazineethanesulfonic acid His-tag Histidine-tag
H+ Hydrogen ion (proton)
MOPS 3-morpholinopropanesulfonic acid NMR Nuclear magnetic resonance NTA Nitrilotriacetic acid
Pi Inorganic phosphate
rhodamine-lipid N-(lissamine rhodamine B sulfonyl)-1,2’-dihexadecanoyl-sn- glycero-3-phosphoethanolamine, triethylammonium salt s.d. Standard deviation
SDS Sodium dodecyl sulfate
SDS-PAGE SDS-polyacrylamide gel electrophoresis s.e.m. Standard error of the mean
SH-silane 3-mercaptopropyltrimethoxysilane TBT-Cl Tributyltin chloride
TCEP Tris(2-carboxyethyl)phosphine hydrochloride Tris Tris(hydroxymethyl)aminomethane
ε Molar extinction coefficient
Publication
Biochimica et Biophysica Acta - Biomembranes
“A giant liposome for single-molecule observation of conformational changes in membrane proteins”
Yasuhiro Onoue, Toshiharu Suzuki, Max Davidson, Mattias Karlsson, Owe Orwar, Masasuke Yoshida and Kazuhiko Kinosita Jr.
Volume 1788, Issue 6, Pages 1332-1340 (June 2009)
Contents
Abbreviations ––––––––––––––––––––––––––––––––––––––––––––––––––––––––––– 2 Publication ––––––––––––––––––––––––––––––––––––––––––––––––––––––––––––– 4 Contents –––––––––––––––––––––––––––––––––––––––––––––––––––––––––––––– 5 List of figures ––––––––––––––––––––––––––––––––––––––––––––––––––––––––––– 7 1. Introduction –––––––––––––––––––––––––––––––––––––––––––––––––––––––––– 8 1.1. Membrane proteins ––––––––––––––––––––––––––––––––––––––––––––––––––– 8 1.2. Single-molecule techniques for membrane proteins –––––––––––––––––––––––––– 8 1.3. Conformational changes in membrane proteins ––––––––––––––––––––––––––––– 9 1.4. Micrometer-scale probes for single-molecule studies ––––––––––––––––––––––––– 9 1.5. FOF1-ATP synthase—A rotary motor in membrane –––––––––––––––––––––––––– 10 1.6. Purpose of this thesis –––––––––––––––––––––––––––––––––––––––––––––––– 12 2. Materials and Methods –––––––––––––––––––––––––––––––––––––––––––––––– 14 2.1. Chemicals ––––––––––––––––––––––––––––––––––––––––––––––––––––––––– 14 2.2. Buffers –––––––––––––––––––––––––––––––––––––––––––––––––––––––––––– 14 2.3. Preparation of FOF1 –––––––––––––––––––––––––––––––––––––––––––––––––– 15 2.4. Modification of FOF1 ––––––––––––––––––––––––––––––––––––––––––––––––– 15 2.5. Preparation of lipid and proteolipid suspensions ––––––––––––––––––––––––––– 17 2.6. Preparation of giant liposomes ––––––––––––––––––––––––––––––––––––––––– 18 2.7. Modification of coverglasses with Ni-NTA ––––––––––––––––––––––––––––––––– 20 2.8. Preparation of streptavidin-coated beads ––––––––––––––––––––––––––––––––– 20 2.9. Observation of rotation of FOF1 in giant liposomes –––––––––––––––––––––––––– 20 2.10. Observation of rotation of FOF1 in the detergent solution –––––––––––––––––––– 21 2.11. Injection of a fluorescence dye into a giant liposome ––––––––––––––––––––––– 22 2.12. Imaging system –––––––––––––––––––––––––––––––––––––––––––––––––––– 22
2.13. Data analysis ––––––––––––––––––––––––––––––––––––––––––––––––––––– 23 3. Results ––––––––––––––––––––––––––––––––––––––––––––––––––––––––––––– 24 3.1. Overview of experimental system ––––––––––––––––––––––––––––––––––––––– 24 3.2. Modification of FOF1 ––––––––––––––––––––––––––––––––––––––––––––––––– 24 3.3. Reconstitution of FOF1 into giant liposomes ––––––––––––––––––––––––––––––– 26 3.4. Immobilization of a giant liposome on a glass surface via the embedded FOF1 –––– 28 3.5. Binding of streptavidin-coated beads to biotinylated FOF1 in membrane ––––––––– 34 3.6. ATP-driven rotation of FOF1 in the liposomal membrane –––––––––––––––––––––– 35 3.7. Position of rotating beads in a giant liposome ––––––––––––––––––––––––––––– 38 3.8. Effects of inhibitors on rotation of FOF1 ––––––––––––––––––––––––––––––––––– 40 3.9. FOF1 must be in the lipid membrane to rotate –––––––––––––––––––––––––––––– 43 3.10. Detachment of rotating beads is followed by diffusional movement –––––––––––– 45 3.11. Confinement of a fluorescent dye in the immobilized proteoliposome –––––––––– 47 4. Discussion –––––––––––––––––––––––––––––––––––––––––––––––––––––––––– 50 4.1. Advantages of the developed system –––––––––––––––––––––––––––––––––––– 50 4.2. Comparison between the developed system and other techniques ––––––––––––– 50 4.3. Application of the developed system –––––––––––––––––––––––––––––––––––– 51 References ––––––––––––––––––––––––––––––––––––––––––––––––––––––––––– 52 Acknowledgements ––––––––––––––––––––––––––––––––––––––––––––––––––––– 61
List of figures
Figure 1.1. Schematic representation of the structure of FOF1 –––––––––––––––––––– 11 Figure 1.2. A cross section of the developed experimental system ––––––––––––––––– 13 Figure 2.1. Two different preparations of giant liposomes for observation
under a microscope –––––––––––––––––––––––––––––––––––––––––– 19 Figure 3.1. Confirmation of modification of FOF1 with biotin
or a fluorescent probe (Alexa 488) ––––––––––––––––––––––––––––––– 25 Figure 3.2. Absorption spectrum of Alexa 488-labeled FOF1 –––––––––––––––––––––– 27 Figure 3.3. Reconstitution of FOF1 into giant liposomes ––––––––––––––––––––––––– 29 Figure 3.4. Specific binding of the proteoliposomes to the Ni-NTA modified glass surface through the his-tags on FOF1 ––––––––––––––––––––––––––––––––– 31-33 Figure 3.5. Specific binding of streptavidin-coated beads to biotinylated FOF1
in giant liposomes –––––––––––––––––––––––––––––––––––––––––––– 36 Figure 3.6. Rotation of FOF1 in giant liposomes immobilized
on the Ni-NTA modified glass surface –––––––––––––––––––––––––––– 37 Figure 3.7. Position of rotating beads in a giant liposome –––––––––––––––––––––––– 39 Figure 3.8. Effects of inhibitors on rotation of FOF1 in giant liposomes –––––––––––– 41,42 Figure 3.9. Rotation of FOF1 in the presence of 0.05% (v/v) Triton X-100 –––––––––––– 44 Figure 3.10. Traces of diffusional motion of beads after rotation ––––––––––––––––––– 46 Figure 3.11. Confinement of carboxyfluorescein in giant liposomes –––––––––––––– 48,49
1. Introduction
1.1. Membrane proteins
Membrane proteins are proteins localized in biological membranes. They play significant roles in cells such as signal transduction, transport of specific substances, maintenance of ionic gradients and energy conversions [1]. It is predicted that 20-30% of all genes in most genomes encode membrane proteins [2-4]. In addition, membrane proteins are very important in the pharmaceutical industry because they relate to serial diseases and more than ~50% of drug targets [5,6].
1.2. Single-molecule techniques for membrane proteins
Single-molecule techniques are powerful tools that can reveal dynamics of membrane proteins [7]. Single-channel recordings have amply demonstrated the significance and power of studying individual behaviors, allowing detailed kinetic analysis of the opening and closing of ion channels [8,9]. Indeed, the channel current was the first proof that proteins work as singles. Arrangement and architecture of individual membrane proteins can now be imaged with atomic force microscopy [10-13], and their movement in membranes by single-particle tracking [14,15]. Manipulation of a single membrane protein in situ, such as unfolding and refolding under force, is also feasible [16,17]. Using a fluorescence photobleaching technique, numbers of subunits in individual membrane proteins can directly be counted [18,19]. All of these results are not available with conventional biochemical experiments.
1.3. Conformational changes in membrane proteins
Here, I focus on conformational changes in a membrane protein that underlie its function. Not only static structures of a protein determined by X-ray crystallography or NMR but also movies of conformational changes in a protein by real time observations as directly as possible are essential for understanding the mechanism of a protein molecule. I think that nobody who works in protein science have no interests in conformational changes in a protein.
Observation of individual molecules in real time reveals details of the kinetics of conformational changes, as demonstrated by FRET or EPR which is sensitive to a small change in the distance between two chromophores or spin probes [20-25]. At the single- molecule level, however, FRET signals are rather noisy, particularly in membranous environments where lipids (and other components) could give rise to a background fluorescence (and also scatter light). Also, photobleaching and possible blinking of the fluorophore limit the observation time. Compared to FRET, EPR sensitivity is much lower and measurement at the single-molecule level has not yet been achieved.
1.4. Micrometer-scale probes for single-molecule studies
There are several advantages in the use of a probe that is “huge” compared to the size of a protein molecule, such as a biological polymer like an actin filament or a microtubule [26,27] or a micron-sized bead [28]. One advantage is high precision. These
“huge” probes allow long-time imaging at high spatial and temporal precisions. For example, ångström-sized steps during transcription by RNA polymerase [29] and translation by ribosome [30] have been observed. Another advantage is easy explanation. Movies of the motion of a “huge” probe can often be interpreted without analysis, enabling seeing-is-understanding type experiments. In addition, a “huge” probe by itself magnifies angular changes in a small protein molecule, and thus is particularly suited for the
detection of a conformational change which necessarily accompanies an angular motion of one part against another. As examples, details of rotations in a flagellar motor [31] or F1- ATPase [26,32] have been observed clearly. Another advantage is accessibility to mechanochemistry. Mechanical properties such as a force (or torque) generated by a protein machine can also be assessed by a “huge” probe that moves against viscous drag [33-35] or that works against an external force set by optical or magnetic tweezers [36-39]. A critical disadvantage with “huge” probes is that, if a conformational change (reorientational motion) is to be observed, a part of the protein must be fixed on a solid substrate in addition to the attachment of the probe on another part.
1.5. FOF1-ATP synthase—A rotary motor in membrane
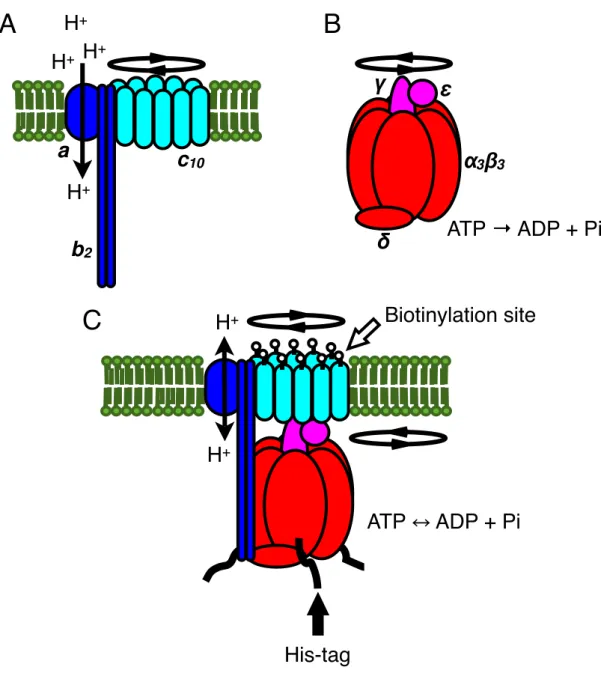
I selected FOF1-ATP synthase as a model membrane protein in this thesis because it changes its conformation dramatically. The ATP synthase consists of two rotary motors, the membrane-embedded FO motor driven by the flow of H+ across the membrane and the water-soluble F1 motor driven by the hydrolysis of ATP [40-43] (Figure 1.1A and 1.1B). Subunit compositions of the two motors are α3β3γδε for F1 and ab2c10-15 for FO in bacteria. When FOF1 functions, the subunits γεc10-15 together rotate as the rotor, against the stator subunits α3β3δab2 (Figure 1.1C). That is, the rotors of the FO and F1 motors are fused against each other, and the stators of both motors are also joined. Yet the genuine directions of rotation in the two motors are opposite to each other: when FO wins, as in most in vivo conditions, F1 is forced to rotate in reverse and synthesizes ATP from ADP and inorganic phosphate (Pi). When hydrolysis of ATP by F1 is favored, protons are pumped back by FO. Both ATP-driven [44-46] and proton-driven [47-49] rotations of FOF1
have been observed.
Figure 1.1. Schematic representation of the structure of FOF1 (not to scale). (A) Structure of isolated FO. Rotor subunits c10 (cyan) rotate relative to stator subunits ab2 (blue) driven by H+ translocation across the membrane (green). (B) Structure of isolated F1. Rotor subunits γε (magenta) rotate relative to stator subunits α3β3δ (red) driven by ATP hydrolysis reaction. (C) Structure of FOF1
complex. FO (ab2c10) and F1 (α3β3γδε) are joined as shown. Rotor subunits (c10γε) together rotate relative to stator subunits (ab2α3β3δ). One of the biotinylation sites on each c subunit and His-tags on each β subunit are pointed by open and solid arrows.
ATP → ADP + Pi
α
3β
3γ
δ
ε
A B
C H
+H
+His-tag
Biotinylation site
ATP ADP + Pi
H
+H
+H
+a
b
2c
10H
+1.6. Purpose of this thesis
In this thesis I developed a new single-molecule technique to observe conformational changes in membrane proteins using a “huge” probe. I chose to work with a giant liposome [50] (Figure 1.2) for the following reasons. Supported membranes also allow immobilization of protein molecules on a surface [51,52], but aqueous environments on both sides of the membrane cannot be controlled independently. Planar membrane systems have two independent compartments [53], but fixing a membrane protein in space is not easy. A liposome attached to a surface through the protein molecules of interest suits both purposes, fixing the protein and controlling the media on two sides of the membrane independently. A giant liposome tens or hundreds of microns will allow injection of micron-sized beads (or other “huge” probes) that will be attached to the protein and move freely in the internal space of the liposome.
Figure 1.2. A cross section of the developed experimental system (not to scale).
Target membrane protein molecules (red), mimicking the FOF1, are reconstituted in a giant liposome (green) and immobilized on the glass surface (gray rectangle at bottom). Using a glass pipette (gray triangle on upper right) probes (beads) (open circles) to be attached to the membrane protein are injected. Motions of beads powered by conformational changes in the membrane protein are observed under a microscope.
Membrane protein Probe (bead) Membrane
2. Materials and Methods
All experiments were performed at room temperature unless indicated otherwise.
2.1. Chemicals
Alexa 488-maleimide (Alexa Fluor 488 C5 maleimide), carboxyfluorescein (5-(and-6)- carboxyfluorescein, mixed isomers) and rhodamine-lipid (N-(lissamine rhodamine B sulfonyl)-1,2’-dihexadecanoyl-sn-glycero-3-phosphoethanolamine, triethylammonium salt) were purchased from Molecular Probes (Eugene, OR, USA). NHS-PEG-MAL-3400 was from Nektar (San Carlos, CA, USA), DCCD (1,3-dicyclohexylcarbodiimide, 99%), TBT-Cl (tributyltin chloride, 96%) and L-α-phosphatidylcholine from soybean, type II-S from Sigma-Aldrich (Saint Louis, MO, USA), AB-NTA (N-(5-amino-1-carboxypentyl)iminodiacetic acid), DM (n-decyl-β-D-maltoside) and biotin-maleimide (N-6-(biotinylamino)hexanoyl-N’- [2-(N-maleimido)ethyl]piperazine, hydrochloride) from Dojindo Laboratories (Kumamoto, Japan), TCEP (tris[2-carboxyethyl]phosphine hydrochloride) solution (0.5 M) from Pierce Biotechnology (Rockford, IL, USA), and SH-silane (3-mercaptopropyltrimethoxysilane) from GE Toshiba silicone (Tokyo, Japan).
2.2. Buffers
Buffers used in this study are: buffer G (0.1 M K-Pi, pH 7.5, 1 mM MgSO4, 1%(v/v) glycerol); buffer MD* (20 mM K-Pi, pH 7.5, 100 mM KCl, 5 mM DM); buffer R (10 mM HEPES-KOH, pH 7.5, 2 mM MgSO4, 50 mM KCl, 1 mM ATP); buffer RT (10 mM HEPES- KOH, pH 7.5, 2 mM MgSO4, 50 mM KCl, 0.05%(v/v) Triton X-100).
* In the original publication (BBA 1788, 1332-1340, 2009) I wrote K-Pi concentration as 10 mM by mistake.
2.3. Preparation of FOF1
E. coli expression system for FOF1 was provided by Professor Yoshida group in Tokyo Institute of Technology (Japan). Briefly, an expression vector, pTR-ISBS2-CNCR3 for a mutant FOF1 (c-Ser2Cys, α-Cys193Ser, α-Trp463Phe, β-10 histidines at N terminus) was used to express the recombinant thermophilic Bacillus PS3 FOF1 in E. coli cells. This plasmid vector was constructed from pTR19-ASDS-CNCR3 [46], by additionally introducing uncI gene that codes a molecular chaperon for c-ring assembly (to be published elsewhere). FOF1 was expressed in FOF1-deficient E. coli strain DK8 [54].
FOF1 was purified as described [55]. Briefly, the E. coli cells were cultured in 2×YT medium containing 100 μg/ml of ampicillin, and inverted membranes were prepared by French Press. FOF1 were solubilized from the membranes with 2%(v/v) TritonX-100 and 0.5%(w/v) sodium deoxycholate and purified on a Ni-NTA column (Qiagen, Hilden, Germany). Eluted FOF1 was concentrated by the addition of ammonium sulfate. The concentration of FOF1 was estimated from the extinction coefficient, ε280 nm, of 249,000 (M
−1⋅cm−1) predicted from the amino acid sequence [56] and converted to mg/ml assuming a molecular weight of 532 kDa.
2.4. Modification of FOF1
Biotinylation of FOF1, of which the sole cysteine residues were the introduced Ser2Cys on the ten c subunits and an intrinsic a-Cys27, was performed as follows. 200 μl of purified FOF1 at 24 mg/ml was reduced with 1 mM TCEP in 50 mM Tris-SO4, pH 8.0, 5 mM DM. After 1 h, excess TCEP was removed on an NAP-5 column (Pharmacia Biotech, Uppsala, Sweden) equilibrated with buffer MD. To 700 μl of the eluent, 5 μl of 10 mM biotin-maleimide dissolved in DMSO was added. After 1 h, 10 mM DTT was added to
quench the reaction. After another 1 h, the biotinylated FOF1 was frozen in liquid nitrogen and stored at −80C° until use.
Biotinylation was confirmed by Western blotting. After SDS-PAGE at 16%(w/v) acrylamide, the gel was blotted onto a PVDF-membrane (Bio-Rad Laboratories, Hercules, CA, USA) in Towbin buffer (25 mM Tris, 192 mM glycine, 20%(v/v) methanol) with 0.1%(w/ v) SDS, and stained with streptavidin followed by biotinylated horse radish peroxidase (Vectastain ABC kit, Vector laboratories, Burlingame, CA, USA) and its fluorescent substrate (Immunostaining HRP-1000, Konica Minolta Medical & Graphic, Tokyo, Japan).
Labeling FOF1 with the fluorescent dye Alexa 488 was performed as the biotinylation above with several differences. Reduction was by 5 mM TCEP instead of 1 mM. To 700 μl eluate from NAP5, 18 μl of 2 mM Alexa 488-maleimide in DMSO was added. After quenching the reaction with DTT, unreacted dye and DTT were removed with a centrifugal filter device (Ultrafree-0.5 Biomax-30, Millipore, Billerca, MA, USA) as follows: 500 μl of the quenched sample was loaded on a centrifugal device pre-rinsed with buffer MD and centrifuged at 9,500 ×g for 7 min at 4 °C. 400 μl of buffer MD was added to the concentrated sample (~100 μl) and centrifuged again. After another round, the labeled FOF1 was recovered in 200 μl of buffer MD, frozen in liquid nitrogen, and stored at −80 °C until use.
Labeling was confirmed on the 16%(w/v) gel illuminated with ultraviolet light. The dye/protein molar ratio in the final purified sample was estimated from the Alexa 488 and protein absorbances. For Alexa 488, its peak absorbance of 77,100 M−1⋅cm−1 (supplied by the manufacturer) at 493 nm in buffer MD was assumed to remain the same after labeling, although labeling shifted the peak wavelength to 498 nm. To estimate the protein concentration from A280nm, the contribution of Alexa 488 to the absorbance at 280 nm was subtracted by assuming its A280 nm/A498 nm was equal to the A280 nm/A493 nm of 0.157 measured for free dye in buffer MD.
2.5. Preparation of lipid and proteolipid suspensions
To prepare giant liposomes by dehydration and rehydration, I first prepared suspensions of lipid and of the mixture of lipid and FOF1 as starting materials. The suspensions were presumably in the form of multilamellar liposomes, although I did not confirm their nature.
Pure lipid suspension was prepared as described [57] with minor modifications. The soybean lipid was washed with acetone [58] and dissolved in chloroform at 20 mg/ml. 250 μl was taken in a round bottom flask, ~1 ml chloroform was added and mixed, and the lipid was dried under vacuum with a rotary evaporator for >8 h. 5 ml of buffer G was added to make the lipid concentration to 1 mg/ml, and the flask was sonicated in a bath sonicator (VS-100, VELVO-CLEAR, Tokyo, Japan) filled with ice water until the lipid was detached from the bottom of the flask. This suspension was stored at −30 °C until use. When fluorescent lipid was to be included, 2 mg of the washed soybean lipid and 200 ng of rhodamine-lipid were mixed in chloroform and dried. After the addition of 2 ml buffer G, the suspension was sonicated and stored at -30 °C.
Proteolipid suspension consisting of the soybean lipid and FOF1 was prepared by dialysis [59] with slight modifications. Depending on the experiment, five different compositions were employed: (1) 20 mg of the soybean lipid and 200 μg of untreated FOF1, (2) 20 mg of the soybean lipid and 200 μg of Alexa 488-labeled FOF1, (3) 20 mg of the soybean lipid and 200 μg of biotinylated FOF1, (4) 20 mg of the soybean lipid, 200 μg of untreated FOF1 and 40 μg of biotinylated FOF1, and (5) 20 mg of the soybean lipid, 200 μg of Alexa 488-labeled FOF1 and 40 μg of biotinylated FOF1. These were dissolved in 0.5 ml of 10 mM Tricine-NaOH, pH 8.0, 5 mM DTT, 0.2 mM EDTA, 2%(w/v) sodium cholate, 1%(w/v) sodium deoxycholate, and dialyzed in a Spectra/Por 3 MWCO 3000 dialysis membrane (Spectrum Laboratories, Rancho Dominguez, CA, USA) against 500 ml of 10
mM Tricine, 2.5 mM MgSO4, 0.25 mM DTT, 0.2 mM EDTA, pH 8.0 at 30 °C for ~20 h with one exchange of external solution. After dialysis, ~160 mg of Bio-beads SM-2 (Bio-Rad Laboratories), pre-washed in water, was added to the suspension to remove residual detergents. After 2 h, the beads were removed and the proteolipid suspension was diluted 20-fold with buffer G, frozen in liquid nitrogen, and stored at −80 °C.
2.6. Preparation of giant liposomes
Giant liposomes were prepared by de-hydration and re-hydration [60,61]. Two slightly different procedures were used for preparation and observation. One was for the confirmation of successful incorporation of FOF1 in the liposomal membrane (Figure 2.1A). For this purpose, 5 μl each of the lipid and proteolipid suspensions above were mixed. The mixture was put on a coverglass (24 × 60 mm2, NEO, Matsunami Glass Industry, Osaka, Japan) and de-hydrated under vacuum. After ~10 min 200 μl of buffer R was added to the de-hydrated film. After ~30 min the sample was observed under a microscope.
The other procedure was for the immobilization of giant liposomes on a Ni-NTA modified glass surface (Figure 2.1B). On the Ni-NTA modified coverglass (24 × 32 mm2) described below, I placed a silicon rubber sheet (1 mm thick) with a central rectangular hole ~16 × 22 mm2 to make an observation chamber. 20 μl each of the lipid and proteolipid suspensions were mixed. When rhodamine-lipid was to be included, 10 μl each of pure lipid and rhodamine-lipid containing suspensions described above were mixed with 20 μl of the proteolipid suspension including Alexa 488-labeled FOF1; with these ratios, the fluorescence intensities of rhodamine and Alexa 488 became comparable. The 40 μl mixture was divided into four 10-μl spots on a coverglass and de-hydrated under vacuum. After 20 min 50 μl of buffer R was added to each de-hydrated film. After 5 min, all four drops were poured on the top of 0.5 ml of buffer R overfilling the open observation chamber. After ~3 h when most of the liposomes had settled on the bottom, observation
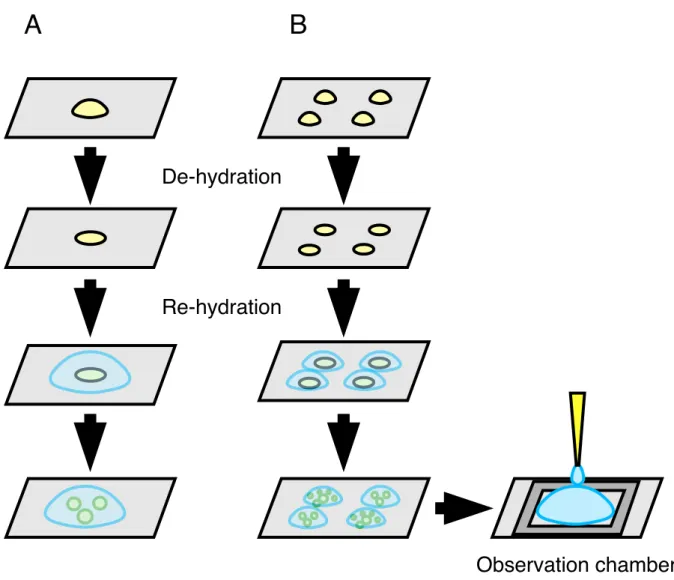
Figure 2.1. Two different preparations of giant liposomes for observation under
a microscope. (A) For the confirmation of successful incorporation of FOF1 in the liposomal membrane, giant liposomes were prepared by de-hydration and re- hydration. Proteolipid suspensions were put on a coverglass and de-hydrated under vacuum. After re-hydration by addition of buffer to the de-hydrated film, giant liposomes were spontaneously formed. (B) In order to immobilize giant liposomes on a Ni-NTA modified glass surface, giant liposomes prepared by de- hydration and re-hydration as above were poured on the buffer overfilling the open observation chamber made of the Ni-NTA modified coverglass and a silicon rubber sheet.
A B
De-hydration
Re-hydration
Observation chamber
under a microscope was started.
2.7. Modification of coverglasses with Ni-NTA
Glass surface was modified with Ni-NTA as follows. First, 24 × 32 mm2 coverglasses (Matsunami Glass Industry) were coated with SH-silane [62]. The silanized surfaces were reduced by incubation with 0.1 M DTT for 1 h and washed with ultra pure water. Then the coverglasses were immersed in 20 mM NHS-PEG-MAL-3400, 200 mM AB-NTA and 300 mM NaOH in 50 mM MOPS-NaOH, pH 7.0 (final pH was 8.6-8.8) for >4 h and washed with ultra pure water. Finally, they were incubated in 10 mM Ni2SO4 for >6 h, washed with ultra pure water, and stored at room temperature under air until use.
2.8. Preparation of streptavidin-coated beads
Streptavidin-coated magnetic beads with a nominal diameter of 0.711 μm (3015-2105, Seradyn, Indianapolis, IN, USA) were washed [63] as follows. 10 μl of the bead suspension was mixed with 2 ml ultra-pure water and centrifuged at 800 ×g for 9 min at 4 °C in a swing rotor. Supernatant was recovered and centrifuged at 8,000 ×g for 10 min at 4 °C. The pellet was dissolved in 400 μl of ultra-pure water and centrifuged at 8,000 ×g for 5 min at 4 °C. The final centrifugal washing was repeated four more times. The pellet in the last wash was dissolved in 10 μl of ultra-pure water and stored on ice. Beads thus prepared were used within two days.
2.9. Observation of rotation of FOF1 in giant liposomes
After giant liposomes containing biotinylated FOF1 settled and attached to the Ni-NTA modified bottom of the observation chamber, streptavidin-coated beads were injected into a liposome under a microscope [57]. Glass pipettes were drawn of borosilicate glass capillaries of outer and inner diameters 1.0 mm and 0.78 mm (GC100T-10, Harvard
Apparatus, Holliston, MA, USA) with a micropipette puller (P-2000, Sutter Instrument, Novato, CA, USA). A pipette was filled with the mixture of 5 μl of the washed beads and 5 μl of buffer R, and set on a home-made capillary holder mounted on a micromanipulator (TransferMan NK2, Eppendorf, Hamburg, Germany). The pipette tip was inserted into a liposome with the help of electric pulses at 30 V and duration 2 ms generated by a D-A converter (PCI-3335, Interface, Hiroshima, Japan) in a personal computer and amplified with an NF 4015 amplifier (NF, Kanagawa, Japan). An Ag/AgCl electrode was placed in the external solution to serve as the counter electrode. Injection of the beads was controlled pneumatically by a microinjector (CellTram vario, Eppendorf) and took 60–150 s to fill a liposome with tens of beads. After the injection the pipette was withdrawn from the giant liposome. In long observations (1.5–2 h), evaporation from the open observation chamber decreased the solution volume from the initial ~700 μl to ~500 μl, implying an increase in solute concentrations by ~50%.
2.10. Observation of rotation of FOF1 in the detergent solution
To observe rotation in the absence of lipid membrane, the washed streptavidin- coated beads were re-washed with buffer RT twice for suspension in this buffer. A flow chamber was constructed of the Ni-NTA modified coverglass (24 × 32 mm2) and an untreated coverglass (18 × 18 mm2, Matsunami Glass Industries). Biotinylated FOF1 was diluted to 0.5 nM in buffer RT and infused into the flow chamber. After 2 min, 20 μl of buffer RT was infused twice to remove unbound FOF1. Next, one chamber volume (~4 μl) of the streptavidin-coated beads in buffer RT were infused. After 30 min, 20 μl of buffer RT containing 1 mM ATP was infused twice, and rotation was observed under a microscope. To exchange the solution, either buffer R (without Triton X-100 and with 1 mM ATP) or buffer RT (with Triton X-100) containing 1 mM ATP was infused in three 20-μl aliquots to the flow chamber. The number of beads that rotated for more than three
(counterclockwise) revolutions in 90-150 s was counted by eye on the monitor screen in the total of 10 fields of view (each covering ~10,000 μm2).
2.11. Injection of a fluorescence dye into a giant liposome
After giant liposomes containing unlabeled FOF1 settled and attached to the Ni-NTA modified bottom of the observation chamber, carboxyfluorescein was injected into a liposome under a microscope. Glass pipettes were drawn of borosilicate glass capillaries (GC100TF-10, Harvard Apparatus) and filled with 10 μl of 10 μM carboxyfluorescein in buffer R. Injection of carboxyfluorescein to the giant liposome was performed with the help of electric pulses as described above and controlled by a microinjector (FemtoJet, Eppendorf). After injection the pipette was withdrawn from the giant liposome and observation of fluorescence intensity from carboxyfluorescein trapped in the giant liposome was started.
2.12. Imaging system
I used a conventional microscope (IX71, Olympus, Tokyo, Japan). Both differential- interference-contrast (DIC) and fluorescence images were observed through a UPlan Fl objective (40×, numerical aperture 0.75, Olympus). The fluorescence cassette used for Alexa 488 and carboxyfluorescein observation was U-MWIB2 (excitation 460–490 nm, emission >510 nm, Olympus), and, for rhodamine-lipid, U-MWG2 (excitation 510–550 nm, emission >590 nm). Images were captured with an EM-CCD camera (MC681SDP-ROBO, Texas Instruments, Dallas, TX, USA). The analogue output of the camera was connected to an LCD monitor (LMD-1410, Sony, Tokyo, Japan) for a visual check. The digital output was saved to a personal computer through a CL61 (BitFlow, Woburn, MA, USA) frame grabber and a CLT-301L (Vivid Engineering, Shrewsbury, MA, USA) camera link translator.
The image-capture software was CiView (BitFlow) for still pictures and VideoSavant 4.0 (IO Industries, Ontario, Canada) for movies (30 Hz).
2.13. Data analysis
Rotation time courses were analyzed by eye by watching the video sequence and assigning a rotary angle to the bead image in each frame with a resolution of 30°. When the rotation was slow, the assignment was made in every other frame or every five frames. To convert the instantaneous angles into cumulative revolutions, I restricted the angular difference between successive frames to be between −150° and +180°. For a fast-moving bead that occasionally rotates more than +180° per frame, this procedure will report a negative rotary step instead of a positive >180° step. Because I could not be 100% sure that the step was positive, I left the negative values untouched (although negative steps with a size exceeding 90° were virtually absent in slowly rotating beads).
3. Results
3.1. Overview of experimental system
In this study, I used mutant FOF1 as a model protein. This protein has his-tags which are genetically introduced into the N terminus of β subunits in the stator part of FOF1 to immobilize FOF1 on the Ni-NTA modified glass surface. It also has cysteine residues which are genetically introduced into c subunits in the rotor part of FOF1 to attach streptavidin- coated beads as “huge” probes after chemical modification, namely biotinylation (Figure 1.1C).
I have reconstituted this mutant FOF1 in a membrane and produced giant liposomes by de-hydration and re-hydration (Figure 2.1) [60,61]. The liposomes were immobilized on a glass surface modified with Ni-NTA, through his-tags genetically introduced in the stator part of FOF1. Finally, I injected streptavidin-coated beads into a liposome to let the beads attach to the biotinylated rotor part of FOF1 (Figure 1.2). In the presence of ATP, I observed that the beads rotated continuously under an optical microscope.
3.2. Modification of FOF1
To attach a streptavidin-coated bead(s) as a probe of rotation, c subunits in the rotor part of FOF1 were biotinylated by mixing reduced FOF1 with biotin-maleimide. SDS-PAGE (Figure 3.1A) did not show detectable differences between biotinylated and untreated FOF1. Western blot stained for biotin (Figure 3.1B) showed no bands for the untreated FOF1, whereas several bands with molecular weights corresponding to the c subunit and its oligomers appeared in the lane of biotinylated FOF1. The bands labeled c, c2, and c10
were also detected in anti-c immunoblot (data not shown). Although the FOF1 I used had another cysteine residue at the a subunit (a-Cys27), the corresponding band was not
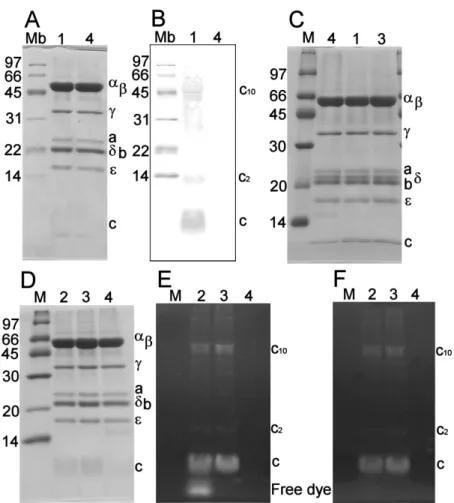
Figure 3.1. Confirmation of modification of FOF1 with biotin or a fluorescent probe (Alexa 488). Purified FOF1 was labeled with biotin-maleimide (A and B) or Alexa 488-maleimide (D, E and F) and subjected to SDS-PAGE at 16% (w/v) acrylamide (A, D, E and F) followed by Western blotting (B). In (C), 14% gel was used to resolve δ and b bands. Lanes M, Mb, 1, 2, 3 and 4 are respectively molecular markers, biotinylated molecular markers, biotinylated FOF1, Alexa 488-labeled FOF1 before free-dye removal by filtration, purified Alexa 488- labeled FOF1 and untreated FOF1. In (A), (C) and (D), gels were stained with CBB. In (B), biotinylated proteins were detected after blotting on PVDF membrane. In (E) and (F), gels without staining were imaged under ultra violet illumination to detect Alexa 488-fluorophore before (E) and after (F) incubating in SDS-running buffer for 1 h. The amount of FOF1 applied was 20 μg in all lanes. Molecular weights of molecular markers in kDa are shown on the left of each gel and subunit identification for F F on the right.
seen, suggesting that the a subunit is less reactive to biotin-maleimide.
I also labeled FOF1 with Alexa 488-maleimide to confirm incorporation in liposomal membranes (see below). The results were similar to the biotinylation above: no change in the subunit composition (Figure 3.1D), and apparently exclusive labeling of the c subunit (Figure 3.1E). Lane 2 of Figure 3.1E is the Alexa 488-labeled FOF1 before purification for the removal of free dye. The bottom band, which disappeared after soaking the gel in the SDS-running buffer for 1 h (Figure 3.1F), shows the free dye, of which the intensity is consistent with the labeling stoichiometry of ~50% estimated below. I removed the free dye by filtration (Figure 3.1E lane 3) in all experiments described below.
In Figure 3.1A and 3.1D, bands corresponding to δ subunit and b subunit overlap. To resolve them clearly, SDS-PAGE analysis at a lower concentration of acrylamide (14%(w/ v) compared to 16%(w/v) above) was performed (Figure 3.1C). In this gel, I can detect clear two bands corresponding to δ subunit and b subunit even after biotinylation or labeling with Alexa 488. This result suggests that the purified protein used here was the entire FoF1 and that possible contamination by separated F1 was negligible.
The labeling yield for Alexa 488 was estimated from the absorption spectra (Figure 3.2A). The peak wavelength of the Alexa 488 absorption shifted from 493 nm to 498 nm upon binding to FOF1 (Figure 3.2B), but I assumed that the extinction coefficient did not change appreciably and estimated the dye concentration accordingly. The dye/protein molar ratio, [Alexa 488] / [FOF1], was 2.47 in the final purified sample, while that of the reaction mixture was 4.43. Thus the reaction yield was ~50%, consistent with lane 2 of Figure 3.1E.
3.3. Reconstitution of FOF1 into giant liposomes
Several methods have been reported for the reconstitution of membrane proteins into giant liposomes: de-hydration and re-hydration [60,61], peptide-induced fusion [64], and
Figure 3.2. Absorption spectrum of Alexa 488-labeled FOF1. (A) Absorption spectrum of unlabeled FOF1 (black), Alexa 488 (red) and Alexa 488-labeled FOF1 (blue) in buffer MD. (B) The peak wavelength shift of Alexa 488 after labeling on FOF1. Absorption spectrum of Alexa 488 (red) and Alexa 488-labeled FOF1 (blue) in buffer MD normalized to the same peak height.
electro-formation [65]. I selected the de-hydration and re-hydration procedure because it works at physiological ionic strengths. To confirm successful reconstitution, I prepared liposomes with the Alexa 488-labeled FOF1 and observed them under a microscope. Three typical liposomes are shown in Figure 3.3A, 3.3B and 3.3C. Thin, circular contour of the
~75 μm liposome seen in the DIC image (arrow) matches the fluorescent ring in the bottom image, indicating incorporation of the Alexa 488-labeled FOF1 in the membrane.
Most of liposomes were attached to a large aggregate of lipids (the dark object, indicated by an asterisk, in Figure 3.3) as previously reported [57,61]. The lipid appendage contained the Alexa 488-labeled FOF1, as seen in the fluorescence image. Immediately after preparation, I often observed that a liposome with an appendage grew in size, indicating that the aggregate is the seed of the liposomal membrane. I also observed, though not many, appendage-free liposomes which were presumably pinched off an aggregate.
Liposomes prepared with unlabeled FOF1 were indistinguishable from the labeled ones in the DIC image (Figure 3.3D, 3.3E and 3.3F). The lipid aggregate in unlabeled liposomes also fluoresced, due to impurities in the soybean lipid, but the intensity was obviously weaker than the labeled liposomes. The liposomal membrane is hardly visible in Figure 3.3D, 3.3E and 3.3F, bottom (compare with Figure 3.3A, 3.3B and 3.3C, bottom), although its presence is barely detectable if directly observed by eye which accumulates signals. Much of the fluorescence in the labeled liposomes came from the Alexa 488- labeled FOF1.
3.4. Immobilization of a giant liposome on a glass surface via the embedded FOF1
Attaching the proteoliposome to a glass surface via the incorporated membrane protein to be studied serves three purposes: (i) the immobilized protein stays in the field of view and allows long-time observation, (ii) conformational changes of the protein on the
Figure 3.3. Reconstitution of FOF1 into giant liposomes. Giant liposomes into which Alexa 488-labeled FOF1 (A, B and C) or unlabeled FOF1 (D, E and F) was reconstituted were observed with transmitted light (DIC) or fluorescence illumination. Fluorescence images were spatially averaged using a Gaussian smoothing filter. Arrows indicate liposomal membranes (circular), whereas asterisks indicate lipid aggregates which fluoresced strongly due to the Alexa 488-labeled FOF1 (A, B and C) or less strongly due to fluorescent impurities in the soybean lipid (D, E and F). The liposomal membrane is invisible in (D, E and F, bottom). Scale bar, 20 μm.
surface can be monitored as a rotational movement of a probe attached to the protein, and (iii) immobilization of the liposome greatly facilitates its manipulation (injection of the probes, ligands, etc.). The FOF1 I used carried a his-tag at the N-terminus of each of the three β subunits (Figure 1.1C), which would specifically bind to a Ni-NTA modified glass surface. To test if this specific interaction leads to the desired immobilization, I prepared giant liposomes that contained the Alexa 488-labeled FOF1 and a small amount of fluorescent lipid (rhodamine-lipid) and transferred the proteoliposomes into an open chamber whose bottom glass surface was modified with Ni-NTA. After ~3 h when most liposomes have settled on the bottom, I observed the morphology of the liposomes on the glass surface by DIC and the locations of the Alexa 488-FOF1 and the rhodamine-lipid separately in the fluorescence images at respective wavelengths. The outermost contours of the liposomes on the chamber bottom were only slightly above the glass surface (≤10 μm)(dotted line in Figure 3.4D), and most were oval (Figure 3.4A, 3.4B and 3.4C) compared to the circular appearance as in Figure 3.3A, 3.3B, 3.3C, 3.3D, 3.3E or 3.3F (see below). A similar but somewhat smaller and more irregular contour was observed when the focus was shifted to the position of the glass surface. These observations indicate strong adhesion of the liposomal membrane to the Ni-NTA surface over a wide area, as diagramed in Figure 3.4D.
Comparison of the Alexa 488 and rhodamine fluorescence images show that the his- tagged FOF1 was concentrated on the bottom of the liposome where the membrane is tightly attached to the glass surface and its concentration was low in other parts of the membrane including the outermost edge (also compare with Figure 3.4E, 3.4F and 3.4G). A similar phenomenon has previously been reported where diffusible protein molecules in one liposome were concentrated at the interface with another liposome whose surface presented dense high-affinity sites for the protein [66]. A closer look at the surface images of Alexa 488-FOF1 in Figure 3.4A, 3.4B and 3.4C reveals that the distribution of FOF1 on
Figure 3.4.
Figure 3.4.
Figure 3.4. Specific binding of the proteoliposomes to the Ni-NTA modified glass surface through the his-tags on FOF1. (A, B and C) A giant liposome containing Alexa 488-labeled FOF1 and rhodamine-lipid is seen in the DIC and fluorescence images (at Alexa 488 and rhodamine wavelengths). The focus of the images on the left was at the outermost edge of the liposome (dotted line in D), whereas the focus was at the glass surface on the right. Scale bar, 20 μm. (E, F and G) The same set of images for a liposome in the presence of 0.2 M imidazole. Arrows indicate liposomal membranes, and asterisks lipid aggregates. All fluorescence images were spatially averaged using a Gaussian smoothing filter. (D and H) Schematic cross sections for the case of adhesion (D) and no adhesion (H). Adhesion occurs in the absence of imidazole (A, B and C), resulting in flattening of the liposome and condensation of FOF1 on the bottom surface. Dotted lines indicate positions of the outermost edges of liposomes.
the glass surface is not uniform, consisting of zones with a relatively high-density periphery. These are not membrane wrinkles or overlapping membranes, because I never saw such heterogeneity in the lipid image (except for the very bright lipid aggregates). The likely explanation for the non-uniform distribution of FOF1 is that the adhesion of the membrane to the glass surface proceeded in several phases, beginning with a small area (s) of contact. The FOF1 molecules in the initial contact area should be immobile, while the molecules in the rest of the membrane can freely diffuse and bind to the glass surface at the edge of the initial contact area. This way the contact area would slowly expand, accumulating FOF1 densely at the periphery. If, for some reason (e.g., by flow), the expansion of the contact area became fast, then the density of FOF1 in the fast growing contact zone would be low. Or, another part of the free membrane might touch the surface, starting a similar process.
The extensive attachment of the liposomal membrane to the glass surface was due to the specific interaction between the his-tags of FOF1 and the Ni-NTA modified glass surface. In the presence of imidazole that competes with histidine, the outermost edges of the giant liposomes were high above the glass surface (Figure 3.4H) and were always circular (Figure 3.4E, 3.4F and 3.4G, DIC). The bottom contact was not clear and there was no sign of FOF1 condensation at the bottom nor of FOF1 depletion from the free membrane area (Figure 3.4E, 3.4F and 3.4G, fluorescence). In the absence of imidazole, the FOF1 molecules in the adhesion area must be immobilized on the glass surface through the three his-tags that bind to Ni-NTA.
3.5. Binding of streptavidin-coated beads to biotinylated FOF1 in membrane
To attach a submicron bead to the rotor of FOF1 to observe its rotation (a conformational change), I reconstituted the biotinylated FOF1, which would bind streptavidin on the c subunits (Figure 3.1B), into giant liposomes. After the liposomes
settled on the Ni-NTA modified glass surface, streptavidin-coated beads were injected into giant liposomes selected for an oval shape which is a sign of good adhesion (large contact area with glass surface). In ~10 min, many beads settled on the bottom of the liposome (black dots in Figure 3.5A, 3.5B and 3.5C). In contrast, few beads were seen on the bottom if the FoF1 had not been biotinylated (Figure 3.5D, 3.5E and 3.5F); the white to gray unsharp dots are out-of-focus images of beads that were floating above the surface. With the biotinylated FOF1, most beads on the bottom were tightly bound to the FOF1
immobilized on the glass surface. The beads did not move: they are clearly visible in the image averaged over 10 s (bottom of Figure 3.5A, 3.5B and 3.5C). With unbiotinylated FOF1, on the other hand, most of the (out of focus) bead images disappeared after averaging (bottom of Figure 3.5D, 3.5E and 3.5F), showing they were mobile (undergoing Brownian motion). Thus, the biotinylated FOF1 sitting in the membrane and anchored to the glass surface can still bind a bead tightly through the specific streptavidin-biotin linkage.
3.6. ATP-driven rotation of FOF1 in the liposomal membrane
Observation of FOF1 rotation requires that a bead is bound by only one FOF1
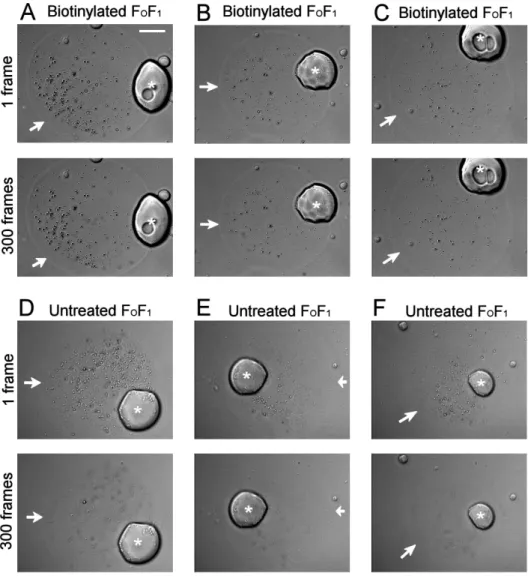
molecule: if two molecules immobilized on the surface bind a bead simultaneously, rotation would be hindered. To reduce the probability of multiple binding, I diluted the biotinylated FOF1 with untreated FOF1 in the reconstitution. Several minutes after the injection of streptavidin-coated beads into an oval-shaped giant liposome immobilized on the Ni-NTA modified glass surface, I began to observe some beads settled on the surface to start rotating counterclockwise (1 mM ATP was present in the solution). Three typical examples are shown in Figure 3.6A, 3.6B and 3.6C. Only a few among tens of beads settled on the bottom rotated. Some started to rotate as soon as they came down to the bottom, and others started with variable delays. Most rotating beads stopped, and some resumed rotation again, during an observation for ~2 h; MgADP inhibition [67,68] is the likely cause
Figure 3.5. Specific binding of streptavidin-coated beads to biotinylated FOF1 in giant liposomes. DIC images focused at the glass surface obtained 10 min after injection of streptavidin-coated beads (black particles in the image) into a giant liposome with biotinylated (A, B and C) or untreated (D, E and F) FOF1. Arrows indicate membranes and asterisks lipid aggregates. Images at bottom have been accumulated for 300 frames (10 s), whereas those at top are snapshots (1 frame = 33 ms); moving beads disappear in the accumulated images. Scale bar, 20 μm.
Figure 3.6. Rotation of FOF1 in giant liposomes immobilized on the Ni-NTA modified glass surface. (A, B and C) Sequential images of a rotating bead at 33- ms intervals. 6 counterclockwise revolutions in 5 s in (A), 8 revolutions in 5 s in (B) and 4.75 revolutions in 5 s in (C) respectively. Image size, 3 μm × 3 μm. (D) Time courses of rotation for beads that made more than 10 revolutions. Counterclockwise rotations (viewed from top) are plotted positive. The rotary angles were judged by eye at the resolution of 30°; angle differences between successive video frames were restricted to -150° to +180°, resulting in the apparent backsteps in fast-rotating beads.
of these behaviors. Detachment of rotating beads was also observed.
Time courses of rotation of beads that made more than 10 revolutions are shown in Figure 3.6D. The rotary speed varied significantly. The primary reason is the heterogeneity in both size and shape of the beads that I used in this research, which resulted in a wide distribution of the viscous drag against the beads; aggregates of beads also rotated, and these were slow. Some beads lapsed into short pauses frequently, probably due to steric hindrances because the pauses usually occurred at the same angle(s). The apparent backsteps seen only in the fastest beads (Figure 3.6D) are presumably due to incompleteness of the data analysis: when a bead rotates more than 180° in one video frame (33 ms), the event is recorded as a negative rotary step because my analysis restricted the rotary angle per frame to be between −150° and +180° (see Methods).
3.7. Position of rotating beads in a giant liposome
As shown above, Alexa 488-labeled FOF1 in a giant liposome bound to the Ni-NTA modified surface in a non-uniform fashion (Figure 3.4A, 3.4B and 3.4C). I suspected that the position of the rotating beads in giant liposomes might correspond to the high intensity zones in the fluorescence image of Alexa 488-labeled FOF1. To confirm this, I prepared giant liposomes that contained the Alexa 488-labeled FOF1 and the biotinylated FOF1 and observed rotation of streptavidin-coated beads after capturing the fluorescence image. As shown in Figure 3.7, some rotating beads were observed in giant liposomes and apparently their positions were distributed non-uniformly. Except for one liposome (Figure 3.7D), however, I did not find correlation between the positions of rotating beads and the bright areas where the FOF1 density would be high. High density, suggestive of tight binding of the membrane to the glass surface, is not required for rotation.
Figure 3.7. Positions of rotating beads in a giant liposome. (A-H) A giant
liposome containing Alexa 488-labeled FOF1 and biotinylated FOF1 is observed in the DIC and fluorescence images. White dots represent the positions of rotating beads that made more than 10 revolutions. The focus of the images was at the glass surface. Arrows indicate liposomal membranes, and asterisks lipid aggregates. All fluorescence images were spatially averaged using a Gaussian smoothing filter. Scale bar, 20 μm.
3.8. Effects of inhibitors on rotation of FOF1
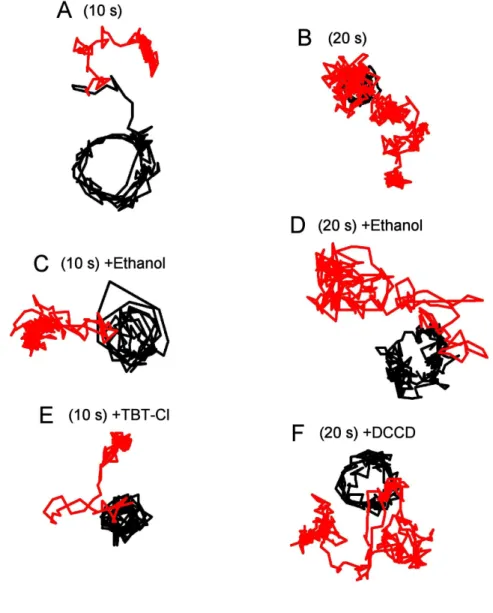
The FO part of the FOF1 complex is not very stable and may lose its functional integrity during purification and/or reconstitution. One way to assess its intactness, though not in a fully convincing manner, is to ask whether the final sample retains sensitivity to inhibitors known to act on intact Fo. Here I tested the effects of two such inhibitors on the rotation of FOF1 in the giant liposomes. One was DCCD, a well-known inhibitor that binds to c subunits in an irreversible fashion [69,70]. The other was TBT-Cl which binds to the a subunit reversibly [46,71]. Because these inhibitors were dissolved in methanol, I added methanol alone in control experiments.
Two slightly different procedures were used for preparation of giant liposome. In one, I added 0.5%(v/v) ethanol, 10 μM TBT-Cl or 10 μM DCCD into 0.5 ml of buffer R in the open observation chamber at the final step of preparation (Figure 3.8A and 3.8C). In this procedure, however, TBT-Cl or DDCD may aggregate in buffer solution before they reach FOF1 or liposomal membrane. In the other procedure, therefore, I added DCCD at the de- hydration stage: 5%(v/v) ethanol alone, or 100 μM DCCD in ethanol, was added to the 40 μl lipid/proteolipid mixture and incubated for 1 h before de-hydration was started (Figure 3.8A and 3.8D).
In the first procedure, even in the presence of the inhibitors, I found some beads rotated counterclockwise continuously (Figure 3.8B). The rotary speed varied significantly as observed previously, because of the heterogeneity in both size and shape of the beads that I used. It has been reported that TBT-Cl decreases the average rotation rate to 4% when monitored with 80-nm gold particles [46]. The beads I used in this study, however, are much larger and thus their rotation rate was already limited severely by viscous friction. Thus I could not detect the possible decelerating effect of TBT-Cl.
I counted the number of beads that made more than 10 revolutions in the initial 10 minutes after injection of beads. 4.3 ± 0.56, 4.5 ± 0.96 and 2.9 ± 1.2 (mean ± s.e.m.)
Figure 3.8.
(D)
A
Proteolipid suspensions
Incubation for 1 h
De-hydration
Re-hydration
(C)
Figure 3.8. Effects of inhibitors on rotation of FOF1 in giant liposomes. (A) Two timings of inhibitor addition: (C) to the buffer in the observation chamber, and (D) to the proteolipid suspension prior to dehydration. (B) Time courses of rotation for beads that made >10 revolutions in the presence of inhibitors added to the observation chamber. Rotation with ethanol, TBT-Cl and DCCD are shown in magenta, green and cyan lines respectively. Counterclockwise rotations (viewed from top) are plotted positive. (C and D) Number of rotating beads per giant liposome in the presence of inhibitors added at (C) or (D) in (A). Bars and lines indicates means and s.e.m. respectively. Number of giant liposomes examined (N) are shown on the bottom.
beads per giant liposome rotated in the presence of ethanol, TBT-Cl and DCCD respectively (Figure 3.8C). DCCD showed some inhibitory effect, although the large s.e.m. precludes a clear conclusion.
The second procedure gave similar results. 7.0 ± 2.0 and 4.7 ± 1.2 (mean ± s.e.m.) beads per giant liposome rotated in the presence of ethanol and DCCD respectively (Figure 3.8D). Again, DCCD tended to decrease the number of rotating beads. These results indicate that the integrity of the FOF1 immobilized on the surface is not entirely impaired.
3.9. FOF1 must be in the lipid membrane to rotate
It could be argued that, at the bottom contact between a giant liposome and the Ni- NTA glass surface, lipid membrane might be distorted or non existent and the FOF1
molecules in this region are not embedded in the lipid environment. Although the images of fluorescent lipid (Figure 3.4A, 3.4B and 3.4C) suggest that this is not the case, I sought additional evidence that the rotating FOF1 was indeed embedded in the lipid membrane, by asking whether FOF1 can rotate in the absence of lipids. That FOF1 can rotate in detergent micelles has been documented [44,46]. Here I made a similar system and exchanged the solution alternately with or without detergent (Triton X-100) to see whether bare FOF1 can rotate.
At the beginning I verified that in this system streptavidin-coated beads specifically bind to biotinylated FOF1, and the his-tags of FOF1 to the Ni-NTA modified glass surface. To check streptavidin-biotin interaction I compared the number of rotating beads between biotinylated FOF1 and untreated FOF1. ~150 beads per ~100,000 μm2 rotated by biotinylated FOF1 but no beads rotated by untreated FOF1 (Figure 3.9A). Additionally, to test the interaction between his-tags and the Ni-NTA modified glass surface, I counted the number of rotating beads before and after exchanging the solution with 0.2 M imidazole.
Figure 3.9. Rotation of FOF1 in the presence of 0.05% (v/v) Triton X-100. Biotinylated FOF1 in the detergent was attached to the Ni-NTA modified glass surface, and bead rotation examined. (A) Specific binding of streptavidin-coated beads to biotinylated FOF1. Biotinylated FOF1 or untreated FOF1 was attached to the Ni-NTA modified glass surface, and numer of rotating beads counted. (B) Specific binding of biotinylated FOF1 to the Ni-NTA modified glass surface. The number of rotating beads was counted before and after exchanging the solution with 0.2 M imidazole. (C) The number of rotating beads in solutions with or without Triton X-100, alternately exchanged. Different symbols show three series of experiments in three separate flow chambers. (D) Slow decrease in the number of rotating beads in the absence of solution exchange. Line shows the mono-exponential fit with a time constant 4.4 ± 1.5 h. The surface area examined are shown on the upper right of each figure.