Clarification of the principle governing axon-selective
myelination by oligodendrocytes and regulation of
neuronal information processing in the white matter
Yasuyuki Osanai
DOCTOR OF PHILOSOPHY
Department of Physiological Sciences
School of Life Science
SOKENDAI
(The Graduate University for Advanced Studies)
2015
2
Acknowledgement
Foremost, I would like to express my sincere gratitude to my advisor Prof. Kazuhiro Ikenaka of National Institute for Physiological Sciences for providing me an opportunity to conduct graduate study in his laboratory. I appreciate his continuous supports during my study and research, bonhomie, motivation, enthusiasm, and immense knowledge, which guided me throughout my research and writing this thesis.
I also would like to express my special appreciation to Dr. Takeshi Shimizu, Assistant Professor in National Institute for Physiological Sciences, who has been my supervisor since the beginning of my study. He provided me with a lot of helpful suggestion, important advice and guidance during the course of my work. He has devoted his precious time and made valuable suggestions which indeed helped to improve my thesis.
Special thanks are expressed to Prof. Atsushi Nambu, Prof. Yumiko Yoshimura, Dr. Takuma Mori, Dr. Nobuhiko Hatanaka, Dr. Kenta Kobayashi and Dr. Yoshitaka Kimori for providing me numerous ideas, opportunity to do experiment in their laboratories, noble materials, relevant discussions, and teaching me their sophisticated techniques during my research work.
I would also like to thank the members of my thesis committee; Prof. Mikio Fruse, Prof. Yumiko Yoshimura, Prof. Atsushi Nambu, and Prof. Schuichi Koizumi for their
3
encouragement and insightful comments.
I appreciate laboratory members in Prof. Y. Yoshimura’s lab for their kindness and supports.
I appreciate all members in Prof. K. Ikenaka’s lab: Dr. Takeshi Yoshimura, Dr. Naoko Inamura, Dr. Yugo Ishino, Dr. Takahiro Shimizu, Dr. Shota Sugio, Dr. Wilaiwan Wisessmith, Dr. Hirokazu Hashimoto, Jiang Wen, Mai Narumi, Jiayi Li and Saori Kikuchihara for stimulating discussions and for a good time in Ikenaka’s lab. I am deeply grateful to Kazuo Kunisawa and Rie Taguchi for giving me continuous supports and encouragement as members of the same research group in Ikenaka’s lab.
I want to thank the people who support me during my doctoral course in Okazaki.
4
Table of contents
Contents Abbreviations Summary Introduction
Materials and Methods Results Discussion References
Table Figure legends Figures
4 5 6 9 12 17 23 29 38 39 47
5
Abbreviations
AAV2: Adeno-associated virus type2
AMPA: α-amino-3-hydroxy-5-methyl-4-isoxazolepropionic acid receptor BDA: Biotin dextran amine
BDNF: Brain-derived neurotrophic factor BFP: Blue fluorescent protein
CNS: Central nervous system DTI: Diffusion tensor imaging GABA: Gamma-aminobutyric acid
Kir2.1: Inwardly-rectifying potassium channels 2.1 M1: Primary motor cortex
M2: Secondary motor cortex
nAchR: Nicotinic acetylcholine receptor NCAM: Neural cell adhesion molecule NMDA: N-methyl-D-aspartate receptor O-2A: Oligodendrocyte-type2-astrocyte OPCs: Oligodendrocyte precursor cells PHAL: Phaseolus vulgaris-leucoagglutinin PLP: Myelin proteolipid protein
PSA-NCAM: Polysialylated neuronal cell adhesion molecule RV: Rabies virus
RV-GFP: Rabies virus harboring the gene encoding GFP S1: Primary somatosensory cortex
TTX: Tetrodotoxin vg: viral genome
6
Summary
Oligodendrocytes myelinate multiple axons in the central nervous system (CNS). Conduction velocity of myelinated axons is at least 50 times faster than that of unmyelinated axons. Myelin is also important for axonal survival because oligodendrocytes metabolically support axons via myelin. In contrast to a Schwann cell that myelinates an axon in the peripheral nervous system, one oligodendrocyte myelinates multiple axons in the CNS. A recent paper reports depolarized oligodendrocytes increase conduction velocity of neuronal axons they myelinate. This brings up an idea that depolarization of one oligodendrocyte increases conduction velocity of multiple axons that are myelinated by one oligodendrocyte simultaneously.
To address this issue, it is important to understand the interaction between each oligodendrocyte and neuronal axons more precisely. High density of oligodendrocytes in the CNS prevents us from observing each oligodendrocyte morphology by the regular method to visualize oligodendrocytes. I found attenuated rabies virus sparsely labels oligodendrocytes in the white matter of the mouse brain and adeno-associated virus type2 (AAV2) efficiently labels neuronal axons. Interaction between each oligodendrocyte and neuronal axons was successfully detected by dual injection of attenuated rabies virus and AAV2 into the mouse brain.
To visualize processes of each oligodendrocyte and its myelinating axons derived from different brain areas, AAV2-DsRed2 and AAV2-BFP were injected into motor cortex and sensory cortex, respectively, and attenuated rabies virus harboring the gene encoding GFP was injected to the corpus callosum. About a half (58.4%) of callosal oligodendrocyte ensheathed axons derived from both motor and sensory cortex, whereas the other half ensheathed axons derived from either motor cortex or sensory
7
cortex. Therefore callosal oligodendrocytes were classified into 3 groups: oligodendrocytes that are dominantly myelinating axons derived from 1) motor cortex, 2) sensory cortex, 3) both brain regions. This result was different from myelination on axons derived from an identical brain region of each hemisphere: majority of callosal oligodendrocytes evenly myelinated axons derived from each hemisphere. These results suggest that callosal oligodendrocytes of mice distinguish axons derived from different brain regions but not from the same region of the brain even when they are from different hemispheres.
To investigate chiasmal oligodendrocyte myelination on axons derived from each eyeball, AAV2-DsRed2 and AAV2-BFP were injected, respectively. About a half of chiasmal oligodendrocytes dominantly myelinated axons derived from one of eyeballs in contrast with majority of callosal oligodendrocytes that evenly myelinated axons derived from each hemisphere. The result suggests functional difference between chiasmal and callosal oligodendrocytes.
It is known that oligodendrocytes initiate myelination on axons by sensing their axonal activity. However, it has not been shown whether one oligodendrocyte preferentially myelinates active axons or not after initiation of myelination. To examine whether each oligodendrocyte selectively myelinates highly active axons, I trimmed and sutured eyelids at postnatal day 10 and assessed chiasmal myelination on axons derived from sutured or intact eyes of 8-week-old mice. There were no significant differences between myelination on axons derived from sutured or intact eyes. This result suggests that chiasmal oligodendrocyte myelination does not distinguish active or inactive axons once myelination program is turned on.
In this study, I developed a novel method to observe interaction between each
8
oligodendrocyte and neuronal axons, and revealed that there were 3 groups of callosal oligodendrocyte. There were significant differences between callosal and chiasmal oligodendrocytes myelination involving myelination on axons derived from bilateral hemispheres or eyeballs. This study reveals that some parts of oligodendrocytes selectively myelinate axons, depending on neuronal subtypes. This study also suggests activity dependent myelination does not occur after initiation of myelination.
9
Introduction
Oligodendrocytes are glial cells that myelinate neuronal axons in the central nervous system (CNS). Myelin insulates axons to increase conduction velocity of neuronal action potentials. Myelin is also important for axonal survival because oligodendrocytes metabolically support axons through transport of lactate or pyruvate (Lee et al., 2012). Conduction velocity of myelinated axons is at least 50 times faster compared with unmyelinated axons (Nave, 2010; Emery, 2010). Rio Hortega (1928) first characterized oligodendrocyte by silver carbonate impregnation. In contrast to a Schwann cell that myelinates an axon in the peripheral nervous system, an oligodendrocyte extends many processes (Average 15) and ensheaths multiple axons (Bunge et al., 1962). Individual myelin internodes along the axon are constructed by different oligodendrocytes. Process number and myelin thickness constructed by a single oligodendrocyte vary among different CNS regions. For example, number of myelin internodes formed by an oligodendrocyte is higher in the corpus callosum than in the cerebellum (Weruaga-Prieto et al., 1996; Chong et al., 2011), and thickness of myelinated fiber is thicker in the cerebellum than in the corpus callosum (Weruaga-Prieto et al., 1996).
A recent report showed depolarization of oligodendrocytes increases conduction velocity of neuronal axons (Yamazaki et al., 2007). This finding suggests that depolarization of one oligodendrocyte simultaneously increases conduction velocity of multiple axons, owing to multiple myelination by one oligodendrocyte. If one oligodendrocyte ensheaths neuronal axons that are involved in an identical neuronal circuit, depolarization of the oligodendrocyte comprehensively increases information processing of the neuronal circuit. Involvement of oligodendrocytes in modulation of neuronal function is further supported by the finding that neurotransmitter triggers
10
exosome transfer from oligodendrocytes to axons (Frühbeis et al., 2013).
An idea that oligodendrocytes selectively myelinate neuronal axons is supported by several oligodendrocyte characters. For example, (1) pre-mature oligodendrocytes have a lot of processes compared with mature oligodendrocytes (Czopka et al., 2013). (2) Oligodendrocytes express neurotransmitter receptors, e.g., AMPA receptor (De Biase et al., 2011; Itoh et al., 2002), NMDA receptor (De Biase et al., 2010; Káradóttir et al., 2005) and GABA receptor (Gilbert et al., 1984; Von Blankenfeld et al., 1991). (3) Oligodendrocyte precursor cells (OPCs) make synapses to axons (Lin and Bergles, 2004). These findings indicate that oligodendrocytes need to myelinate neuronal axons selectively. To address how oligodendrocytes select axons to myelinate, it is important to identify the neurons whose axons are ensheathed by each oligodendrocyte. Effective method to analyze each oligodendrocyte myelination is yet to be established because high density of oligodendrocytes in the CNS prevents us from detecting precise morphology of each oligodendrocyte. Chong and colleagues (2011) addressed to resolve this problem by transgenic mouse line whose oligodendrocytes were sparsely labeled by membrane associated EGFP, however, it was impossible to visualize oligodendrocytes in the specific brain area because extremely small number of oligodendrocytes were randomly labeled in this transgenic mice. In this study, I established a novel method to visualize interaction between myelinating oligodendrocytes and the myelinated neurons in the white matter of the mouse brain, and examined whether oligodendrocytes selectively or randomly myelinate axons.
Previous studies report that active neurons promote myelination in vitro and in vivo. Gyllensten and Malmfors (1963) found the number of myelinated axons was decreased in the mouse optic nerve reared in the dark compared with that reared normally, and artificial eye openings of neonatal rabbits (postnatal day 5) increased
11
expression levels of myelin proteins (Tauber et al., 1980). Tetrodotoxin (TTX) administration for 2 days beginning on 7 days before initiation of myelination decreases the number of myelinated fibers by 80% in vitro (Demerens et al., 1996). These results indicate that myelination is regulated by axonal activity. Several factors released from axons in an activity dependent manner that are involved in the initiation of myelination have been identified, among which ATP (Ishibashi et al., 2006) and glutamate (Martinez-Lozada et al., 2014) are considered to play important roles. Lundgaad and colleagues (2013) showed neuregulin and BDNF are essential factors for glutamate dependent myelination. Gibson and colleagues (2014) used in vivo optogenetic techniques in awake animal, and confirmed that neuronal activity promotes oligodendrocyte proliferation and differentiation. Recent reports using MRI or diffusion tensor imaging (DTI) showed learning-dependent white matter changes (Fields, 2011). Human DTI study revealed juggling practice changes microstructure of subcortical white matter (Scholz et al., 2009). Although several lines of evidence showed that initiation of myelination is axonal activity dependent, it is unclear whether individual oligodendrocytes preferentially ensheaths active axons compared with inactive axons once myelination is initiated.
Speed and timing of neuronal information transaction is essential for cognitive process and learning. An oligodendrocyte can modulate conduction velocity of neuronal axons and integrate their activity through multiple myelinations. To understand oligodendrocyte function in neural information processing, identification of neurons whose axons are entheathed by each oligodendrocyte is one of the first steps to be achieved. To address this issue, I established a new technique to visualize oligodendrocyte processes and axonal interactions in the mouse brain, and applied this technique to the mouse corpus callosum and the optic chiasmal axons derived from sutured eye.
12
Materials and Methods
All animal procedures were conducted in accordance with the guidelines described by National Institutes of Health Guide for the Care and Use of Laboratory Animals, and the National Institute for Physiological Sciences Animal care and Use Committee.
AAV2 vector production
I ligated DsRed2 or BFP cDNA into pAAV2-based vector, which contains modified chicken β-actin promoter with a cytomegalovirus immediate-early enhancer. Dr. Kobayashi produced a recombinant AAV2-based vector containing the DsRed2 or BFP gene (AAV2-DsRed2 or AAV2-BFP) in accordance with the previous report (Ito et al., 2007). AAV2 vectors were prepared by means of the previously described 3-plasmid transfection adenovirus-free protocol with minor modifications (Matsushita et al., 1998, Okada et al., 2005). In brief, HEK293 cell (3×10 6cells in 10 cm tissue culture dish) were cotransfected with pAAV-RC2, pHelper (Cell biolabs, Inc) and pAAV2-DsRed2 or BFP. The crude viral lysate was purified with 2 rounds of cesium chloride ultracentrifugation. The titer of the viral stock was determined against plasmid standards by real-time PCR with primers 5’-CCGTTGTCAGGCAACGTG-3’ and 5’-AGCTGACAGGTGGTGGCAAT-3’ ; subsequently, the stock was dissolved in a buffer (50 mmol/L of HEPES [pH7.4] and 0.15 mol/L of NaCl [HN buffer]) before infection.
Production of attenuated rabies virus-GFP (RV-GFP)
Dr. Mori produced RV-GFP as described previously (Mori and Morimoto, 2014). About 1.0×10⁴ BHK-21 or BHK-T7/9 cells, the latter expressing T7 RNA polymerase,
13
were seeded into each well of a 6-well plate. Cells were transfected with plasmid coding full RV-GFP genome (2 µg pcDNA-HEP-ΔG-GFP) and helper plasmids encoding rabies nucleoprotein (RN; 1 µg pcDNA-RN), phosphoprotein (RP; 0.5 µg pcDNA-RP), and polymerase (RL; 0.25 µg pcDNA-RP) genes using TransIT-LT1 (Takara), as described by the manufacturer. The plates were incubated for 2 days at 32℃ in an atmosphere containing 5% CO2. The numbers of GFP positive cells producing HEP-ΔG-GFP in each well were counted. Cells from wells containing > 20 GFP positive cells were transferred to a 10 cm plate and transfected with pCAGGS-RVG. The culture medium containing RV-GFP was collected. The titers of RV-GFP were increased by three rounds of ultracentrifuge, resulting in 3.2×10⁷ infectious units per ml of concentrated RV-GFP.
Virus injection into the brain of mice
I injected viral vectors into the brain of adult (8 weeks old) female C57BL6 mice. Mice were anesthetized with ketamine/xylazine solution and placed in a stereotaxic frame (Narishige) with mouse adapter. AAV2-DsRed2 and AAV2-BFP were stereotaxically injected into the somatosensory cortex of each hemisphere (1.0 mm posterior and ±1.5 mm lateral to the Bregma, at a depth of 0.3 mm) or the motor cortex and sensory cortex of identical hemisphere (1.0 mm posterior and 0.8 mm lateral (motor cortex), 3.0 mm lateral (sensory cortex) to the Bregma at a depth of 0.3 mm). After opening the skull around the injection site, 0.3 – 1.0µl of viral solution (1.0 - 2.8×10⁹ viral genome (vg)) was injected through pulled glass pipettes (inner diameter 20-30 µm) using air pressure. I waited for 3 min before withdrawing the pipette. Incisions were closed by wound clips. Two weeks later, One µl of RV-GFP was stereotaxically injected into the corpus callosum (1.0 mm posterior and 0.5 - 0.8 mm lateral to the bregma, at a depth of 1.0 mm). Mice were sacrificed 4 days after RV-GFP
14
injection.
Virus injection into mouse eyeballs and the optic chiasm
I injected AAV2-BFP and AAV2-DsRed2 to eyeballs of 6-week-old female C57BL6 mice. Mice were anesthetized and placed in a stereotaxic frame as mentioned above. Intravitreal injection was performed using a pulled glass pipettes. AAV2 solution (1 µl: 1.0×10⁹ vg) was injected to each eye through pulled glass pipettes (inner diameter 40 µm) using air pressure. Two weeks later, 1 µl of RV-GFP was stereotaxically injected into the optic chiasm (0.2 mm posterior and 0.0 mm lateral to the bregma, at a depth of 5.0-5.3 mm). Mice were sacrificed 4 days after RV-GFP injection.
Monocular deprivation and virus injection
Eyelids were trimmed and sutured under isoflurane anesthesia as previously described in P10 mice (Gordon and Stryker, 1996). The lid of the operated eye was sutured shut for 1 month after operation. Eyes were re-opened under ketamine/xylazine anesthesia before AAV2s injection. Intravitreal injection was performed as mentioned above. Re-opened eye was re-sutured after the injection of AAV2s. Two weeks later, RV-GFP was injected to the optic chiasm as mentioned above and mice were sacrificed 4 days after RV-GFP injection.
Histology
Mice were anesthetized and perfused transcardially with 4% paraformaldehyde in 0.1M phosphate buffer (pH. 7.4). Brains were post-fixed in 4% paraformaldehyde overnight at 4℃. The optic chiasms were post-fixed in 4% paraformaldehyde 1-3h at
15
room temperature. The brains were embedded by 5% agarose before sectioning. The 100 µm thick sections were obtained for the analysis of interaction between oligodendrocytes and neurons by vibratome. The sections and the optic chiasms were mounted and coverslipped by the general method. Alternatively, Post-fixed brains and optic chiasms were cryoprotected in PBS containing 20% sucrose overnight, embedded in OCT compound (Sakura Finetechnical Co., Tokyo, Japan), and cut into 20 µm slice by cryostat (Leica CM3050, Germany) for in situ hybridization and immunohistochemistry.
In situ hybridization
The protocol for in situ hybridization was previously described (Ma et al., 2006). Rat GFAP cDNA and mouse PLP cDNA (Kagawa et al., 1994) containing plasmid was used to generate cRNA probes. The sections were treated with proteinase K and hybridized overnight. Binding of DIG-labeled cRNA probe was detected with an alkaline phosphatase-conjugated anti-DIG antibody and visualized with an NBT/BCIP alkaline phosphatase reaction.
Immunohistochemical analysis
Sections performed in situ hybridization were used after washing sections with PBS one time for 5 min. The sections were blocked by incubating with 10% normal goat serum in PBS-T (0.1% Triton-X100) for 1 hour at room temperature. Sections were incubated with rabbit anti-GFP polyclonal antibody (1:1000; Invitrogen, USA) at 4℃ overnight followed by incubation with biotinylated anti-rabbit IgG (1:400; Vector laboratories, USA) for 1 hour at room temperature. After washing with PBS-T for 5 min three times, sections were incubated with ABC solution (horseradish
16
peroxidase-streptavidin-biotin complex, Vectastain ABC kit; Vector laboratories, CA, USA) 30 min. The sections were colored with 3,3’ – diaminobenzidine (DAB) solution with 0.03% H2O2. The sections were dehydrated with serial concentration of ethanol (70%, 80%, 90%, 100%), cleared with clear plus and were mounted with permount solution.
Quantification of myelination
The 100 µm coronal sections of brains and whole optic chiasm from mice injected with AAV2s and RV-GFP were analyzed for interaction between neurons and oligodendrocyte. The 60 or 100× Z-stack projections were acquired at 0.5 µm intervals using a Nikon A1R confocal laser scanning microscope system and NIS-element software (Nikon Corp., Japan). Oligodendrocytes that were able to interact with over 5 axons labeled by each AAV2, and myelinated over 3 labeled axons by the oligodendrocyte were chosen to be analyzed. I defined myelinated axons as axons overlapped with oligodendrocyte processes for more than 20 µm. I defined myelination ratio as following, Myelination ratio = Number of labeled-axons myelinated by one oligodendrocyte / Total number of labeled axons that were reachable by the oligodendrocyte × 100
17
Results
Attenuated rabies virus sparsely labeled oligodendrocytes in the corpus callosum.
High density of oligodendrocytes in the white matter makes it difficult to observe individual oligodendrocyte morphology. If I conduct immunostaining with oligodendrocyte markers, I would not be able to recognize individual oligodendrocyte because huge amount of oligodendrocytes would be simultaneously labeled. Recently, Mori and Morimoto developed highly attenuated strain of glycoprotein-deficient rabies virus (RV) and reported that the RV labels not only neurons but also astrocytes and oligodendrocytes (Mori and Morimoto, 2014). I found that injection of the rabies virus harboring the gene encoding GFP (RV-GFP) into the corpus callosum and the optic chiasm of the mouse sparsely labeled oligodendrocyte-like cells (Fig. 1, A, B and 2A). RV-GFP positive cells were doubly labeled by in situ hybridization for oligodendrocyte marker PLP mRNA and immunostaining for GFP. Over 80% of GFP positive cells were oligodendrocytes in the corpus callosum and the optic chiasm (Fig. 1, C, D, E, Fig. 2, B, C and D). About 10% of the remaining GFP-positive cells were astrocytes, detected by double labeling of astrocyte marker GFAP mRNA and GFP (Fig. 1F). Since oligodendrocyte possesses fine processes (Fig.1B), its process length and morphology were distinguishable from astrocyte. These results indicate that RV-GFP is an useful tool to observe individual oligodendrocyte morphology in the white matter of the mouse brain.
Observation of interaction between neuronal axons and an oligodendrocyte by the use of RV-GFP and AAV2s.
AAV2 is applicable to anterogradely label neuronal axons in the CNS (Chamberlin et
18
al., 1998). AAV2-DsRed2 and AAV2-BFP were used to label neuronal axons projecting to contralateral side of the cerebral cortex through the corpus callosum in the mouse brain. These AAV2s were injected into sensory cortex (S1 hindlimb) of each hemisphere. Two weeks after AAV2s injection, I further injected RV-GFP to the corpus callosum to label callosal oligodendrocytes (Fig.3). Both oligodendrocytes and axons adjacent to the oligodendrocytes were successfully labeled by fluorescent proteins (Fig. 4). Consistent with a previous report (Sturrock, 1980), a small number of axons were ensheathed by one oligodendrocyte even though many axons located adjacent to the oligodendrocyte (Table 1.). This result suggests callosal oligodendrocytes do not randomly ensheath nearby axons adjacent to the oligodendrocyte.
To analyze GFP positive oligodendrocyte myelination on axons expressing DsRed2 or BFP, I detected GFP-positive oligodendrocyte processes overlapping with axons (labeled by either AAV2-DsRed2 or AAV2-BFP) over 20 µm (Fig. 5, A, B and C). To further investigate GFP-positive oligodendrocyte myelination on labeled axons, Z series confocal images (identical to Fig. 5A) were modified by rotational morphological processing (Kimori et al., 2010), and extracted regions containing oligodendrocyte and labeled axons. These extracted regions were reconstructed as volume-rendered images (performed by Dr. Kimori). Three-dimensional reconstruction of confocal microscope images clearly demonstrated that GFP positive oligodendrocyte myelinated an axon expressing fluorescent protein (Fig. 5, D and E). These results indicate that fluorescent labeling with RV-GFP and AAV2s is a valuable tool for detecting interaction between each oligodendrocyte and neuronal axons.
An callosal oligodendrocyte myelinated axons derived from motor cortex and sensory cortex.
19
To investigate callosal oligodendrocyte myelination on axons derived from specific cortical areas, I injected AAV2-DsRed2 or AAV2-BFP to motor (M2 and M1) or sensory cortex (barrel field), respectively. Two weeks after AAV2s injection, RV-GFP was further injected to the corpus callosum to label callosal oligodendrocytes. Axonal bundle paths were distinguishable between axons derived from motor cortex and those derived from sensory cortex (Fig. 6A). The longitudinal range of oligodendrocyte processes was about 50 µm (Fig. 6B). As a result, while oligodendrocytes in upper half of the corpus callosum predominantly ensheathed axons derived from motor cortex, oligodendrocytes in the lower half ensheathed axons derived from sensory cortex (Fig. 6, C and D).
Callosal oligodendrocytes that were able to interact with both sensory and motor axons were chosen to be analyzed. To explain the method briefly, Oligodendrocytes that were capable of interaction with 5 each labeled axons extended from each brain region and ensheathed over 3 labeled-axons were chosen to be analyzed. I defined ‘Myelination ratio’ as following, Myelination ratio = Number of labeled-axons myelinated by one oligodendrocyte / Total number of labeled axons that were reachable by the oligodendrocyte ×100. Each callosal oligodendrocyte myelination ratio toward sensory axons and motor axons were calculated and plotted to graph (See Figure legend 7A and Fig. 7A). About 1/4 (25.9%) of oligodendrocytes dominantly ensheathed axons derived from a specific brain area (distributed in Area 1 or Area 9 in Fig. 7A). To examine whether each oligodendrocyte randomly or selectively ensheaths motor axons and sensory axons, oligodendrocytes myelination ratio was analyzed by histogram (See Figure legend 7B and Fig. 7B). The histogram shows non-normal distribution, it indicates some oligodendrocytes selectively ensheath axons derived from a specific brain region. The histogram indicates that callosal oligodendrocytes were classified
20
into 3 groups: oligodendrocytes myelinating only axons derived from 1) motor cortex, 2) sensory cortex, 3) both brain regions. Distribution of analyzed oligodendrocytes in the corpus callosum is presented schematically in Fig. 8.
Analysis of myelination by each callosal oligodendrocyte in the entire corpus callosum region (including callosal oligodendrocytes localized upper or lower part of the corpus callosum) confirmed that 41.6 % of oligodendrocytes dominantly ensheath axons derived from a specific brain region (see Figure legend 7C and Fig. 7C ). Histogram analysis shows that many oligodendrocyte distributed in Area 1 or Area 9 (See Figure legend 7D and Fig. 7D). These results again showed that callosal oligodendrocytes were classified into 3 groups: oligodendrocytes myelinating only axons derived from 1) motor cortex : distributed in Area 1, 2) sensory cortex: distributed in Area 9 and 3) both brain regions: distributed in Area 2-8 in Fig. 7D. .
To analyze myelination on sensory axons and motor axons by each oligodendrocyte, I used 2-D dot histogram and compared myelination ratio of each oligodendrocyte on sensory axons and motor axons (Fig. 9). The result showed that each callosal oligodendrocyte tends to myelinate sensory axons more efficiently than motor axons.
Callosal oligodendrocytes myelinated axons derived from each hemisphere.
To examine myelination on axons derived from identical cortical area in each hemisphere, either AAV2-DsRed2 or AAV2-BFP were injected into sensory cortex (S1 hindlimb) of both hemispheres, followed by labeling of callosal oligodendrocytes by RV-GFP. Majority of oligodendrocytes ensheathed axons derived from each hemisphere (85.7%) and a few numbers of oligodendrocytes (14.3%) distributed in Area 1 and Area 9 in Fig. 10A (see Figure legend 10A and Fig. 10A). Histogram
21
analysis of oligodendrocyte myelination on axons derived from both hemispheres showed normal distribution (Fig. 10). There were no significant differences among average of myelination ratio of each oligodendrocyte on axons derived from each hemisphere (Fig. 10C). These results showed callosal oligodendrocytes equally ensheath axons derived from identical brain region of each hemisphere.
An oligodendrocyte dominantly myelinates axons derived from one of the eyeballs in the optic chiasm.
To investigate chiasmal oligodendrocyte myelination on axons derived from each eyeball, AAV2-DsRed2 or AAV2-BFP were injected into each of the eyeballs (intravitreal) of 6-week-old mice, followed by labeling of chiasmal oligodendrocytes by RV-GFP (Fig. 11). Mice were sacrificed at 8-week-old when about 80% of the optic nerves were myelinated (Baba et al., 1999). In contrast to the result of callosal myelination (Fig. 10, A, B, C), 50.0 % of chiasmal oligodendrocytes dominantly myelinated axons derived from one of the eyeballs (Fig. 12, A and B). Preferential oligodendrocyte myelination in the optic chiasm indicates that each chiasmal oligodendrocyte monitors distinction between axons derived from one eyeball and those from the other eyeball.
Analysis of activity dependent myelination by eyelid suturing.
A recent study reports neuronal activity regulates oligodendrocyte proliferation and differentiation (Gibson et al., 2014). I performed individual oligodendrocyte analysis in the optic chiasm to examine whether its myelination was modulated by inhibiting light stimulation (eyelid suturing). I investigated difference in oligodendrocyte myelination between axons derived from intact eye and those from eyelid-sutured eye.
22
One of the eyelids was trimmed and sutured at P10. The lid of the operated eye had been sutured for 1 month after operation. Temporary re-opened eyeballs and intact eyeballs were injected with AAV2-DsRed2 or AAV2-BFP (intravitreal), respectively. Opened eyelids were resutured after the AAV2s injection. Ten days after AAV2 injection, RV-GFP was injected into optic chiasm to label oligodendrocytes, and the mice were sacrificed 4 days after RV-GFP injection at 8-week-old (Fig. 13). I detected myelination by chiasmal oligodendrocyte on axons derived from both intact eye and sutured eye (Fig. 14). There were no significant differences between myelination towards axons derived from intact or sutured eye (Fig. 15, A and B). Average of myelination ratio of each oligodendrocyte on axons derived from sutured eye was comparable to that from intact eye (Fig. 15C). These results suggest that chiasmal oligodendrocyte myelination does not distinguish active or inactive axons once myelination program is turned on.
23
Discussion
In this study, I established a novel method to observe interaction between oligodendrocytes and neuronal axons. It is difficult to identify neuronal axons ensheathed by each oligodendrocyte by means of the conventional methods. The high density of oligodendrocytes in the white matter prevents us from detecting precise morphology of each oligodendrocyte. I found RV-GFP sparsely labeled both oligodendrocyte soma and its fine processes, which enables us to observe myelination by each oligodendrocyte. As for labeling neuronal axons, AAV2 can label neuronal axons more efficiently compared with chemical neuronal tracers such as PHAL and BDA (data not shown). Observation of myelination on axons derived from specific cortical regions became possible by injection of RV-GFP and AAV2s into the corpus callosum and the targeted cortical areas, respectively. This newly established method can be used not only to visualize oligodendrocyte and neurons but also to alter their genes expression. It is a versatile tool for understanding interaction between oligodendrocyte and neuronal axons.
Although this study found that RV-GFP sparsely labels oligodendrocytes in the white matter, the mechanism underlying RV infection to oligodendrocytes is unclear. RV-GFP labels HEK293 cells in vitro (Mori and Morimoto, 2014) and cultured oligodendrocytes (data not shown). The number of labeled cells increased in a concentration dependent manner. Although receptor for RV is not identified, nAChR and NCAM are thought to be involved in RV infection to neurons (Lafon, 2005), and these molecules are also expressed in oligodendrocytes (Rogers et al., 2001; Czepiel et al., 2014). It is intriguing to examine whether RV labels specific oligodendrocyte populations or not, however morphology of oligodendrocytes labeled by RV-GFP is identical to that previous characterized in the corpus callosum and the other brain
24
regions (Weruaga-Prieto et al., 1996; Chong et al., 2011). Further exploration of mechanisms underlying RV infection will be not only important for understanding usefulness of RV as a tracer but also for the pathology of rabies.
Observation of each callosal oligodendrocytes revealed that callosal oligodendrocytes can be divided into 3 groups based on myelination to axons derived from specific brain regions. I cannot exclude the possibilities that accessibility of oligodendrocyte toward axons results in preferential myelination to axons derived from a specific brain area, even though oligodendrocytes that were able to interact over 5 each labeled axons derived from different brain areas were chosen to be analyzed. Trans membrane proteins regulate oligodendrocyte myelination. For example, the polysialylated form of the neural cell adhesion molecule (PSA-NCAM) is highly expressed on the membrane of neuronal axons before myelination, but is down-regulated once myelination initiates. PSA-NCAM acts as a negative regulator of myelination in vitro, probably by inhibiting oligodendrocytes from attaching to the axonal surface. Removal of PSA-NCAM is required for initiating myelination in vitro (Charles et al., 2000). F3/Contactin1 is a GPI-anchored neural cell recognition protein that promotes oligodendrocyte differentiation by interactions with Notch1 expressed on oligodendrocytes in vitro (Hu et al., 2003). It is possible that callosal oligodendrocytes distinguish axons derived from different brain regions by screening for membrane compositions.
This study showed callosal oligodendrocytes evenly ensheath axons derive for identical brain area of both hemispheres. Previous reports demonstrated that cortico-cortico fibers of specific brain regions are asymmetrically myelinated in the human brain (Anderson et al., 1999). Asymmetric callosal myelination on axons derived from another brain region of mouse remains to be elucidated. It is intriguing to
25
investigate whether asymmetric somatosensory disorder affect myelination on axons derived from a specific brain region, for example, myelination on callosal axons derived from the barrel field is impaired by ablation of specific whisker.
Functional property, distribution of neuronal cell body and myelinated axons vary among cortical areas. Previous paper reports that corticofugal axonal diameter shows variation among cortical areas and demonstrates that caliber of callosal axons that were derived from primary sensory cortex is larger than those derived from primary motor cortex in monkey (Tomasi et al., 2012). This study indicates that each callosal oligodendrocyte tends to myelinate sensory axons more efficiently than motor axons, and it may contribute to difference between axonal calibers because oligodendrocyte locally regulates growth of axon diameter (Colello et al., 1994).
A half of chiasmal oligodendrocytes dominantly myelinated axons derived from a specific eyeball. In contrast to each chiasmal oligodendrocyte, callosal oligodendrocyte evenly myelinated axons derived from each hemisphere. Difference between callosal and chiasmal oligodendrocyte has been reported. While chiasmal origodendrocytes originate from a focal region of the ventral midline of the third ventricle in chick (Ono et al., 1997), callosal oligodendeocytes originate from subventricular zone in mice (Menn et al., 2006). Oligodendrocyte-type2-astrocyte (O-2A) progenitor cells of perinatal optic nerve were quite sensitive to X irradiation in contrast to O-2A cells of the corpus callosum, and O-2A progenitor cells in the optic nerve conduct early differentiation into oligodendrocyte, even though majority of O-2A cells in the corpus callosum has been undifferentiated after 2 weeks in vitro (van der Maazen et al., 1991). It suggests callosal oligodendrocyte tend to be undifferentiated compared with chiasmal oligodendrocyte. It is possible that chiasmal oligodendrocyte precursor cells immediately differentiate to mature oligodendrocyte to
26
increase conduction velocity, while callosal oligodendrocyte precursor cells differentiate in respond to extrinsic cause, e.g., neuronal action potential, membrane protein or humoral factors derived from neurons. The differences in myelination process between chiasmal and callosal oligodendrocytes have been reported. In the optic chiasm, the number of myelinated fibers start to increase at P10, and 70% of optic nerves are myelinated till one month after birth (Baba et al., 1999). In the corpus callosum, myelin sheathes initially appear P11, and early phase of myelination mainly occurred from P14 to P45 days (Sturrock, 1980). Although almost 100% of optic nerves are myelinated, over 50% of callosal axons are unmyelinated in adult mice, and callosal myelination continued to be conducted slowly up to 8 month. (Gyllensten and Malfors, 1963; Sturrock, 1980). These results suggest that callosal and chiasmal oligodendrocyte progenitor cells differentiate into mature oligodendrocytes with different timing and they myelinate axons in a different way.
Gyllensten and Malfors (1963) reported that P30 mice reared in a completely dark condition show decreased number of myelinated axons by 12-13%. I analyzed chiasmal myelination of 8-week-old mice whose eyelid was sutured at P10. There were no differences between myelination on axons derived from sutured eye and axons derived from intact eye. These results suggest that chiasmal oligodendrocyte myelination does not distinguish active or inactive axons once myelination program is turned on. This experiment is insufficient to confirm activity dependent myelination because it is possible that chiasmal oligodendrocytes preferentially ensheathed axons derived from intact eye and myelination of these axons were completed until 8 weeks after birth, though myelination of axons derive from sutured eyes were delayed, but caught-up to the same level of those from intact eyes until when the mice were fixed and analyzed. Another possibility is that spontaneous neuronal activity in sutured eye contributed to evoke oligodendrocyte myelination. To further investigate activity
27
dependent myelination, experiments using neuronal activity inhibitor, e.g. Kir2.1; an inward rectifying potassium channel, should be performed. Although TTX inhibits voltage-gated sodium channels (Narahashi et al., 1960), some studies reported that intraocular injection of TTX had no effect on the myelination initiation and the number of myelinated axons (Colello and Pott 1997; Colello et al. 1995; Crespo et al., 1995). Shrager and Novakovic (1995) found that myelin development was reduced, when spontaneous electrical activity was blocked by higher extracellular potassium concentration in mouse spinal cord explant culture, however not only neurons but oligodendrocyte may be also influenced by the elevation of K+. Inward rectifying K+ channels (Kir2.1) enable entry of K+ into the cell (Hibino et al., 2010). Transfection of Kir2.1 gene into neurons reduces neuronal activity (Johns et al., 1999). To confirm activity dependent myelination, I am going to miss-express Kir2.1 in neurons and examine whether oligodendrocytes selectively myelinate intact axons compared with axons expressing Kir2.1.
I characterized myelination by each oligodendrocyte in the white matter. The results presented here indicate hallmark of each oligodendrocyte myelination in the corpus callosum and optic chiasm. Timing of neuronal inputs is important to evoke action potentials of postsynaptic neurons, strengthen neuronal connections, induction of long term-potentiation (LTP) and long-term depression (LTD) (Dan and Poo, 2004). It is conceivable that myelinations of specific axons contribute to adjust timing of neuronal inputs. McKenzie and colleagues (2014) confirmed active myelination is essential to learn motor skill. I hypothesize that myelinations of specific axons are important for learning, because synchronized input from presynaptic neuron is required to LTP and LTD (Dan and Poo, 2004). This study confirmed many callosal oligodendrocyte ensheath axons derived from motor and sensory cortex. It is intriguing to study whether each oligodendrocyte ensheaths functionally rerated axons of each brain area.
28
The axon-selective myelination of oligodendrocyte could have a potential role in broad physiological implication. Although I developed a method to observe single oligodendrocyte myelination on fluorescent labeled neuronal axons and addressed their interaction, further studies are required to investigate axon-selective myelination by each oligodendrocyte.
29
References
Anderson, B., Southern, B. D., Powers, R. E. (1999). Anatomic asymmetries of the posterior superior temporal lobes: a postmortem study. Neuropsychiatry, Neuropsychology and behavioral neurology. 12, 247-254.
Baba, H., Akita, H., Ishibashi, T., Inoue, Y., Nakahira, K., Ikenaka, K. (1999). Completion of myelin compaction, but not the attachment of oligodendroglial processes triggers K(+) channel clustering. Journal of Neuroscience Research, 15, 752-764.
Bunge, M. B., Bunge, R. P., Pappas, C. D., (1962). Electron microscopic demonstration of the connections between glia and myelin sheath in the developing mammalian central nervous system. Journal of cell biology, 12, 448-459.
Chamberlin, N. L., Du, B., de Lacalle, S., Saper, C. B. (1998). Recombinant adeno-associated virus vector: use for transgene expression and anterograde tract tracing in the CNS. Brain Research, 793, 169-175.
Charles, P., Hernandez, M. P., Stankoff, B., Aigrot, M. S., Colin, C., Rougon, G., Zalc, B., Lubetzki, C. (2000). Negative regulation of central nervous system myelination by polysialylated-neural cell adhesion molecule. Proceedings of the National Academy of Sciences of the United States of America, 97, 7585-7590.
Chong, S. Y. C., Rosenberg, S. S., Fancy, S, P, J., Zhao, C., Shen, Yun-An A., Hahn, A. T., McGee, A. W., Xu, X., Zheng, B., Zhang, L. L., Rowitch, D. H., Franklin, R. J.
30
M., Lu, Q. R., Chan, J. R. (2011). Neurite outgrowth inhibitor Nogo-A establishes spatial segregation and extent of oligodendrocyte myelination. Proceedings of the National Academy of Sciences of the United States of America, 109, 1299-1304.
Colello, R. J., Devey, L. R., Imperato, E., Pott, U. (1995). The chronology of oligodendrocyte differentiation in the rat optic nerve: evidence for a signaling step initiating myelination in the CNS. Journal of Neuroscience, 15, 7665-7672.
Colello, R. J. and Pott, U. (1997). Signals that initiate myelination in the developing mammalian nervous system. Molecular Neurobiology, 15, 83-100.
Colello, R. J., Pott, U., Schwab, M. E. (1994). The role of oligodendrocytes and myelin on axon maturation in the developing rat retinofugal pathway. Journal of Neuroscience, 14, 2594-25605.
Crespo, D., Verduga, R., Villegas, J., Fernández-Viadero, C. (1995). Dimorphic myelin in the rat optic nerve as a result of retinal activity blockage by tetrodotoxin during early postnatal period. Histology and histopathology, 10, 289-299.
Czepiel, M., Leicher, L., Becker, K., Boddeke, E., Copray, S. (2014). Overexpression of polysialylated neural cell adhesion molecule improves the migration capacity of induced pluripotent stem cell-derived oligodendrocyte precursors. Stem Cells Translational Medicine, 3, 1100-1109.
Czopka, T., Ffrench-Constant, C., Lyons, D. A. (2013). Individual oligodendrocytes have only a few hours in which to generate new myelin sheaths in vivo. Developmental cell, 25, 599-609.
31
Dan, Y. and Poo, Mu-ming. (2004). Spike timing-dependent plasticity of neural circuits. Neuron, 44, 23-30.
De Biase, L. M. and Bergles, D. E. (2011). Same players, different game: AMPA receptor regulation in oligodendrocyte progenitors, Nature neuroscience, 14, 1358 – 1360.
De Biase, L. M., Nishiyama, A., Bergles, D. E. (2010). Excitability and synaptic communication within the oligodendrocyte lineage. Journal of Neuroscience, 30, 3600-3611.
Demerens, C., Stankoff, B., Logak, M., Anglade, P., Allinquant, B., Couraud, F., Zalc, B., Lubetzki, C. (1996). Induction of myelination in the central nervous system by electrical activity. Proceedings of the National Academy of Sciences of the United States of America, 93, 9887-9892.
Emery, B. (2010). Regulation of oligodendrocyte differentiation and myelination. Science, 330, 779-782.
Fields, R. D. (2011). Imaging learning: the search for a memory trace. Neuroscientist, 17, 185-196.
Frühbeis, C., Fröhlich, D., Kuo, W. P., Amphornrat, J., Thilemann, S., Saab, A. S., Kirchhoff, F., Möbius, W., Goebbels, S., Nave, K. A., Schneider, A., Simons, M., Klugmann, M., Trotter, J., Krämer-Albers, E. M. (2013). Neurotransmitter – Triggered Transfer of exosomes mediate mediates Oligodendrocyte-Neuron communication.
32
PLoS Biology, 11(7), e1001604.
Gibson, E. M., Purger, D., Mount, C. W., Goldstein, A. K., Lin, G. L., Wood, L. S., Inema, I., Miller, S. E., Bieri, G., Zuchero, J. B., Barres, B. A., Woo, P. J., Vogel, H., Monje, M. (2014). Neuronal activity promotes oligodendrogenesis and adaptive myelination in the mammalian brain. Science, 344, 1252304
Gilbert, P., Kettenmann, H., Schachner, M. (1984). gamma-Aminobutyric acid directly depolarizes cultured oligodendrocytes. Journal of Neuroscience, 4, 561 – 569.
Gordon, J. A. and Stryker, M. P. (1996). Experience-dependent plasticity of binocular responses in the primary visual cortex of the mouse. Journal of Neuroscience, 16, 3274-3286.
Gyllensten, L. and Malmfors, T. (1963). Myelination of the Optic Nerve and its Dependence on Visual Function – A Quantitative Investigation in Mice. Journal of embryology and experimental morphology, 11, 255-266.
Hibino, H., Inanobe, A., Furutani, K., Murakami, S., Findlay, I., Kurachi, Y. (2010). Inwardly rectifying potassium channels: their structure, function, and physiological roles. Physiological reviews, 90, 291-366.
Hu, Q.D., Ang, B.T., Karsak, M., Hu, W.P., Cui, X.Y., Duka, T., Takeda, Y., Chia, W., Sankar, N., Ng, Y.K., Ling, E.A., Maciag, T., Small, D., Trifonova. R., Kopan, R., Okano, H., Nakafuku, M., Chiba, S., Hirai, H., Aster, J.C., Schachner, M., Pallen, C.J., Watanabe, K., Xiao, Z.C. (2003). F3/contactin acts as a functional ligand for Notch during oligodendrocyte maturation. Cell, 115, 163-175.
33
Ishibashi, T., Dakin, K. A., Stevens, B., Lee, P. R., Kozlov, S. V., Stewart, C. L., Fields, R. D. (2006). Astrocytes promote myelination in response to electrical impulses. Neuron, 49, 823-832.
Ito, T., Okada, T., Mimuro, J., Miyashita, H., Uchibori, R., Urabe, M., Mizukami, H., Kume, A., Takahashi, M., Ikeda, U., Sakata, Y., Shimada, K., Ozawa, K. (2007). Adenoassociated virus-mediated prostacyclin synthase expression prevents pulmonary arterial hypertension in rats. Hypertension, 50, 531-536.
Itoh, T., Beesley, J., Itoh, A., Cohen, A. S., Kavanaugh, B., Coulter, D. A., Grinspan, J. B., Pleasure, D. (2002). AMPA glutamate receptor – mediated calcium signaling is transiently enhanced during development of oligodendrocytes. Journal of Neurochemistry, 81, 390 - 402.
Johns, D. C., Marx, R., Mains, R.E., O'Rourke, B., Marbán, E. (1999). Inducible genetic suppression of neuronal excitability. Journal of Neuroscience, 19, 1691-1697.
Kagawa, T., Ikenaka, K., Inoue, Y., Kuriyama, S., Tsujii, T., Nakao, J., Nakajima, K., Aruga, J., Okano, H., Mikoshiba, K. (1994). Glial cell degeneration and hypomyelination caused by overexpression of myelin proteolipid protein gene. Neuron, 13, 427-442
Káradóttir, R., Cavelier., P., Bergerse., L. H., Attwell, D. (2005). NMDA receptors are expressed in oligodendrocytes and activated in ischaemia. Nature, 438, 1162 – 1166.
Kimori, Y., Baba, N., Morone, N. (2010). Extended morphological processing: a
34
practical method for automatic spot detection of biological markers from microscopic images. BMC Bioinformatics, 11, 373.
Lafon M. (2005). Rabies virus receptors. Journal of NeuroViorogy, 11, 82-87.
Lee, Y., Morrison, B. M., Li, Y., Lengacher, S., Farah, M. H., Hoffman, P. N., Liu, Y., Tsingalia, A., Jin, L., Zhang, Ping-Wu., Pellerin, L., Magistretti, P. J., Rothstein, J. D. (2012). Oligodendroglia metabolically support axons and contribute to neurodegeneration. Nature, 487, 443-448.
Lin, S. C. and Bergles, D. E. (2004). Synaptic signaling between GABAergic interneurons and oligodendrocyte precursor cells in the hippocampus. Nature neuroscience, 7, 24 – 32.
Lundgaard, L., Luzhynskaya, A., Stockley, J. H., Wang, Z., Evans, K. A., Swire, M., Volbracht, K., Gautier, H. O., Franklin, R. J., Ffrench-Constant, Charles., Attwell, D., Káradóttir, R. T. (2013). Neuregulin and BDNF induce a switch to NMDA receptor-dependent myelination by oligodendrocytes. PLoS biology, 11, e1001743.
Martinez-Lozada, Z., Waggener, C. T., Kim, K., Zou, S., Knapp, P. E., Hayashi, Y., Ortega, A., Fuss, B. (2014). Activation of sodium-dependent glutamate transporters regulates the morphological aspects of oligodendrocyte maturation via signaling through calcium/calmodulin-dependent kinase IIβ's actin-binding/-stabilizing domain. Glia, 62, 1543-1558.
Ma, J., Matsumoto, M., Tanaka, K. F., Takebayashi H., Ikenaka, K. (2006). An animal model for late onset chronic demyelination disease caused by failed terminal
35
differentiation of oligodendrocytes. Neuron Glia Biology, 2, 81-91.
Matsushita, T., Elliger, S., Elliger, C., Podsakoff, G., Villarreal, L., Kurtzman, G. J., Iwaki, Y., Colosi, P. (1998). Adeno-associate virus vectors can be efficiently produced without helper virus. Gene therapy, 5, 938-945.
McKenzie, I. A., Ohayon, D., Li, H., de Faria, J. P., Emery, B., Tohyama, K., Richardson, W. D. (2014). Motor skill learning requires active central myelination. Science, 17, 318-322.
Menn, B., Garcia-Verdugo, J. M., Yaschine, C., Gonzalez-Perez, O., Rowitch, D., Alvarez-Buylla, A. (2006). Origin of oligodendrocytes in the subventricular zone of the adult brain. Journal of Neuroscience, 26, 7907-7918.
Mori, T. and Morimoto, K. (2014). Rabies virus glycoprotein variants display different patterns in rabies monosynaptic tracing. frontiers in NEUROANATOMY, 7, 47.
Narahashi, T., Deguchi, T., Urakawa, N., Ohkubo, Y. (1960). Stabilization and rectification of muscle fiber membrane by tetrodotoxin. American Journal of Physiology, 198, 934-938.
Nave, K. A. (2010). Myelination and support of axonal integrity by glia. Nature, 468, 244-252.
Okada, T., Nomoto, T., Yoshioka, T., Nonaka-Sarukawa, M., Ito, T., Ogura, T., Iwata-Okada, M., Uchibori, R., Shimazaki, K., Mizukami, H., Kume, A., Ozawa, K. (2005). Large-scale production of recombinant viruses by use of a large culture vessel
36
with active gassing. Human Gene Therapy, 16, 1212-1218.
Ono, K., Yasui, Y., Rutishauser, U., Miller, R. H. (1997). Focal ventricular origin and migration of oligodendrocyte precursors into the chick optic nerve. Neuron, 19, 283-292.
Rogers, S. W., Gregori, N. Z., Carlson, N., Gahring L. C., Noble, M. (2001). Neuronal nicotinic acetylcholine receptor expression by O2A/oligodendrocyte progenitor cells. Glia, 33, 306-313.
Shrager, P. and Novakovic, S. D. (1995). Control of myelination, axonal growth, and synapse formation in spinal cord explants by ion channels and electrical activity. Brain research. Developmental brain research, 88, 68-78.
Sturrock, R. R. (1980). Myelination of the mouse corpus callosum. Neuropathology and Applied Neurobiology, 6, 415-420.
Scholz, J., Klein, M. C., Behrens T. E., Johansen-Berg, H. (2009). Training induces changes in white-matter architecture. Nature neuroscience, 12, 1370-1371.
Tauber, H., Waehneldt, T. V., Neuhoff, V. (1980). Myelination in rabbit optic nerves is accelerated by artificial eye opening. Neuroscience letters, 16, 235-238.
Tomasi, S., Caminiti, R., Innocenti, G. M. (2012). Areal differences in diameter and length of corticofugal projections. Cerebral cortex, 22, 1463-1472.
van der Maazen, R. W., Kleiboer, B.J., Verhagen, I., van der Kogel, A.J. (1991).
37
Irradiation in vitro discriminates between different O-2A progenitor cell subpopulations in the perinatal central nervous system of rats. Radiation research, 128, 64-72.
Von Blankenfeld, G., Trotter, J., Kettenmann, H. (1991). Expression and Developmental Regulation of a GABAA Receptor in Cultured Murine Cells of the Oligodendrocyte Lineage. European Journal of Neuroscience, 4, 310 – 316.
Weruaga-Prieto, E., Eggli, P., and Celio, M. R. (1995). Topographic variations in rat brain oligodendrocyte morphology elucidated by injection of Lucifer Yellow in fixed tissue slice. Journal of Neurocytology, 25, 19-31
Yamazaki, Y., Hozumi, Y., Kaneko, K.., Sugihara, T., Fujii, S., Goto, K., Kato, H. (2007). Modulatory effects of oligodendrocytes on the conduction velocity of action potentials among axons in the alveus of the rat hippocampal CA1 region. Neuron Glia Biology, 3, 325-334.
Table 1. Characterization of GFP-positive oligodendrocytes (n = 45) in the corpus callosum and
myelinated axons labeled by AAVs. Mean number of GFP-positive callosal oligodendrocyte processes, labeled-axons adjacent to each callosal oligodendrocyte, the number of myelinated labeled-axons and percentage of myelinated labeled-axons at 10-week-old mice.
Age (weeks) Mean no. of oligodendrocyte processes
Mean no. of labeled-axons adjacent to oligodendrocyte
Mean no. of myelinated labeled-axons
Percentages of myelinated labeled-axons (%)
10 21.0 (±0.6) 28.6 (±0.8) 3.2 (±0.1) 13.2 (±1.3)
38
39
Figure legends
Fig. 1. RV-GFP sparsely labeled oligodendrocytes in the corpus callosum.
(A) GFP-positive oligodendrocyte-like cells were sparsely labeled by RV-GFP in the corpus callosum. (B) Confocal micrograph of the GFP expressing cell in the corpus callosum. The cell exhibits typical oligodendrocyte morphology. (C) Double labeling of PLP mRNA (blue color, in situ hybridization) and immunostaining with anti-GFP antibody (brown color). (D) High magnification view of the cell doubly labeled with PLP and GFP. (E) The number of callosal cells expressing GFP and PLP mRNA (or GFAP mRNA) was counted. Total number of PLP+/GFP+ and PLP-/GFP+ cells in the corpus callosum of 3 mice brains. (F) Total number of GFAP+/GFP+ and GFAP-/GFP+ cells in the corpus callosum of 3 mice brains.
Fig. 2. RV-GFP labeled oligodendrocytes in the optic chiasm.
(A) Oligodendrocyte-like cells were sparsely labeled by RV-GFP in the optic chiasm as well. (B) Double labeling of PLP mRNA (blue color, in situ hybridization) and immunostaining with anti-GFP antibody (brown color). (C) High magnification view of the cell doubly labeled with PLP mRNA and GFP. The number of cells doubly positive for GFP and PLP mRNA in the whole optic chiasm and neighboring optic nerve was counted. (D) Total number of GFP+/PLP+ and GFP+/PLP- cells in the optic chiasm and neighboring optic nerve of 3 mice.
40
Fig. 3. Schematic drawing and time course of viral injection to analyze callosal myelination.
(A) Schematic drawing of AAV2 and RV-GFP injection. Magnified view describes an oligodendrocyte adjacent to axons derived from each hemisphere. (B) Time course of viral injection.
Fig. 4. Confocal micrograph of oligodendrocytes and axons labeled by RV-GFP and AAV2s, respectively.
Interaction between oligodendrocytes and axons was observed by the use of confocal microscopy. Z series confocal images were compressed to the pictures. (A) Oligodendrocytes in the corpus callosum were labeled by RV-GFP. (B-C) Axons derived from each hemisphere were labeled by AAV2-DsRed2 or AAV2-BFP. (D) Micrograph of (A), (B) and (C) were merged.
Fig. 5. Three-dimensional reconstruction of confocal microscope images.
Oligodendrocyte myelination was further analyzed in detail by Z series confocal images. (A) Confocal image of myelinated axons in the corpus callosum (Axons labeled by AAV2-DsRed2 (Red), axons labeled by AAV2-BFP (Blue) and oligodendrocyte labeled by RV-GFP (Green)). The lower and right insets indicate the X-Z and Y-Z cross section images, respectively. The white dashed line and the white square in the orthogonal view were attached. (B) Magnified views of the area surrounded by dashed line in Fig. 5A. The micrographs shows myelinated axon
41
labeled by AAV2-BFP (Blue) and myelinating oligodendrocyte process (Green). (C) Magnified views of squared area in Fig. 5A. The myelinated axon-labeled by AAV2-BFP (Blue) and myelinating oligodendrocyte process (Green). (D) Z series confocal images (identical to Fig. 5A) were modified by rotational morphological processing (Kimori et al., 2010) to extract the regions containing oligodendrocyte and labeled axons. These extracted regions were reconstructed as volume-rendered images. Over all view of 3D structure was shown. (E) Magnified internal structure of the myelinated axon (indicated by red dashed line in Fig. 5D). The data was processed to visualize bared axon by removal of myelin sheath.
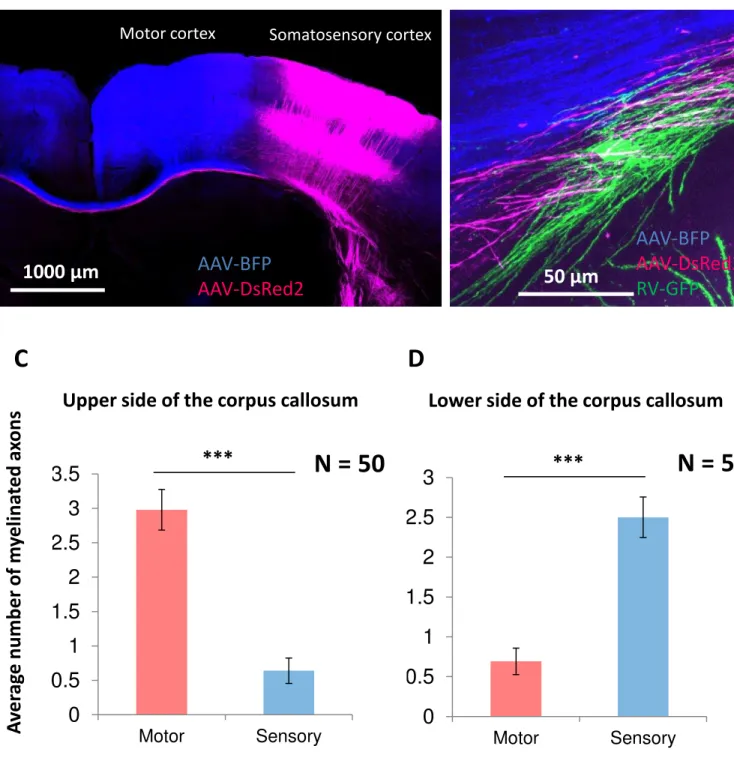
Fig. 6. Oligodendrocytes in the upper half and lower half of the corpus callosum ensheathed axons derived from motor cortex and sensory cortex, respectively.
(A) Confocal image of a mouse brain that was injected with AAV2s into motor or sensory cortex, showing that axons derived from different cortical areas go through distinct paths in the corpus callosum (B) Confocal image of the oligodendrocytes and the nearby axons indicates that location of oligodendrocyte limits its interacting capacity with axons derived from specific brain areas. (C) Average number of myelinated labeled-axons derived from motor or sensory cortex in the upper half of the corpus callosum (n = 50). (D) Average number of myelinated labeled-axons derived from motor or sensory cortex in the lower half of the corpus callosum (n = 52). Data were presented with SEM ( *** p < 0.001, Student’s t test)
Fig. 7. Analysis of each callosal oligodendrocytes myelination on axons derived from specific brain areas.
42
(A) To normalize the abundance of axons derived from each brain area, oligodendrocytes that were able to interact with over 5 each axons extended from each brain area and it ensheathed over 3 labeled-axons were chosen to be analyzed for its myelination. Myelination ratio was defined as following, Myelination ratio = Number of labeled-axons myelinated by one oligodendrocyte / Total number of labeled axons that were reachable by the oligodendrocyte ×100. Myelination ratio of each oligodendrocyte for sensory axons and motor axons was plotted as blue dots (n = 58). Graph area was divided into 9 areas for histogram analysis of oligodendrocytes distribution. Oligodendrocytes in Area 1 or 9 mean oligodendrocytes dominantly (> about 5-folds compared with axons derived from another brain region) or only ensheathed motor axons or sensory axons, respectively. Oligodendrocytes in Area 2-4 or 8-6 mean whose myelination biased toward motor axons or sensory axons, respectively. Oligodendrocytes in Area 5 mean these oligodendrocytes evenly ensheathed sensory axons and motor axons. (B) Histogram for the number of oligodendrocytes in each 9 area in Fig.7A. A total of 25.9% oligodendrocytes were distributed in Area 1 and Area 9. The histogram showed that distributions of oligodendrocytes were atypically. (C) To analyze each callosal myelination by oligodendrocytes in the entire corpus callosum region, oligodendrocytes ensheathed over 3 labeled-axons and would be able to interact over 5 labeled axons (either or both of AAV2s) were chosen to be analyzed. Myelination ratio on sensory axons and motor axons of each oligodendrocyte was calculated and plotted (n = 89). Same as mentioned above, graph area was divided into 9 areas to histogram analysis. (D) Histogram for the number of oligodendendrocytes in each 9 area in Fig. 7C. A total of 41.6% oligodendrocytes were distributed in area 1 and 9, indicates that these oligodendrocytes dominantly or only myelinated axons derived from a specific brain regions. Trimodal shape of the histogram indicates that callosal oligodendrocytes were
43
classified into 3 groups.
Fig. 8. Distribution of callosal oligodendrocytes analyzed for myelination on axons derived from specific brain areas.
Schematic drawing for distribution of callosal oligodendrocytes analyzed for myelination on axons derived from specific brain areas, that are identical to oligodendrocytes in Fig. 7, A and B. Oligodendrocytes dominantly ensheathed axons derived from motor or sensory cortex (area 1 or 9 in Fig.7, A and B) were indicated by red or blue color, respectively. Oligodendrocytes evenly myelinated axon derive from each brain area (area 2 – 8 in Fig. 7, A and B) were indicated by green color.
Fig. 9. Two-dimentional dot histogram analysis of myelination of motor axons and sensory axons by each oligodendrocyte.
Oligodendrocytes were chosen as mentioned figure legend 7A.. Each circle indicates myelination ratio of each oligodendrocyte on motor axons and sensory axons. Average myelination ratio of motor axons and sensory axons represented by red dots. * p < 0.05 Student’s t test; n = 58. Error bar indicates SEM.
Fig. 10. Callosal oligodendrocyte myelination on axons derived from each hemisphere.
To confirm callosal oligodendrocyte myelination on axons derived from identical brain
44
area of left or right hemispheres, AAV2-BFP or AAV2-DsRed2 were injected into somatosensory cortex (S1 hind limb) of left or right hemispheres. (A) Myelination ratio of each oligodendrocyte for axons derived from both hemispheres was plotted as blue dots (n = 28). Oligodendrocytes that were able to interact with over 5 each axons extended from each hemisphere and it ensheathed over 3 labeled-axons were chosen to be analyzed. Graph area was divided into 9 areas for histogram analysis of oligodendrocyte distribution in myelinated axons derived from identical brain area of left or right hemispheres. Oligodendrocytes in Area 1 or 9 mean oligodendrocytes dominantly (> about 5-folds compared with axons derived from another hemisphere) or only ensheathed motor axons or sensory axons, respectively. Oligodendrocytes in Area 2-4 or 8-6 mean whose myelination biased toward axons derived from right or left hemisphere, respectively. Oligodendrocytes in Area 5 mean these oligodendrocytes evenly ensheathed axons derived from both hemisphere. (B) Histogram for the number of oligodendrocytes in each 9 area as shown in Fig. 10A. The histogram showed uniform distribution of oligodendrocytes. (C) Average of myelination ratio of each oligodendrocyte on labeled-axons derived from left or right hemispheres. n. s. is the abbreviation of no sense (p = 0.57, Student’s t test; n= 28. Error bar indicates SEM).
Fig. 11. Schematic drawing and time course of viral injection to analyze chiasmal myelination.
To analyze chiasmal myelination, AAV2-BFP or AAV2-DsRed2 was injected into left or right eyeballs. RV-GFP was then injected into the optic chiasm 10 days after AAV2s injection. The mice were sacrificed 4 days after RV-GFP injection.