We provide empirical evidence that cross-country market share in exchange rate pass-through cases is consistent with the findings of Feenstra et al. 1996) that show a non-linear relationship between market share and exchange rate transmission. The result remains robust if the country's market share is also included in the regression. Bernhofen and Xu (2000) provide evidence that an increase in the exporting country's market share lowers ERPT for US petrochemical imports.
Second, we investigate how far we can push back the effect of market share on ERPT. Existing studies focus on a country's market share relative to the destination market or against the share of another exporting country. Third, we investigate whether the relationship between market share and ERPT may be nonlinear.
On the other hand, different theoretical models infer an opposite impact of market share on exchange rate pass-through; for examples, see Feenstra et al. 1996) investigate a Bertrand differentiated product model in which different exporters (including domestic suppliers) compete in a market. Therefore, the effective cost to consumers of finding different types of businesses increases in proportion to the market share of the current partner. Regarding the relationship between market share and exchange rate pass-through, we must understand that forecasts are quite sensitive to market characteristics.
For the homogeneous product market, exchange rate pass-through decreases as the market share of foreign exporters increases.
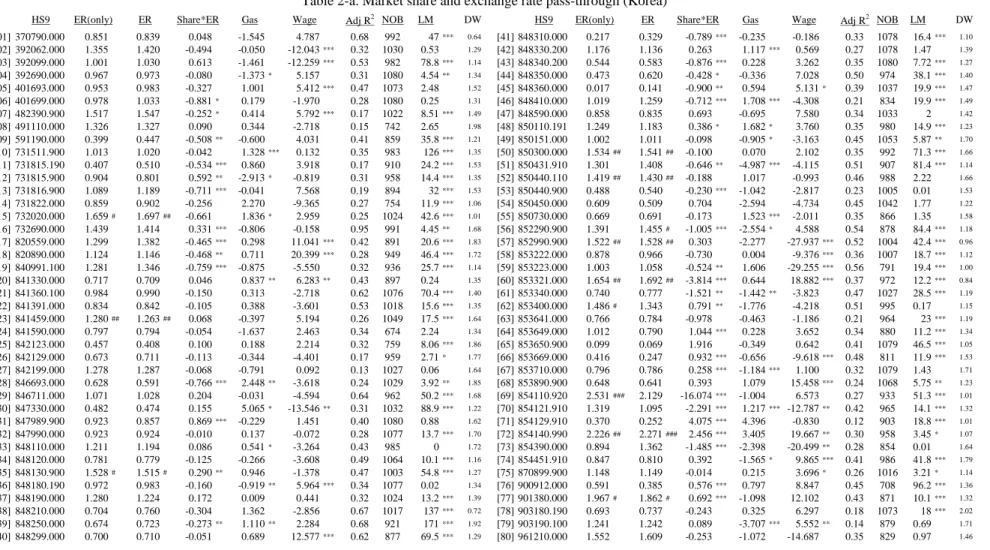
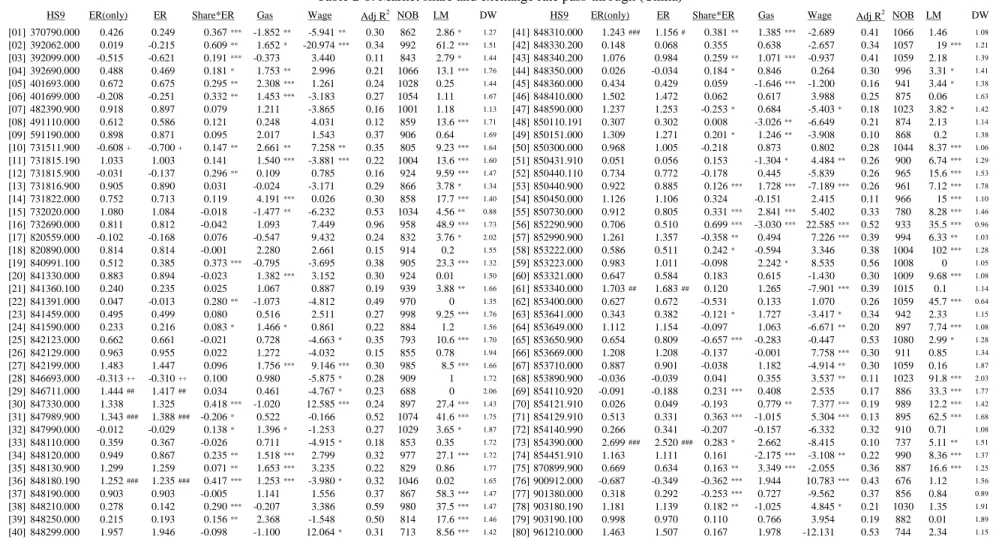
3-3. Estimation models with market share
EXShareEX
SShare
Estimation results
With a specification of a non-linear effect, we need to introduce the definition of positive (or negative) for the sake of comparison with previous results. If these values are positive, we define it as positive market share effect on ERPT. In our calculation of ERPT, we only use the estimated coefficients significant at the five percent level.
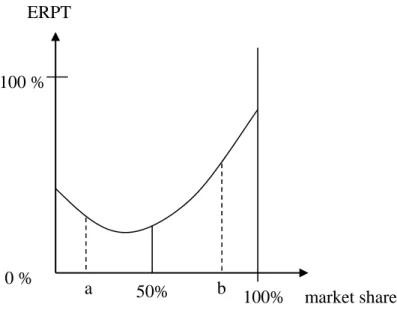
For example, the descending form of ERPT with respect to market share can be captured in a linear specification with market share ranging from, say, a low of 0.1 to a high of 0.3. When calculating the effect of market share; the extrapolation of ERPT at a market share of one (above the highest of 0.3) could be larger than the extrapolation of ERPT at zero market share (below the lowest of 0.1) in a non-linear specification. The theoretical prediction is ambiguous about the convexity of exchange rate transmission with market share, while Feenstra et al. 1996) found a convex shape of the transmission of the exchange rate with respect to the size of the market share for the automotive sector.
Regarding ERPT convexity, 26.3 percent of the estimates are statistically significant at the one percent level and concave, while 16.0 percent of the estimates are statistically significant and convex.
Robustness check
5-1. Port share versus country share
SJPNShare
5-2. Market share and marginal costs
MCShare
Quantifying the economic significance of market share on ERPT
Otani et al. 2003) examined ERPT for Japanese import prices, while Bouakez and Rebei (2008) examined ERPT for Canadian import prices. Campa and Goldberg (2005) estimate ERPT for import prices in OECD countries. 2009) address the problem from the perspective of the exporting countries.
6-1. Convergence of market shares among competing local regions
In this section we examine the direction in which changes in market shares have driven ERPT over the past twenty years. When selecting commodities, we impose the criterion that the trade values for a large part of the sample are non-zero. This selection methodology potentially excludes those goods for which observed behavior shows that trade disappears for some ports in the latter part of the sample, as well as goods with no trade for some ports in the early periods of the sample.
However, we believe that this selection problem is less severe for the largest traded commodities that we use in our sample. So far, we have obtained evidence that the effect of market share on ERPT can be non-linear and go in both directions. However, even with estimates for falling ERPT with respect to an increase in market share, i.e. negative 1, we still cannot say anything about whether ERPT has fallen.
If, for example, the shares of the five ports are decreasing in recent years, and the form of ERPT with market shares is a decreasing function, we should observe an increase in ERPT. To account for recent changes in ERPT, we need to combine both the estimated coefficients and the dynamics of market shares. We should note that the proportions of the five major ports, t, do not sum to unity in most cases.
In calculating the average ERPT, only the statistically significant coefficients of 1 and 2 are used. We interpreted this as evidence that the ERPT elasticity is time invariant (at 0) throughout the sample period if neither 1 nor 2 is statistically significant at the ten percent level. By simply comparing the ERPT at the beginning time and the ERPT at the end, goods can be classified as increasing or decreasing ERPT.
6-3. Policy implications
Conclusions
Using the sample from January 1988 to December 2005 for exports from five Japanese major ports to six destination countries, we examine the effect of market share (relative to competitors from the same country) on exchange rate pass-through. Our dataset is unique because we can control for market shares among competing exporters of the same nationality. Close examination of the largest 80 nine-digit HS exports reveals the trend of local port export market shares to converge.
We also provide some empirical evidence that the effect of market shares is consistent with Feenstra et al. 1996) and other studies showing non-linearity between market share and exchange rate flow. However, our evidence also suggests that the relationship between market share and exchange rate or marginal cost depends sensitively on market characteristics. With respect to recent studies of declining ERPT in the US, our evidence shows that ERPTs for Japanese exports have been relatively stable over the past two decades, and any observed changes are small in magnitude.
In this sense, our evidence suggests that Japanese exports do not account for the recent decrease in ERPT imports from the US. However, there are significant changes in ERPT for a large number of products in China, Hong Kong and Taiwan. We suspect that the recent increase in foreign direct investment in these Asian countries may explain these changes in ERPT, but further research in this direction is warranted.
Exchange rate transmission in industry-level export prices: A tale of two political regimes in India. Exchange rate and tariff pass-through in India's import prices: Currency devaluation versus import liberalization. Declining exchange rate pass-through: Evidence from Japanese import prices, Monetary and Economic Studies.
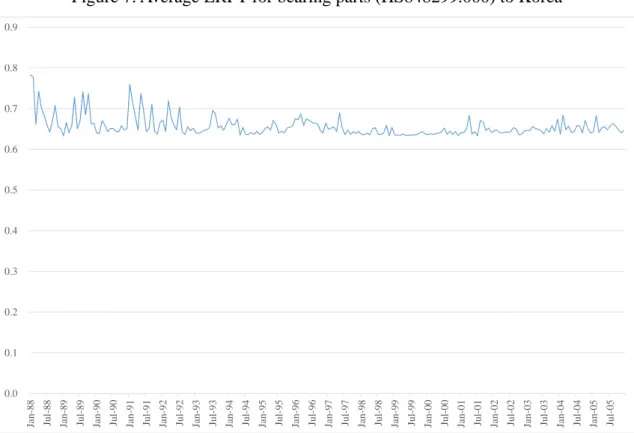
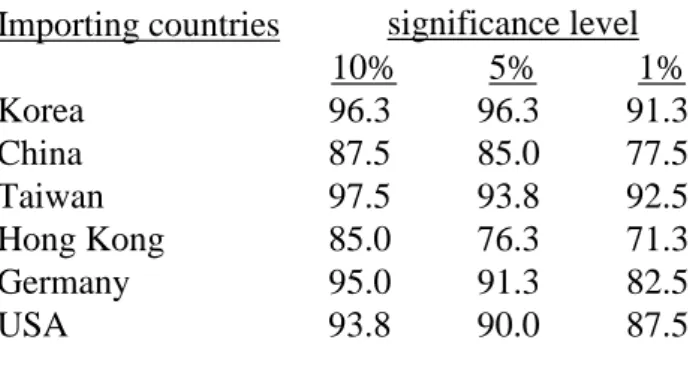
Exchange rate movements and tradable commodity prices in East Asia: An analysis based on Japanese customs data, 1988-1999. Note: The empirical definition of ERPT in this study refers to full conduction (100%) for an ERPT coefficient equal to one and zero conduction (0%) for an ERPT coefficient equal to zero. Note: Figures are the percentage of goods with a change in ERPT shown in relation to an increase in market share at the corresponding level of statistical significance.
Note: The numbers are the percentage of commodities with indicated change in ERPT relative to an increase in market share. Note: Monthly standard deviations of Japanese port market share are first calculated for each importing country, and annual averages of monthly standard deviations for each year are then calculated.