曲木
拓朗
システム情報科学部
複雑系知能学科 学籍番号 1014188
指導教員 (主)マイケル ヴァランス
提出日 2018 年 1 月 29 日
Anxiety in a Virtual Environment for Learning
By
Takurou Magaki
BA Thesis at Future University Hakodate, 2018
Advisor: Prof. Michael Vallance
Department of Complex and Intelligent Systems
Future University Hakodate
environment where a person can experience VR; known as a Virtual Environment (VE). The research implemented the currently known methods of reducing VR Sickness, and subsequently considered more effective methods. To measure VR Sickness a validated Simulator Sickness Questionnaire (SSQ) undertaken by subjects after doing experimental tasks in a developed VE was utilized. In addition, subjects wore a customized biological sensor called Bitalino, in order to evaluate the subject by measuring a biological response, within 3 minutes, of three kinds of natural states and two kinds of VR experience states. In addition, this quantitative data as objective evaluations according to the biological responses was analyzed and considered alongside subjective qualitative evaluations according to the SSQ. The analysis of the experiments subsequently proposes VR Sickness reduction methods.
Keywords : Virtual Reality, Biological Response, VR Sickness, Anxiety, Reducing Method
概要
近年,Virtual Reality(VR)における技術が著しい発展を遂げている.しかしながら,VR 体験中,
あるいは体験後に体調不良を訴えるユーザがいる.一般的にこれはVR 酔いといわれ,未だ絶対
的な解決方法は示されていない.そのため,現在のVR において,VR 酔いの対策,あるいは効
果的な軽減方法の確立が大きな課題となっている.本研究では,VR を体験することができる環
境であるVirtual Environment (VE) において,現在挙げられている VR 酔いの軽減手法を実装し,
軽度のVR 酔いとなる不安 (Anxiety) の計測と比較評価を行い,より効果的な軽減手法の検討を
行うことを目的とした.実験参加者に対して自らが開発した VE 内における実験タスク後に
Simulator Sickness Questionnaire といわれるシミュレータ酔いのアンケートを用いて VR 酔いの程
度を計測した.また,実験参加者に対してBitalino という生体センサの ECG センサを装着し,3
分間の自然状態とVR 体験状態 2 回の合計 3 回の状態において,生体反応の計測を行った.アン
ケートによる主観評価と,生体反応による客観評価を踏まえたうえで,VR 酔いの軽減手法に対
する分析と考察を行った.
1.2 目的 Purpose ... 1
第2 章 関連研究 Related research ... 3
2.1 VR 酔い VR Sickness ... 3
2.1.1 ベクション Vection ... 3
2.2 VR 酔いの計測 Measuring of VR Sickness ... 4
2.3 VR 酔いの軽減手法 Reducing methods of VR Sickness ... 4
2.3.1 Controlling Field of View ... 4
2.3.2 Virtual Nose ... 5 2.3.3 その他の方法 Other Methods ... 6 第3 章 課題 Problem ... 7 第4 章 システム System ... 8 4.1 システムの概要 Abstract of system ... 8 4.2 システムの実装 Implementation of system ... 8 4.2.1 Virtual Environment ... 8 4.2.1.1 プログラミング Programing ... 15 4.2.2 軽減手法 Reducing methods ... 17 4.2.3 Bitalino ... 18 4.2.4 実験タスク Task of experiment ... 20 第5 章 実験 Experiment ... 22 5.1 実験材料 Experimental components... 22 5.2 実験1 の方法 Method of experiment 1 ... 26 5.3 実験1 結果 Result of experiment 1 ... 27 5.4 実験2 の方法 Method of experiment 2 ... 30 5.5 実験2 結果 Result of experiment 2 ... 31
図目次 ... 49 表目次 ... 50
Background
近年,Virtual Reality (VR)の技術が著しい発展を遂げている.VR 技術は人工的に現実感を発生 させる技術であり,見かけは現実ではないが本質的には現実であるものと言われている [1].そ して,VR 技術はゲームやアートといった娯楽産業での活用が主であるが,医療や教育などの分 野での活用も期待されている.しかしながら,VR 技術は現実では不可能なことを可能にするこ とができる技術であるが,現時点では数点の問題を抱えている.現在の VR コンテンツの多く は,ヘッドマウントディスプレイ(HMD)を用いた立体視を行うことで表現を行っている.その際 に起こる問題点として,VR 酔いが挙げられる.In recent years, the technology of Virtual Reality (VR) has made remarkable progress. VR technology is artificially generated reality, and it is said the reality exists in essence or effect though not in actual fact or form [1]. VR is able to realize ‘virtually’ things that can be impossible in reality. VR is currently being promoted in entertainment industries such as games and art, but it is also expected to gain greater traction in fields such as engineering, medicine, military, design and education. Consumer VR content is expressed by performing stereoscopic viewing using a head mounted display (HMD). However, currently VR has several problems; symptoms like dizziness or discomfort. It is called VR Sickness or CyberSickness.
1.2 目的
Purpose
本研究において,Virtual Environment (VE)という用語を Virtual Reality (VR)の経験を可能にする 環境として定義するために用いる.この定義は,VE は Virtual な空間である環境に関連するも のであるのに対し,VR は技術を強調するものである.そして,異なる軽減手法を適用した VE において,混乱や心理的動揺,不安状態の際に生じる反応である心拍数の上昇や発汗といった生 VR 体 験 後 の 実 験 参 加 者 に 対 し て Simulator Sickness
VR Sickness
VR 酔いで発生する症状として,乗り物酔いやシミュレータ酔いに似た症状が生じる.しかし, 同じような「酔い」ではあるが厳密には異なるものであると言われている [2].乗り物酔いは乗 り物に乗った際に生じる酔いであり,吐き気やめまいに付随する不快感である.また,シミュレ ータ酔いはシミュレータ上で仮想の乗り物に乗った際に生じる酔いであり,倦怠感や姿勢の不 安定がみられ,乗り物酔いよりは軽度で発生頻度が低い傾向がみられる.一方で VR 酔いは, Virtual Environment(VE)上で動いたときに生じ,吐き気や眼精疲労,めまいといった症状がみら れ,シミュレータ酔いの3 倍重い症状であることが示されている [2].The VR Sickness symptom is also similarly known as motion sickness and simulator sickness. It is said that these have symptoms that are similar but also strictly different. VR Sickness occurs when a user moves in a virtual environment(VE). VR Sickness such as nausea, asthenopia, and dizziness are experienced, and it has been shown that it is three times as severe as simulator sickness [2].
2.1.1
ベクション
Vection
VR 酔いの根本的なメカニズムは完全には解明されていない.そのような現状ではあるが,視 覚誘導性自己移動感覚(視覚ベクション)に起因した感覚不一致説が有力な原因として挙げられ ている.ベクションとは,止まっている車に乗っている際,隣の車が動き始めると自分が動いて いるような感覚を得るものであり,視覚と体性感覚,前庭感覚における感覚の不一致が酔いを引 き起こすという説である [1, 3].ほかにも,毒を摂取するような幻覚を経験した際に,有害物質 を排出するために生存本能が働くという説や姿勢が不安定である期間が長いと重い症状がみら れる姿勢不安定説が挙げられているが,これらは症状が限定的であり,あまり有力ではないとさ れている [2]. 妹尾らは,ベクションの指標として,潜時,持続時間,マグニチュード(主観的強度)の 3 つが あり,これらにはそれぞれ相関があると示した [3].潜時が短いと持続時間が長くなる傾向があ2.2 VR 酔いの計測
Measuring of VR Sickness
VR 酔い自体を計測する研究も行われている.SSQ は,1993 年に Kennedy らによって開発さ れた,Simulator Sickness や VR 酔いの研究で広く用いられている計測ツールである [5].16 の症 状 を 4 段 階 で 評 価 し , 気 持 ち 悪 さ (Nausea) , 眼 精 疲 労 (Oculomotor) , め ま い や ふ ら つ き (Disorientation)と総合点(Total)の各スコアを算出する.異なる Simulator Sickness や VR 酔いの研
究において,SSQ データを計算し比較することができる.ほかにも,吐き気の程度を分析する
Nausea Profile [6] ,VR 酔いおいて頻繁に報告される症状 47 種から 2 割以上報告された 13 種を ピックアップしたVirtual Reality Symptom Questionnaire [7]などがある.SSQ などのアンケート方 式の主観評価に加えて,生体反応を計測することで,客観的なデータを得ることを目的とした研 究も行われている.例えば中川は,心電図(ECG),呼吸,血圧,胃電図,皮膚電気活動(EDA), 脈波を計測し,軽度から中度の動揺病の発症推定手法の開発を目的とした研究を行った.この研 究では,心電図や呼吸を計測することが動揺病の発症の判断指標として有力であることを示し た [8].また,左脇腹の裏側周辺の発汗にも影響していると示しており,Miller の研究からも胃 の活動が動揺病に関わっていると示されている [9].
There are questionnaire methods such as Simulator Sickness Questionnaire (SSQ), Nausea Profile and Virtual Reality Symptom Questionnaire as tools to measure VR sickness [5, 6, 7]. On the other hand, research aiming at obtained objective data for VR Sickness is undertaken by measuring biological responses. It shows that it is effective as a judgement indicator by biological responses such as Electrodermal Activity (EDA) and Electrocardiogram (ECG) [8, 9].
2.3 VR 酔いの軽減手法
Reducing methods of VR Sickness
2.3.1
Controlling Field of View
experiment consisted of subjects moving around in a VE while a controlled field of view was automatically applied. The measurement method was analyzed by SSQ, Average Discomfort Score which calculate the weighted average with time, and Relative Discomfort Score which considered the time spent by subjects in the VE.
Fig. 2-1 Combating VR sickness through subtle dynamic field-of-view modification [10]
2.3.2
Virtual Nose
Whittinghill らは,VE 上に鼻を挿入する実験を行った(Fig. 2-2).41 人の実験参加者は HMD を
装着し,2 種類の VR アプリケーションを操作した.VR 空間内を歩き回るアプリケーションで は,平均94.2 秒,ローラーコースターのアプリケーションでは,平均 2.2 秒長く体験を続けるこ とができ,Virtual Nose は VR 酔いを軽減するということを示した [11].実験参加者はアプリケ ーション操作時に Virtual Nose の存在に気付かず,実験後の報告により存在に気付いたという. また,EDA センサを使用して,興奮による発汗の影響を計測し,鼻ありとなしの実験参加者間 での差異を示した.
Fig. 2-2 Virtual Nose
2.3.3
その他の方法
Other Methods
その他の方法として,VE においてユーザから安定した位置にオブジェクトを配置することで ユーザはユーザ周辺の予測可能になり,VR 酔いが軽度になるということが言われている [12]. 例として車の運転席や,宇宙船の操縦席といったものが挙げられている.As another method, it is said that a user can predict the surrounding things by deploying an object in a stable position for users in VE. For example, driver's seat of a car or the cockpit of a spacecraft. Thereafter, users felt a mild VR Sickness [12].
らオブジェクトを作成して軽減手法を再現する必要がある. 2 つ目は,VR 空間内で実験を行うために必要な VE の開発である.前述した 2 つの軽減手法 で用いられたVE は,それぞれ異なる独自の VE であり,比較を行うためには同一の VE におい て実験を行う必要がある.そのため,実験参加者に対して不安状態を誘発することができるVE を開発しなければならない.また,VE の情報量によって軽減手法の効果に違いが出るか判断す るために,情報量の異なる2 種類の VE の開発を行う. 3 つ目は,生体データにより不安を計測するための生体センサの準備である.取得する生体デ ータとしては,関連研究 [8, 9]でも用いられている EDA と ECG の取得を目標とする. 4 つ目は,実験時に実験参加者が行うタスクの考案である.実験参加者によって行動が異なっ てしまうと比較を行うことが難しくなるため,実験参加者が VE 内で統一して行うことができ る,適切な実験タスクを考える必要がある.
There are four problems to measure Anxiety due to experiences in a VE.
The first is selection and reproduction of the reducing methods of VR Sickness to be implemented. At this time, an experiment controlling the Field of View and a Virtual Nose is considered. In addition, it is necessary to reproduce the reduction methods because these object solutions for implementing these reduction methods has not yet been published; hence the uniqueness of this research.
The second is the development of VE to experiment for VR. There needs to be a development of a single VE for an experiment because two reduction methods are different VEs. Therefore, a VE must be developed that is able to induce anxiety state to subjects. In addition, it is required to develop two types of VE because in order to judge whether the effect of reduction methods’ difference depends on the information volume of the VE.
The third is preparation of a biosensor for measuring anxiety by biological data. And to target obtaining the biological data about EDA and ECG which are also used in related research [8, 9].
The fourth is to devise a task to be enforced by subjects during the experiment because it is difficult to compare when there is a behavior difference depending on subjects. Therefore, it is necessary to think about appropriate experimental tasks which each subject can almost unify in the VE.
Abstract of system
本研究では,軽減手法どうしを比較するための実験を行うために必要なシステムとして,VR アプリケーションと生体センサの開発を行った. VR アプリケーションでは,情報量が比較的少ない VE と情報量が比較的多い VE の 2 種類の VE 条件と,前述した 2 種類の軽減手法条件に軽減手法を適用しない条件を加えた,3 種類の軽 減手法条件を扱うことができる. 生体センサには, Bitalino という生体センサキットを用いた.医療用の生体センサは高価であ り,入手が困難であるのに対して,比較的安価で信頼性が高く,入手が容易であり,EDA と ECG のセンサも扱うことができるため,Bitalino を選定した.この Bitalino のキットを用いて,VR ア プリケーション体験中の実験参加者に装着することができる生体センサの回路を作成した.In this research the aim is to design and develop a VR application and biosensor as a system necessary for experiments for comparing reduction methods of VR Sickness. In VR application, two types of VE conditions with different information volume, and three types of reduction method condition which are controlling Field of View, Virtual Nose and actually not applying reduction method are utilized.
For the biosensor, a biosensor kit called Bitalino was selected. Biological sensors for medical use are expensive and difficult to obtain. On the other hand, Bitalino is relatively inexpensive, highly reliable, easy to obtain and can use sensors of EDA and ECG. Using a Bitalino kit, a biosensor circuit can be created and customized that can be worn by subjects who are experiencing VR applications.
4.2 システムの実装
Implementation of system
4.2.1
Virtual Environment
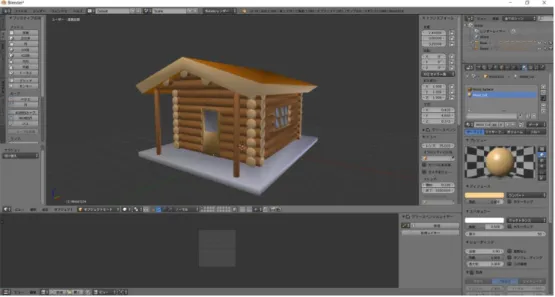
VE の開発では,3D ゲームエンジンの Unity 2017.1.2f1 を用いて開発を行い(Fig. 4-1),動作に 必要なスクリプトはVisual Studio 2017 を用いて C#で記述した(Fig. 4-2)(4.2.1.1).また,3D モデ ルの製作には3D モデリングソフトウェアである Blender 2.7 を使用した(Fig. 4-3).
Fig. 4-1 Unity view
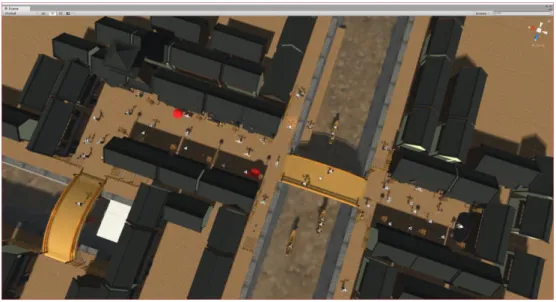
Fig. 4-3 Blender view 異なる情報量のVE を示すため,2 種類の VE の開発を行った.一つは自然に囲まれた山の中を モチーフとしたVE(VE1)(Fig. 4-4)を開発し,もう一つは日本の江戸時代の街並みをモチーフとし たVE(VE2)(Fig. 4-6)を開発した.VE1 は全てのオブジェクトが動かず,主に岩,木,家の 3 種類 となっている.対してVE2 は,主に家や屋台に,動かないノンプレイヤーキャラクター (NPC) とランダムに動き回るNPC を多数追加した. Fig. 4-4 VE1
Fig. 4-5 VE1 view
Fig. 4-7 VE2 view
また,実験参加者へのタスクに用いるVE 内のアイテムとして,「Bag」(Fig. 4-8),「Drink」(Fig. 4-9),「Map」(Fig. 4-10),「Tablet」(Fig. 4-11),「Lamp」(Fig. 4-12)の 5 種類の 3D モデルに加え, 実験参加者の移動を補助する矢印の 3D モデル(Fig. 4-13)を作成した.
Fig. 4-9 Drink
Fig. 4-10 Map
Fig. 4-12 Lamp
Fig. 4-13 Arrow
プレイヤーの操作は,コントローラによるジョイスティック入力を想定した.向いている方向 に対してジョイスティックを倒した方向に移動することができるように実装を行った.
In the development of VE, the Unity 3D game engine application (see Fig. 4-1) and scripts for the operation produced in C# using Visual Studio 2017 (see Fig. 4-2) were utilized (see 4.2.1.1). In addition, the research used Blender (see Fig. 4-3), that is a 3D modeling software for making 3D models which are necessary objects in the experiments (see Fig. 4-8, Fig. 4-9, Fig. 4-10, Fig. 4-11, Fig. 4-12, Fig. 4-13).
Developing the two VEs, one is a VE with a motif in the mountain surrounded by nature (see Fig. 4-4 and Fig. 4-5), the other is VE with the motif of the Japanese Edo period street (see Fig. 4-6 and Fig. 4-7). Five 3D models as items used for experiment tasks were created. In the VE1, the all the objects do not move. The objectsThese are mainly three types of rock, tree, and house. On the other hand, in the VE2, there is aare mainly house and stalls, pluswhich is added a lot of non-moving non-player characters (NPC) and randomly moving NPC. The operation of the player assumed the joystick input by the controller. It was implemented so that the joystick could be moved for tilt in the direction facing at the front.
ObjectAccessor.cs PlayerController.cs Timer.cs ArrowLookAt.cs は,アイテムの位置をプレイヤーに把握させるため,赤い矢印を対象となるオ ブジェクトの方向を指すようにするスクリプトである. BindScaleChanger.cs は,プレイヤーの移動時に,Fig. 4-14 のオブジェクト1を拡大または縮小す るためのスクリプトである. GameController.cs は,Timer.cs に対してのタイマーの開始と停止,アイテムの表示と管理,タ スク終了までの一連の操作を行うためのスクリプトである. ItemPickUp.cs は,オブジェクトに付与した ObjectAccessor.cs の参照を基に,アイテムの回収を 行うためのスクリプトである. ObjectAccessor.cs は,各オブジェクトに対しての参照を明示したスクリプトである. PlayerController.cs は,プレイヤーの操作に関わるスクリプトである. Timer.cs は,実験タスクにおける制限時間を扱うためのタイマーのスクリプトである. 本研究において作成したスクリプトの例として,PlayerController.cs を Table 4-1 に表記する. また,その他のスクリプトは添付のDVD にて参照することができる.
In this research, the following seven scripts were created. ArrowLookAt.cs BindScaleChanger.cs GameController.cs ItemPickUp.cs ObjectAccessor.cs PlayerController.cs Timer.cs
ArrowLookAt.cs is where a player is instructed to grasp the position of the item by pointing the red arrow to the direction of the targeted object.
BindScaleChanger.cs is changing of the object scale in Fig. 17 when the player moves.
GameController.cs is operating start and stop the timer from Timer.cs, displaying and managing items, and finishing the task.
[RequireComponent(typeof(CharacterController))] public class PlayerController : MonoBehaviour { [SerializeField] GameObject _camera; CharacterController cc; void Start() { cc = GetComponent<CharacterController>(); } void Update() {
float vert = Input.GetAxis("Vertical"); float hori = Input.GetAxis("Horizontal");
Vector3 temp = (_camera.transform.forward * vert) + (_camera.transform.right * hori);
temp += Physics.gravity;
cc.Move(temp * speed * Time.deltaTime);
}
}
}
Fig. 4-14 Controlling Field of View
二つ目は,Whittinghill らの実験で用いられた Virtual Nose の 3D モデルである(Fig. 4-15).この
り,基板にセンサ類が全て一体化している「Board Kit」,それぞれセンサが分離しており,はん
だ付けが必要となるがオリジナルのウェアラブルデバイスを開発することができる「Freestyle
Kit」,Board Kit と同じだがセンサとメイン基板の間にプラグがあり,Arduino などの基盤などと 接続可能な「Plugged Kit」という 3 種類がある.また,それぞれに Bluetooth4.0 対応の「BLE」, Bluetooth2.0 対応の「BL」が存在する.今回はこれらの中から,Freestyle Kit の BLE のキットを
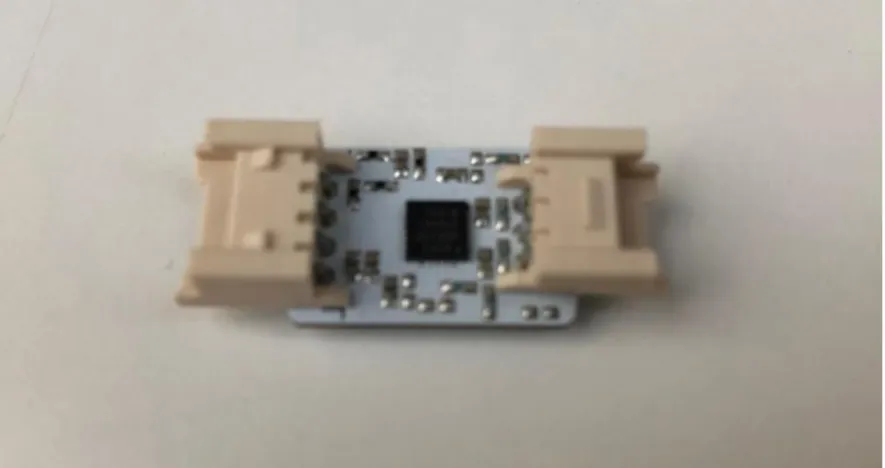
利用する.センサ類が分離しているため,はんだ付けを行い,回路を作成した(Fig. 4-17).しか
し,回路を作成後にBLE のバージョンでは,2 種類のセンサを同時に扱うことはできないとい
うことが判明した.
Fig. 4-17 My Bitalino Circuit Bitalino で取得した生体データは,Bluetooth 経由でコンピュータと接続し,コンピュータ上で OpenSignals というソフトウェアを使用することで,時間当たりの生体データの記録と再生を行 うことができる(Fig. 4-18).全てのセンサにおいて横軸は時間として扱い,センサごとに縦軸が 表す値は異なる.例えば,EDA は電気伝導率(μS)であり,ECG は電位 (mV) である. Fig. 4-18 OpenSignals
4.2.4
実験タスク
Task of experiment
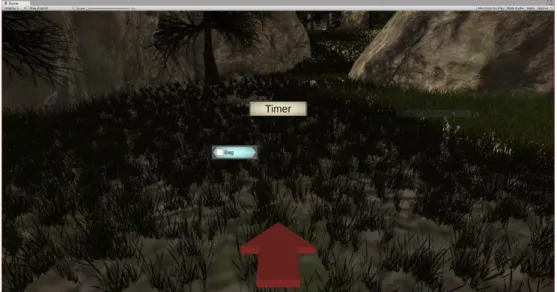
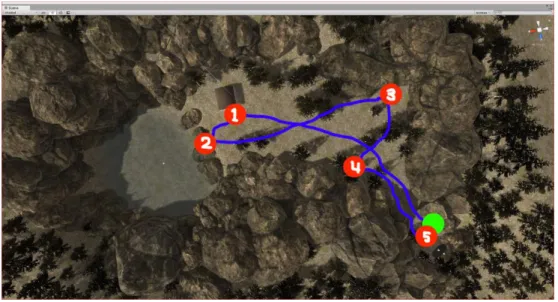
VE 内で行うタスクを設定した.これは課題でも挙げたように,実験参加者間での実験内での 行動を統一させるためである.タスクとしては,3 分間の制限時間を設け,5 つのアイテムを順 番に回収させることとした.Fig. 4-19 は実験参加者の視界である.画面中央の白色の UI の「Timer」 と表示されているところに制限時間が表示される.また,画面左側の青色のUI には,次回収す るアイテムが表示される.そして赤い矢印は,実験参加者が向いている方向の50cm ほど前方に 表示され,次に回収するべきアイテムの位置を指す.Fig. 4-19 Subject’s view
VE1 では,「Bag」,「Drink」,「Lamp」,「Map」,「Tablet」の順番でアイテムを表示する. Fig. 4-20 は VE1 のルートである.
Fig. 4-20 VE1 route
VE2 では,「Bag」,「Lamp」,「Map」,「Drink」,「Tablet」の順番でアイテムを表示する.Fig. 4-21
はVE2 のルートである.
Experimental components
実験では2 種類の VE 条件と 3 種類の軽減手法条件を用いる.Table 5-1 は VE 条件と軽減手法
条件の組み合わせの対応表である.VE 条件である VE1 を 1,VE2 を 2 とした.また,軽減手法
条件をMethod とし,軽減手法なしを A,Field of View の操作を B,Virtual Nose を C とした.
Table 5-1 Table of Experiments
Method A B C VE 1 1A 1B 1C 2 2A 2B 2C 実験タスクは3 分間の時間制限を設けているが,3 分以内にアイテムをすべて回収した場合は VE 内で自由に移動を行わせる. また,それぞれの条件の視野は次のようになっている.Fig. 5-1 は条件 1A における実験参加 者の視野である. Fig. 5-1 1A view
Fig. 5-2 1B view
Fig. 5-3 は条件 1C における実験参加者の視野である.
Fig. 5-4 2A view
Fig. 5-5 は条件 2B における実験参加者の視野である.
Fig. 5-5 2B view
Fig. 5-6 2C view
また,酔いの程度を計るアンケートとして,SSQ を用いる.SSQ は 16 項目からなるアンケー トで,各項目に対し,「なし」,「軽度」,「中度」,「深刻」の4 段階の回答がある.Table 5-2 は SSQ の原文の項目と,今回用いる日本語訳を行った項目の対応表である.
Table 5-2 SSQ Item Correspondence (E/J)
Item English 日本語 Q1 General discomfort 不快感 Q2 Fatigue 疲労感 Q3 Headache 頭痛 Q4 Eye strain 眼精疲労 Q5 Difficulty focusing 目の焦点が合わせにくい Q6 Salivation increasing 唾液の分泌 Q7 Sweating 発汗 Q8 Nausea 吐き気 Q9 Difficulty concentrating 集中ができない
Q10 Fullness of the Head 頭がぼうっとする
Q11 Blurred vision 視界がぼやける
Q12 Dizziness with eyes open 目を開いている状態のめまい
serious.
For the experimental environment, the laptop OS is Windows 10 Home, the CPU uses the Intel® Core ™ i7-7700 HQ processor, and the graphics uses the of NVIDIA® GeForce® GTX 1070. Also, HMD is Oculus Rift Development Kit 2, and controller is Xbox One Wireless Controller.
5.2 実験 1 の方法
Method of experiment 1
実験1 では,生体センサと SSQ を用いた実験を行う.手順としては,実験参加者に実験の承 諾を得た後, 1. 電極を Fig. 5-7 の O と P の位置の 2 か所に装着する. 2. 安静状態にある実験参加者に対して 3 分間の ECG の計測を行う. 3. 計測終了後,HMD を装着させ,3 分間の実験タスクを行わせる.その間に ECG の計測を 行う. 4. 実験タスク終了後,SSQ に回答させ,十分な休憩を取らせる. 5. その後条件を変更し,もう一度 2.と 3.の操作を行う. 6. 全ての操作を終えた後,1 回目と 2 回目実験タスクにおいて目や体の疲れ,操作感に違い があるか質問を行う.Fig. 5-7 Position of Electrode
In Experiment 1, using a biosensor and SSQ.
As for the procedure, after gaining consent for experiment to subjects, 1. Place the electrode in two places.
2. Measure the ECG of 3 minutes of subjects who are in a natural state.
3. After completion of measurement, wear HMD and do the experimental task for 3 minutes. Measure ECG during that time.
4. After completing the experiment task, subjects answer SSQ, and take a sufficient break. 5. Then change the conditions, and repeat steps 2 and 3.
6. After finishing all the operations, ask questions as to whether there is a difference in tired eyes or body, and operation feeling in the first and second experiment tasks.
5.3 実験 1 結果
Result of experiment 1
大学倫理委員会への申請と承認のもと,全ての実験参加者は実験データの匿名性に関する合 意に署名した. 実験参加者は18-20 歳の健康な大学生 15 人(男 14,女 1)であり,14 人が VR 体験をしたこと がなく,1 人は VR 体験を 1,2 回程度経験したことがあった.Fig. 5-8 は実験している状態であFig. 5-8 Experiment 1
実施したVE 条件と軽減手法条件に対する実験参加者数は Table 5-3 に示す.Subjects は実験参 加者数であり,T1,T2 は条件を適用して計測を行った回である.
Table 5-3 Number of subjects in the experiment 1
Subjects (n) T1 T2 6 1A 2A 3 1B 1C 3 2B 2C 3 2C 1B 実験1 を行った結果,ECG データは通常 0mv を基準として記録されるが,15 人に対しそれぞ れ3 回計測を行った ECG データは全て Fig. 5-9 のような異常な値で記録されていた.
Fig. 5-9 Abnormal data
また,Table 5-4 は実験 1 における SSQ の結果である.S の列は実験参加者,1 から 16 の列の
数値は回答であり,0 が「なし」,1 が「軽度」,2 が「中度」,3 が「深刻」を示す.
Table 5-4 Result of SSQ in the experiment 1
S Q1 Q2 Q3 Q4 Q5 Q6 Q7 Q8 Q9 Q10 Q11 Q12 Q13 Q14 Q15 Q16 1 1 0 0 0 0 0 0 0 0 0 0 0 0 0 0 0 1 1 1 0 0 0 0 0 0 0 1 0 0 0 0 0 0 2 0 0 0 0 0 0 0 0 0 0 0 0 0 0 0 0 2 0 0 0 0 0 0 0 0 0 0 0 0 0 0 0 0 3 1 1 0 1 0 1 0 0 0 0 0 2 0 1 0 0 3 1 1 0 1 0 1 0 0 0 0 0 2 0 2 0 1 4 0 0 0 1 1 0 0 0 0 0 1 0 0 0 0 0 4 0 0 0 2 2 0 0 0 0 0 1 0 0 0 0 0 5 0 1 0 1 1 1 0 0 1 2 1 0 0 0 0 0 5 0 1 0 1 1 1 2 1 1 1 0 1 1 0 0 1 6 0 0 0 0 0 0 0 0 0 0 0 0 0 0 0 0 6 0 0 0 0 0 0 0 0 0 0 0 0 0 0 0 0 7 1 0 0 0 0 0 0 0 0 0 0 0 0 0 0 0
14 0 0 0 0 0 1 0 0 0 0 0 0 0 0 1 1 15 0 0 0 0 0 0 1 0 0 0 0 0 0 0 0 0 15 0 0 0 0 0 0 1 0 0 0 0 0 0 0 0 0 実験後の目や体の疲れ,操作感に違いはあるかという質問に対する回答として,VE 条件では, 違いは見られなかった. VE1 のほうが疲れなかった. VE2 は情報量が多かった. VE1 のほうが疲れた. といった回答を得た.また,軽減手法条件では, 違いは見られなかった. Method B は見づらかった. といった回答を得た.
The university ethics application was approved and so all participants signed an agreement about the anonymity of their experimental data.
Subjects were 15 healthy students aged 18 to 20 years (male 14, female 1), 14 had never experienced VR and 1 had very limited experience (once or twice).
As a result of experiment 1, all ECG data was not normally recorded.
As an answer to questions about feeling tired in the experiment, in conditions of VE, No difference was seen.
VE 1 got tired.
VE 2 has a large amount of information. VE 1 got tired.
Also, conditions of Method No difference was seen. Method B was hard to see.
5.4 実験 2 の方法
Method of experiment 2
実験2 では,実験 1 で生体センサが異常な値を記録したため,生体センサを用いず,SSQ の
1. Wear HMD and do the experimental task for 3 minutes.
2. After completing the experiment task, answer SSQ, and take a sufficient break. 3. Then change the conditions, and repeat steps 1 and 2.
4. After finishing all the operations, ask questions as to whether there is a difference in tired eyes or body, and operation feeling in the first and second experiment tasks.
5.5 実験 2 結果
Result of experiment 2
大学倫理委員会への申請と承認のもと,全ての実験参加者は実験データの匿名性に関する合 意に署名した. 実験参加者は18-20 歳の健康な大学生 21 人(男 20,女 1)であり,9 人が VR 体験をしたこと がなく,11 人は VR 体験を 1,2 回程度経験したことがあった. 実施したVE 条件と軽減手法条件に対する実験参加者数は Table 5-5 に示す.Subjects は実験参 加者数であり,T1,T2 は条件を適用して計測を行った回である.Table 5-5 Number of subjects in the experiment 2
Subjects (n) T1 T2 5 1A 1C 5 2A 2B 2 1B 2B 2 2C 1C 1 1C 2B 5 2C 1B
19 1 0 0 1 0 1 0 0 0 0 0 0 0 0 0 0 19 0 0 0 0 0 0 0 0 0 0 0 0 0 0 0 0 20 0 0 0 0 0 0 0 0 0 0 0 0 0 0 0 0 20 0 1 0 0 0 1 0 0 0 0 2 0 0 0 0 0 21 0 0 0 0 0 0 0 0 0 0 0 0 0 0 0 0 21 0 0 0 0 0 0 0 1 0 0 0 0 0 0 1 0 22 1 1 0 0 0 0 0 0 0 1 0 0 0 1 0 0 22 0 0 0 0 0 0 0 0 0 1 0 0 0 0 0 0 23 1 0 0 0 1 0 0 0 0 1 1 1 0 0 0 0 23 1 0 0 0 1 0 0 0 0 1 1 1 0 0 0 0 24 0 0 0 0 0 0 0 0 0 0 0 0 0 0 0 0 24 0 0 0 0 0 0 0 0 0 0 0 0 0 0 0 0 25 0 0 0 0 0 0 0 0 0 0 0 0 0 0 0 0 25 0 0 0 0 0 0 0 0 0 0 0 0 0 0 0 0 26 0 0 0 0 0 1 0 0 0 0 0 0 0 0 0 0 26 1 0 0 0 0 0 0 0 0 0 0 0 0 0 0 0 27 0 0 0 0 0 0 0 0 0 0 0 0 0 0 0 0 27 0 0 0 0 0 0 0 0 0 0 0 0 0 0 0 0 28 0 0 0 0 0 0 0 0 0 0 0 0 0 1 0 0 28 0 0 0 0 0 0 0 0 0 0 0 0 0 1 0 0 29 0 0 0 0 0 0 0 0 0 0 0 0 0 0 0 0 29 0 0 0 0 0 0 0 0 0 0 0 0 0 0 0 0 30 0 0 0 0 0 0 0 0 0 0 0 0 0 1 0 0 30 0 0 0 0 0 0 0 0 0 0 0 0 0 0 0 0 31 0 0 0 0 1 0 0 1 0 1 0 0 0 0 0 0 31 1 1 1 0 0 0 0 0 1 1 0 0 0 0 0 0 32 0 0 0 0 0 0 0 0 0 0 0 0 0 0 0 0 32 0 0 0 0 0 0 0 0 0 0 0 0 0 0 0 0 33 1 0 0 0 0 0 0 1 0 1 0 1 0 1 0 0 33 1 1 0 0 0 0 0 1 0 1 0 1 0 1 1 0 34 0 0 0 1 1 0 0 0 0 0 0 1 0 0 0 0 34 0 0 0 1 1 0 0 0 0 0 0 1 0 0 0 0 35 3 2 2 2 1 1 0 2 2 1 1 2 0 2 0 0 35 1 1 0 2 0 0 0 0 1 1 0 1 0 1 0 0
VE2 は情報量が多く疲れた. VE2 は目の疲れがあった. といった回答を得た.また,軽減手法条件では, 違いは見られなかった (Method A と比べて)Method C のほうが気持ち悪くなった. (Method C と比べて)Method A のほうが気持ち悪くなった. (Method A と比べて)Method C のほうが違和感はなかった. Method B は見づらかった. Method B は見づらく,体を大きく動かす必要があるため疲れた. といった回答を得た.
The university ethics application was approved and so all participants signed an agreement about the anonymity of their experimental data.
Subjects were 21 healthy students aged 18 to 20 years (male 20, female 1), 9 had never experienced VR and 11 had very limited experience (once or twice).
As answers to questions about feeling tired in the experiment, in conditions of VE, No difference was seen.
VE 1 was bad feeling. VE 2 was bad feeling.
VE 2 got tired of the amount of information. VE 2 was tired from the eyes.
Also, conditions of Method, No difference was seen
Method C was bad feeling (compared to Method A). Method A was bad feeling (compared to Method C).
Method C had no sense of incongruity (compared to Method A). Method B was hard to see.
を行う.
The data obtained in the experiment was evaluated. However, ECG biological data was recorded as abnormal waveforms in natural state, experiment task 1, and experiment task 2, and it was subsequently not possible to compare between subjects. Therefore, only SSQ was evaluated.
6.1 Simulation Sickness Questionnaire
SSQ の計算方法として,回答項目である「なし」,「軽度」,「中度」,「深刻」の4 段階を,0 か
ら3 としてスコアを与える.また,質問項目である 16 項目を Nausea,Oculomotor,Disorientation
の3 つのクラスに分類し,各項目に加重度を与え,定数を掛けることにより,各クラスに対する
スコアを算出する.Nausea Score(NS)は加重和に 9.54 掛け,Oculomotor Score(OS)は加重和に 7.58 を掛け,Disorientation Score(DS)は 13.92 を掛ける.そして,3 つのクラスの加重和を足し合わせ, 3.74 を掛けたものが Total Score(TS)となり,VR 酔いの重症度を求めることができる.Table 6-1
はSSQ の 16 項目に対する各クラスの加重度の分布である.これら 4 つの重みづけされた値は,
異なるSimulator Sickness や VR 酔いの研究において,SSQ データを計算し比較するための定数 である.
Table 6-1 Weights for symptoms
Weights for Symptoms
Symptoms Nausea Oculomotor Disorientation
General discomfort 1 1 0 Fatigue 0 1 0 Headache 0 1 0 Eye strain 0 1 0 Difficulty focusing 0 1 1 Salivation increasing 1 0 0 Sweating 1 0 0 Nausea 1 0 1 Difficulty concentrating 1 1 0
The calculation method of SSQ is important and is detailed in [5]. To summarize, give four scores of None, Mild, Moderate, Severe as answer items with scores of 0 to 3. In addition, divide the 16 items, which are question items, into three classes of Nausea, Oculomotor, Disorientation, give weights to each item, multiply them by constants, and calculate scores for each class. Nausea Score (NS) multiplies the weighted sum by 9.54 times, the Oculomotor Score (OS) multiplies the weighted sum by 7.58 and the Disorientation Score (DS) multiplies by 13.92. Then, the weighted sum of the three classes is added up and multiplied by 3.74 which becomes Total Score (TS), and the severity of VR sickness can be obtained. These four weighted values are constants for calculating and comparing the SSQ data in different Simulator Sickness and VR sickness research.
6.2 Nausea Score
SSQ の NS における VE 条件と軽減手法条件の分散分析を行った. 1A(n=12)におけるスコアの平均は 12.72(SD=18.41),1B(n=12)は 9.54(SD=10.30),1C(n=12)は 8.75(SD=15.80) , 2A(n=12) は 10.34(SD=16.27) , 2B(n=12) は 4.79(SD=7.29) , 2C(n=12) は 10.34(SD=21.14)であった.Table 6-2 と Fig. 6-1 は NS における平均と分散を示す.各条件につい て2 要因被験者間の分散分析を行った結果,有意な差は見られなかった.また,Table 6-3 は分散 分析の結果を示す.Table 6-2 Mean and S.D.(NS)
VE Method n Mean S.D. (Standard
Deviation)
1 A 12 12.72 18.41
1 B 12 9.54 10.30
1 C 12 8.75 15.80
Fig. 6-1 Mean of NS(n=72)
Table 6-3 Analysis of variance(NS)
S.V (source of variance) SS (sum of squares) df (degree of freedom) MS (mean square) F VE(2) 61.94 1 61.94 .23 ns Method(3) 230.06 2 115.03 .43 ns VE×Method 123.88 2 61.94 .23 ns subj 17512.15 66 265.34 Total 17928.02 71 +p<.10 *p<.05 **p<.01
Variance analysis of VE condition and Method condition in NS of SSQ was carried out. As a result of two-way ANOVA to analyze the conditions of 1A, 1B, 1C, 2A, 2B and 2C, there were no significant differences between the two conditions.
6.3 Oculomotor Score
SSQ の OS における VE 条件と軽減手法条件の分散分析を行った. 1A(n=12)におけるスコアの平均は 18.32(SD=19.44),1B(n=12)は 8.84(SD=10.65),1C(n=12)は 12.63(SD=17.04) , 2A(n=12) は 13.27(SD=12.81) , 2B(n=12) は 8.21(SD=10.92) , 2C(n=12) は 17.06(SD=26.46)であった.Table 6-4 と Fig. 6-2 は NS における平均と分散を示す.各条件につい て2 要因被験者間の分散分析を行った結果,有意な差は見られなかった.また,Table 6-5 は分散 0 5 1A(n=12) 1B(n=12) 1C(n=12) 2A(n=12) 2B(n=12) 2C(n=12) Conditions2 B 12 8.21 10.92
2 C 12 17.06 26.46
Fig. 6-2 Mean of OS(n=72)
Table 6-5 Analysis of variance(OS)
S.V SS df MS F VE(2) 3.19 1 3.19 .01 ns 0 5 10 15 20 25 1A(n=12) 1B(n=12) 1C(n=12) 2A(n=12) 2B(n=12) 2C(n=12) S co re Conditions
25.52(SD=28.88) , 2A(n=12) は 24.36(SD=24.85) , 2B(n=12) は 13.92(SD=16.07) , 2C(n=12) は 25.52(SD=34.02)であった.Table 6-6 と Fig. 6-3 は NS における平均と分散を示す.各条件につい
て2 要因被験者間の分散分析を行った結果,有意な差は見られなかった.また,Table 6-7 は分散
分析の結果を示す.
Table 6-6 Mean and S.D.(DS)
VE Method n Mean S.D. 1 A 12 23.20 29.16 1 B 12 12.76 18.38 1 C 12 25.52 28.88 2 A 12 24.36 24.85 2 B 12 13.92 16.07 2 C 12 25.52 34.02 Fig. 6-3 Mean of DS(n=72) 0 5 10 15 20 25 30 1A(n=12) 1B(n=12) 1C(n=12) 2A(n=12) 2B(n=12) 2C(n=12) S co re Conditions
Variance analysis of VE condition and Method condition in DS of SSQ was carried out. As a result of two-way ANOVA to analyze the conditions of 1A, 1B, 1C, 2A, 2B and 2C, there were no significant differences between the two conditions.
6.5 Total Score
SSQ の TS における VE 条件と軽減手法条件の分散分析を行った. 1A(n=12)におけるスコアの平均は 20.26(SD=28.82),1B(n=12)は 11.53(SD=11.57),1C(n=12)は 16.52(SD=21.78) , 2A(n=12) は 17.14(SD=17.64) , 2B(n=12) は 96.62(SD=10.18) , 2C(n=12) は 19.32(SD=29.48)であった.Table 6-8 と Fig. 6-4 は NS における平均と分散を示す.各条件につい て2 要因被験者間の分散分析を行った結果,有意な差は見られなかった.また,Table 6-9 は分散 分析の結果を示す.Table 6-8 Mean and S.D.(TS)
VE Method n Mean S.D. 1 A 12 20.26 23.82 1 B 12 11.53 11.57 1 C 12 16.52 21.78 2 A 12 17.14 17.64 2 B 12 9.66 10.18 2 C 12 19.32 29.48
Fig. 6-4 Mean of TS(n=72)
Table 6-9 Analysis of variance(TS)
S.V SS df MS F VE(2) 9.52 1 9.52 .02 ns Method(3) 959.32 2 479.66 1.07 ns VE×Method 116.95 2 58.48 .13 ns subj 29517.33 66 447.23 Total 30603.12 71 +p<.10 *p<.05 **p<.01
Variance analysis of VE condition and Method condition in TS of SSQ was carried out. As a result of two-way ANOVA to analyze the conditions of 1A, 1B, 1C, 2A, 2B and 2C, there were no significant differences between the two conditions.
0 5
1A(n=12) 1B(n=12) 1C(n=12) 2A(n=12) 2B(n=12) 2C(n=12)
と, Method B を体験した実験参加者の SSQ スコアは NS,OS,DS,TS の全てにおいて Method A と比べて低い値を示している.一方 Method C は,Method A,B と比べて共に平均による差
は見られなかった.これらのことから,Method B は個人差があるが,VR 酔いを軽減させる効 果があると考えられ,Method C は VR 酔いの軽減効果はないと考えられる.また,VE 条件に おける各スコアの平均を比較すると,OS と DS では VE2 のスコアが僅かに VE1 のスコアを 上回っているが,誤差範囲以内であるため,情報量によるVR 酔いの程度に違いはないと考え られる. 次に,VR 酔いの軽減手法として必要なものを考える.Method B において効果が見られたの は,Field of View の操作を行うことで,ベクションを抑えることができたからだと考える.視 覚によるベクションは,中心視野より周辺視野に刺激を提示した方が効果的であるため,移動 時に周辺視野を制限することによって刺激を減らすことでベクションの強度を抑えるためだ と考えられる.Method C について,2.3.3 のように安定した位置に鼻というオブジェクトがあ ることにより,鼻を追加することでVR 酔いの発生が抑えられるのではないかと考える.これ らのことから,周辺視野への影響と,安定した位置へのオブジェクトの配置という考えを基 に,Fig. 7-1 のようなメガネ型のオブジェクトを表示することで VR 酔いの軽減が可能ではな いかと考える. Fig. 7-1 Glasses
object (i.e the nose) in a stable position. From these facts, an idea based on the effect of peripheral visual field and deploying the object in a stable position, it is suggested that it is possible to reduce VR Sickness by displaying virtual objects through virtual glasses (see Fig. 7-1).
条件,軽減手法条件ともに統計学的な有意差は見られなかったが,軽減手法条件であるField of View の操作については多少の影響が見られた.そして,既存の VR 酔いの軽減手法を基に一つ
のVR 酔いの軽減手法の考案を行った.
反省点として,実験材料の不備と実験デザインが不十分であった点が挙げられる.実験材料の
不備について,本研究ではBitalino の EDA センサと ECG センサの同時利用を目標としていた
が,最終的にBitalino の ECG センサのみの使用となった.加えて,ECG センサが正常な記録が
できないという問題が発生した.これらについて,生体センサとして選定したBitalino (r)evolution Freestyle Kit BLE であるが,Bluetooth 4.0 対応である BLE バージョンでは一つのセンサでしか動 作せず,Bluetooth 2.0 対応である BL バージョンであれば複数のセンサが動作するということが
分かった.また,回路についてハンドメイド型であるFreestyle Kit ではなく,基板に EDA や ECG
などのセンサ類が予めはんだ付けが行われているBoard Kit を選定することで解決できたと考え る.実験デザインについて,今回2 種類の VE 条件と 3 種類の軽減手法条件の合計 6 条件で実験 を行った.そこで,実験参加者に対する条件の割り当てについて,1 回目と 2 回目の計測で重複 が起こらないように割り当てたため,1 回目に 1A,2 回目に 2A という VE 条件を実施した実験 参加者もいれば,1 回目に 2A,2 回目に 2C という軽減手法条件を実施した実験参加者もいる. そのため,評価において実験参加者内で比較をすることができなくなり,実験参加者間での比較 では人数が不十分であった.実験デザインの段階で評価の方法があいまいであったため,実験デ ザインを行う際には求めたいデータと,行いたい実験とを見極め,適切な実験デザインを行う必 要がある. 展望として,本研究によって得られた知見と反省点を踏まえ,効果的なVR 酔いの軽減手法の 研究を継続するとともに,提案したメガネ型オブジェクトの効果の計測行いたい.
In this research, ‘anxiety’ as a proxy for mild VR Sickness was measured, compared and evaluated in VEs which implemented the reducing methods of VR Sickness, and also studied more effective reducing methods of VR Sickness. As a result, it was possible to compare and evaluate the VR sickness reduction method by using SSQ. There was no statistically significant difference in both VE condition and Method condition, but the influence was observed on controlling Field of View which is Method condition. In addition, reducing methods of VR Sickness based on existing reducing methods of VR Sickness were devised.
experimental design, when conducting experimental design, it is necessary to explicitly and exactly determine the data that the researcher wants to obtain and the experiments wants to perform, and to subsequently design appropriate experiments.
As a future prospect, based on the findings and reflections obtained in these experiments, research about effective reducing methods of VR Sickness will be continued, and subsequently measure the effect of a customized glasses type object.
Thank you to Professor Michael Vallance who supported and taught me about my research. I received a lot of ideas and advice from various view points, and I was able to proceed successfully with my research. Professor Ian Frank who gave me advice on my research, and Associate Professor Atsuko Tominaga who gave me advice on the evaluation and analysis. And Michael Vallance’s laboratory members and the students who helped me collect the experiment data.
[1] S. Tachi, M. Sato and M. Hirose, Virtual Reality Studies, Coronasha, 2011.
[2] S. Davis, K. Nesbitt and E. Nalivaiko, "A Systematic Review of Cybersickness," Proceedings of the 2014 Conference on Interactive Entertainment, pp. 1-9, 2014.
[3] T. Seno and H. Suzuki, Vection toha nanda!?, Kyoritsu Shuppan, 2017.
[4] M. Ogawa and T. Seno, "Colorful stimuli might inhibit vection," Transactions of the Virtual Reality Society of Japan, vol. 21, no. 1, pp. 31-33, 2016.
[5] R. S. Kennedy, N. E. Lane, K. S. Berbaum and M. G. Lilienthal, "Simulator Sickness Questionnaire: An Enhanced Method for Quantifying Simulator Sickness," The International Journal of Aviation Psychology, vol. 3, no. 3, pp. 203-220, 1993.
[6] E. R. Muth, R. M. Stern, J. F. Thayer and K. L. Koch, "Assessment of the multiple dimensions of nausea: the Nausea Profile (NP)," Journal of Psychosomatic Research, vol. 40, no. 5, pp. 511-520, 1996.
[7] S. L. Ames, J. S. Wolffsohn and N. A. McBrien, "The development of a symptom questionnaire for assessing virtual reality viewing using a head-mounted display," Optometry and Vision Science : Official Publication of the American Academy of Optometry, vol. 82, no. 3, pp. 168-176, 2005.
[8] C. Nakagawa, "Seirihannou wo motiita douyoubyou no hyouka ni kansuru kenkyuu," 2008. [9] J. C. Miller, T. J. Sharkey, G. A. Graham and M. E. McCauley, "Autonomic Physiological Data
Associated with Simulator Discomfort," Aviation, space and environmental medicine, pp. 817-819, 1993.
[10] A. S. Fernandes and S. K. Feiner, "Combating VR sickness through subtle dynamic field-of-view modification," IEEE Symposium on 3D User Interfaces (3DUI), pp. 201-210, 2016. [11] D. Whittinghill, B. Ziegler, T. Case and B. Moore, "Nasum virtualis: A simple technique for
reducing simulator sickness," 24 3 2015. [Online]. Available: http://www.purdue.edu/newsroom/releases/2015/Q1/virtual-nose-may-reduce-simulator-sickness-in-video-games.html. [Accessed 2 11 2017].
[12] D. Tambovtsev, N. Floksy and O. Peshé, "How to Avoid the Effect of Motion Sickness in VR," VRScout, 1 7 2016. [Online]. Available: https://vrscout.com/news/avoid-motion-sickness-developing-for-vr/. [Accessed 5 12 2017].
Fig. 4-4 VE1 ... 10
Fig. 4-5 VE1 view ... 11
Fig. 4-6 VE2 ... 11
Fig. 4-7 VE2 view ... 12
Fig. 4-8 Bag ... 12 Fig. 4-9 Drink ... 13 Fig. 4-10 Map ... 13 Fig. 4-11 Tablet ... 13 Fig. 4-12 Lamp ... 14 Fig. 4-13 Arrow ... 14
Fig. 4-14 Controlling Field of View ... 17
Fig. 4-15 Virtual Nose ... 17
Fig. 4-16 Bitalino ECG Sensor ... 18
Fig. 4-17 My Bitalino Circuit ... 19
Fig. 4-18 OpenSignals ... 19
Fig. 4-19 Subject’s view ... 20
Fig. 4-20 VE1 route ... 21
Fig. 4-21 VE2 route ... 21
Fig. 5-1 1A view ... 22 Fig. 5-2 1B view ... 23 Fig. 5-3 1C view ... 23 Fig. 5-4 2A view ... 24 Fig. 5-5 2B view ... 24 Fig. 5-6 2C view ... 25
Fig. 5-7 Position of Electrode ... 27
Fig. 5-8 Experiment 1 ... 28
Fig. 5-9 Abnormal data ... 29
Fig. 6-1 Mean of NS(n=72) ... 36
Fig. 6-2 Mean of OS(n=72) ... 37
Table 5-5 Number of subjects in the experiment 2 ... 31
Table 5-6:Result of SSQ in experiment 2 ... 32
Table 6-1 Weights for symptoms ... 34
Table 6-2 Mean and S.D.(NS) ... 35
Table 6-3 Analysis of variance(NS) ... 36
Table 6-4 Mean and S.D.(OS) ... 37
Table 6-5 Analysis of variance(OS) ... 37
Table 6-6 Mean and S.D.(DS) ... 38
Table 6-7 Analysis of variance(DS) ... 39
Table 6-8 Mean and S.D.(TS) ... 39
![Fig. 2-1 Combating VR sickness through subtle dynamic field-of-view modification [10]](https://thumb-ap.123doks.com/thumbv2/123deta/9903240.998686/9.892.147.780.463.647/fig-combating-sickness-subtle-dynamic-field-view-modification.webp)
![Fig. 2-2 Virtual Nose 2.3.3 その他の方法 Other Methods その他の方法として, VE においてユーザから安定した位置にオブジェクトを配置することで ユーザはユーザ周辺の予測可能になり, VR 酔いが軽度になるということが言われている [12] . 例として車の運転席や,宇宙船の操縦席といったものが挙げられている.](https://thumb-ap.123doks.com/thumbv2/123deta/9903240.998686/10.892.191.720.151.450/としてにおいユーザオブジェクトユーザユーザというとしてといっ.webp)