E206
A Simulation on the Effect of flood control measures in Loess Plateau Basin
○Pingping Luo・Sayama Takahiro・Qiyang Nie
I. Research background and significance
Under the background of frequent extreme rainstorm events and rapid increase in the probability of floods and associated disasters, China's regional development is under great threat. As an advanced means, hydrological numerical model can provide scientific and reasonable theoretical support for the formulation of flood control policy. In this study, a Distributed Rainfall Runoff flood model (RRI model) is developed by the International Center for water disaster and risk management was introduced to solve the problems related to the analysis of the effect of flood control measures[1-5]
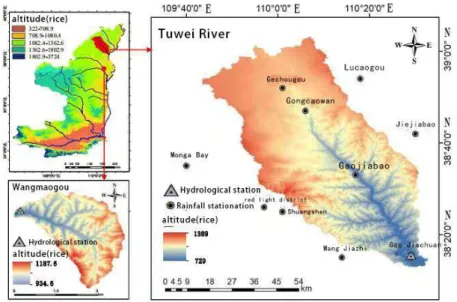
This study takes Wangmao Ditch and Tuwei River Basin in the Loess Plateau of Northern Shaanxi as an example.Wangmao Ditch Valley is a tributary of Jiuyuan Valley in the middle reaches of Wuding River located in Suide County, Shaanxi Province. The basin area is only 5.97 km2, the length of the main river is about 3.75km, and the average channel ratio is 2.7‰. The main soil species in the basin is loess, and the bedrock is mainly composed of Triassic sand shale. Tuwei River is located in Yulin City, [6] Shaanxi Province, in the transition zone
between Maowusu Desert and Loess Plateau, with a basin area of 3294km2 and a main stream length of 140km, with an average channel descent of 3.87‰.
Figure 1 Regional Status Map of Wang Mao Ditch and Tuwei River II. Model principle
RRI model discretizes the watershed into grid units, which are divided into slope and river treatment. the hydrological process under rainstorm is considered in detail. Slope and river are calculated by two-dimensional diffusion wave model and one-dimensional diffusion wave model, respectively,Slope mainly includes surface runoff, lateral infiltration and other processes; Interaction of water quantity between river channel and slope
According to the conditions of water level and embankment height, different overflow formulas are adopted, finally, the fifth-order Runge-Kutta method with adaptive time step control is used to solve the control equation. [7-9]
III. Flood Analysis of Typical Watershed in Loess Plateau of Northern Shaanxi
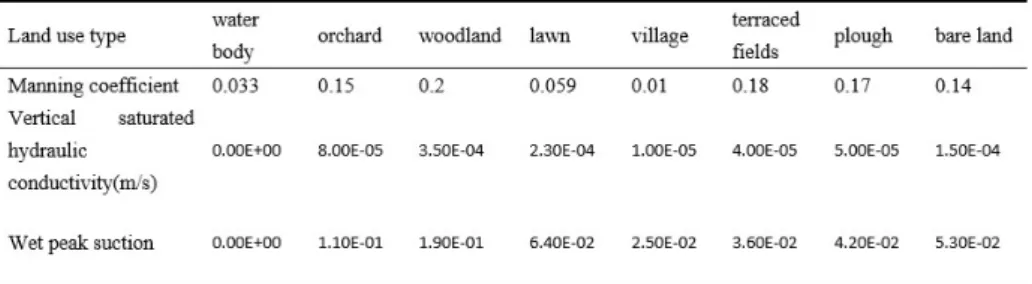
The measured data of rainfall and discharge in the watershed are provided by the hydrological station, while the land use data are obtained from the corrected Landsat satellite data after interpretation.The data span from 1965 to 2010, and the land use was reclassified locally, SRTMDEMUYTM90 data set with 90m spatial resolution is used for elevation data, which is provided by Geospatial Data Cloud Platform of Computer Network Center of Chinese Academy of Sciences.
In this paper, a linear interpolation method is used to interpolate rainfall and runoff data on time scale, and an improved inverse distance weighted method based on dynamic Voronoi diagram is used to interpolate rainfall spatial. Based on the constructed temporary rainfall runoff database, a program is compiled to dynamically search the main position of the flood process according to the flow data,a program is compiled to dynamically search the main position of the flood process according to the flow data. so as to ensure the integrity of capturing the rainfall in the early stage and the water retreat in the late stage of the flood event. [10]A total of 102 flood data were screened and
obtained from 1965 to 2010 in the final basin.
Figure 2 Technical flow chart
K-means clustering algorithm is used to divide the peak discharge and flood volume analysis of the basin into three grades: "small-medium-large". [11]After comparison, the simulation results of 20120715th rainstorm-flood in
Wang Mao Valley are compared with the measured data.Under the RRI model simulation with 10m spatial grid accuracy and 1 hour time scale, the simulation results are consistent with the measured discharge process to a high degree, and the peak time and discharge are accurately described to a high degree.Calculation indicators: nash efficiency coefficient is 0.78, peak ratio is 0.85, and peak time difference is 0.
Figure 3 Simulation Map of Flooding Peak of Rainstorm-Flood on 20120715 in Wang Mao Valley Based on the clustering analysis results of peak discharge, the Tuwei River Basin randomly selected 7 rain floods in each of the "big, medium and small" events, and 21 flood processes verified the RRI modelThe average nash efficiency coefficient of small floods is 0.61, the peak time is up to 3 hours, and the average peak ratio is 1.57.The average nash efficiency coefficient of medium-sized rainstorm-flood process is 0.72, the peak time difference is 2 hours, and the average peak ratio is 1.07The average nash efficiency coefficient of large-scale rainstorm-flood process is 0.77, the time difference between peaks and occurrences is too high to be 1 hour, and the average peak ratio is 1.05. At this time, the simulation effect is the best among the three intensities of rainstorm-flood simulation. [12]
To sum up, the applicability of RRI model in this region has been verified, and the characteristics of flood process and spatial distribution of rainstorm in this region have been revealed. Finally, the typical rainstorm-flood process in two river basins has been inversed and analyzed. [13] The results show that RRI model has a good
simulation test effect in two representative river basins of Loess Plateau in northern Shaanxi, which can meet the simulation of rainstorm-flood process in this region.
Iv. Response analysis of flood to spatial distribution of rainstorm and soil and water conservation measures Taking Tuwei River Basin as an example, the flood response differences of soil and water conservation measures under different rainstorm spatial distribution scenarios were explored. According to the recent land use situation, the planning layout is drawn, which is divided into three areas: shrub and grass area, [14]forest belt and
slope-to-ladder area. Set up a no-new-measure group and two set-measure groups, namely, original land utilization, biological measures, biological measures and engineering measures, and set different rainfall center positions, namely, uniform rainfall, upstream and downstream. The details of model simulation are shown in the following figure. [15]
The spatial distribution of rainfall significantly affects the flood process in the basin under the same average rainfall process. Among them, the peak time of the rainfall center downstream is the earliest, and the peak flow is the largest; However, when the rainfall center is upstream, the peak flow decreases slightly, but the peak time is slightly delayed; When the rainfall is uniform, [16]the flood flow in the whole basin is the lowest, and the peak
Figure 4 Flooding peak simulation diagram under each scenario
Among them, the effect of biological measures is the most obvious, and the average flooding peak can be reduced by 0.39m under the spatial distribution of rainfall. The reduction effect of engineering measures on flooding peak shows a state of downstream > upstream > uniform rainfall center . [17]
The results show that the spatial distribution of rainstorm has a significant impact on the flood process, and the peak time of flood peak flow is the earliest when the rainstorm center is downstream; Soil and water conservation measures can effectively delay the peak time, reduce part of peak discharge and alleviate regional flooding, among which ecological measures have the best delay effect on low peak flood, while engineering measures have the best reduction effect on peak flood..
V. conclusion
In this study, the applicability of rain and flood simulation was tested and analyzed in Wang Mao Valley and Tuwei River Basin in Loess Plateau of northern Shaanxi,The main conclusions are as follows:
(1) A temporary database of rainfall and runoff in Tuwei River Basin is established. The statistical analysis of flood peak and flood volume shows that the secondary flood situation in this area is complex, and the processes of "rapid rise and fall" and "slow rise and fall" are distributed, but the main flow hydrograph is "rapid rise and fall"
(2) The model verification results show that the RRI model has a good simulation test effect in two representative watersheds of one large and one small in the Loess Plateau of northern Shaanxi, and can meet the simulation of rainstorm-flood process in this area
(3) Under the arrangement of soil and water conservation measures with different combinations of biology and engineering, RRI model is used to simulate rainfall-runoff-flooding of three design rainstorm processes. The results show that: Soil and water conservation measures can effectively delay the peak time, reduce part of peak discharge and alleviate regional flooding, among which ecological measures have the best delay effect on low peak flood, while engineering measures have the best reduction effect on peak flood.
VI. References
(IPCC Climate Report, Fifth Assessment, WGII AR5)[J]. 2014.
[2] Kundzewicz Z W, Kanae S, Seneviratne S I, et al. Flood risk and climate change: global and regional perspectives[J]. International Association of Scientific Hydrology Bulletin, 2014,59(1):1-28.
[3] Kundzewicz Z W. Grandes crues en Europe, 1985–2009[J]. Hydrological Sciences Journal, 2012. [4] Aerts D J C J. The role of human behavior in global flood risk assessment models[J]. 2014.
[5]Luo, P., Mu, D., Xue, H., Ngo-Duc, T., Dang-Dinh, K., Takara, K., Nover, D., Geoffrey Schladow,Flood inundation assessment for the Hanoi Central Area, Vietnam under historical and extreme rainfall conditions, Scientific Reports, 2018, 8:12623, DOI:10.1038/s41598-018-30024-5.
[6]Luo, P., Sun, Y., Wang, S., Wang S., Lyu, J., Zhou, M., Nakagami, K., Takara, K., Nover, D., Historical Assessment and Future Sustainability Challenges of Egyptian Water Resources Management, Journal of Cleaner Production, 263, 121154, 2020, https://doi.org/10.1016/j.jclepro.2020.121154.
[7]Sayama T, Tatebe Y, Iwami Y, et al. Hydrologic sensitivity of flood runoff and inundation: 2011 Thailand floods in the Chao Phraya River basin[J]. Natural Hazards and Earth System Sciences Discussions, 2014,2. [8] 佐山敬洋, 建部祐哉, 藤岡奨, 等. 2011 年タイ洪水を対象にした緊急対応の降雨流出氾濫予測[J]. 土木学会論文集B1(水工学), 2013,69(1):14-29.
[9] 佐山敬洋, 建部祐哉, 藤岡奨, 等. 大規模洪水氾濫の時空間起源分析に関する研究[J]. 土木学会 論文集B1(水工学), 2013,69(4):463-468.
[10]Iwasa Y, Inoue K. Mathematical simulations of channel and overland flood flows in view of flood disaster engineering.[J]. 1982,4:1-30.
[11] Cash J, Karp A. A Variable Order Runge—Kutta Method for Value Problems with Rapidly Varying RighthandSides[J]. ACM Trans. Math. Softw., 1990,16:201-222.
[12] ABDEL-FATTAH M, KANTOUSH S A, SABER M, et al. Rainfall-runoff modeling for extreme flash floods in wadi samail, Oman[J]. 土木学会論文集 B1(水工学), 2018,74(5):691-696.
[13] Zhang W, Xie Y, Liu B. Spatial distribution of rainfall erosivity in China[J]. Journal of Mountain Science,2003,21:33-40.
[14] Wilson C B, Valdes J B, Rodriguez-Iturbe I. On the influence of the spatial distribution of rainfall on stormrunoff [J]. Water Resources Research, 1979,15(2):32-328.
[15]Engman T. Roughness Coefficients for Routing Surface Runoff[J]. Journal of Irrigation and Drainage Engineering-asce - J IRRIG DRAIN ENG-ASCE, 1986,112.
[16]Huo, A., Peng, J., Cheng, Y., Luo, P., Zhao, Z., Zheng, C., Hydrological Analysis of Loess Plateau Highland Control Schemes in Dongzhi Plateau, Front. Earth Sci, 2020, 8:528632. doi: 10.3389/feart.2020.528632
[17]Hu, M., Zhang, X., Li, Y., et al. Flood mitigation performance of low impact development technologies under different storms for retrofitting an urbanized area[J]. Journal of Cleaner Production, 2019, 222: 373-380.