Hedge Fund Leverage and Systemic
Risk-Endogeneous Vulnerabilities via Pledged
Collateral
著者
Midori Munechika
著者別名
棟近 みどり
雑誌名
経済論集
巻
38
号
2
ページ
243-261
発行年
2013-03
URL
http://id.nii.ac.jp/1060/00004233/
Creative Commons : 表示 - 非営利 - 改変禁止
http://creativecommons.org/licenses/by-nc-nd/3.0/deed.ja
Hedge Fund Leverage and Systemic Risk
−Endogenous Vulnerabilities via Pledged Collateral ―
Midori Munechika
Contents
I . Introduction
n. Hedge Fund Leverage
Ⅲ. Potential Channels of Systemic RiskIV.
Pledged Collateral and Liquidity RiskV. Concluding Re 】marks
I. Introduction
The hedge fund industry has grown remarkably over the last two decades. and is now regarded as one ofthe key drivers of the structural changes that have occurred in global financial markets. The term “ hedgefund" is applied
to any pooled investment vehicle that is privately organized, and administered by investment
managers. In principle, hedge funds try to generate alpha (outperformance beyond the benchmark )byexploiting market imperfections. They often leverage their investment position to amplify their rate of
return, and thus. they can manage market positions to a much greater extent than the amount of capital.
Their activities not only offer investors the benefits but also help to increase market liquidity and to support the price discovery process, ultimately enhancing market efficiency. Moreover, they contribute to financial
innovation by investing in novel and sometimes illiquid financial instruments. Hedge fiands ’ cross-bordertrading styles beyond different market segments have increasingly interconnected national financial markets.
Although these positive contributions of hedge funds are widely recognized, there are concerns about their
1
Although the term “ hedge fiind " is not statutori】y defined. hedge funds have e χisted for more than 60 years. Thecreation of
the first hedge fiind is generally credited to Alfred Winslow Jones in 1949. Since then, the terra comes intouse to describe any investment fund that used incentive fees, short-selling and leverage. See Financial Stability Forum[2000],
p.8 and Lhabitant [2002],p.7 ,
possible risks to financial stability in times of stress due to their activities under adverse market conditions.How risky hedge funds are as a source of systemic risk is of great interest not only to investors, andacademics,
but also policy makers (e.g ・, market participants. regulators, etc.). The notion of systemic riskremains somewhat nebulous, and thus, can be defined by a variety
of ways to reflect the thinking around whatwe mean by the term. Kambhu,
Schuermann, and Stiroh [2007] describe an essential feature of systemic riskas a situation where:
“the potential of financial shocks to lead to substantial. adverse effects on the real economy. for example.by causing a reduction in productive investment by reducing credit
provision or destabilizing economic
activity. Indeed, it is the transmission of financial events to the real economy that is the defining featureof a systemic crisis. and what distinguishes it from a purely financial event" (pp.5-6,
emphasis inoriginal)
。
Nowadays systemic risk can often taken other foiTns, while the classical case of systemic risk can be found
in banking panics. During the last few decades the overall importance of banks within the u. S. financialsystem has declined with the
growth of capital markets. The financial system has structurally changed from
a banking-dominated financial intermediation to a market-based financial intermediation. Nonbank market
participants have increasingly performed major roles in providing the liquidity and credit needs of the global
economy. These participants include investment banks, hedge funds. mutual funds. insurance companies,
pension funds, and various broker-dealers and related intermediaries. The advent of a so-called “ shadowbanking system"
− consisting of these nonbank market actors- has changed the nature of systemic risk from abank-oriented to a market-oriented crisis
。
Rapid growth of the shadow banking system has expanded the type of activities that banks and other
financial intermediaries engaged in and the assets that they invested in. Lo[2009]stresses that the definition
of systemic risk has to capture the linkages and vulnerabilities of the global financial system, and it is
unrealistic to expect a single measure of systemic risk. He proposes a more realistic measure of systemic riskas a collection of the following six
risk measures to capture such comple χity of the global financial system:leverage,
liquidity, correlation, concentration, sensitivities, and connectedness.
The puipose of this paper is to consider how the confluence of leverage. market risk and (funding and
market)liquidity risk can give rise to possible sources of systemic risk from hedge funds in adverse market
conditions. This paper proceeds as follows. Section 皿describes hedge fund leverage and e χamines theeffect of leverage on risk and
return of hedge fund portfolios. Section Ⅲtraces the potential channels ofsystemic risk from hedge funds through market and credit channels from reported data. Section
工V considersthe pledged collateral
assets and discusses their acceptability in the adverse market conditions. Section V
provides concluding remarks.
n. Hedge Fund Leverage
From the advent of the hedge fund industry. leverage has been an integral part of hedge fund strategies,
while certain strategies may not use it. Simply stated, hedge fund leverage means to carry market positionsmore than their capital. In practice, the concept of
leverage is difficult to uniquely define across hedge funds,because they can achieve leverage in a variety of ways. McGuire and Tsatsaronis [2008] broadly classifiedthe main ways into two categories: funding leverage
and instrument leverage. Funding leverage is leverage
through debt: borrowing money to finance a position via pledged collateral from prime brokers. or repurchaseagreements (repo financing). Instrument leverage is a way to create leverage through the choice of investmentinstruments,
such as derivatives and structured securities (Figure D。
Funding leverage is achieved by creating debt. which is reflected in the balance sheets of hedge funds. First, pledged collateral borrowing is a transaction in which the hedge fund borrows some money from aprime broker
(i.e. a cash lender)in margin accounts and exchanges it for buying the stock. which is calledbuying
on margin. The prime broker requires some kind of collateral such as cash. securities and otherfinancial assets to secure the loan. The pledged collateral is called the margin.
The second form of creating debt is repo financing, which is fypically used to finance the purchase of debtsecurities.
A repo is an agreement coupled with a sale and repurchase agreement, in which one party (a cashborrower)agrees to sell a security to another party (a cash lender) for a specified price and to buy it back atan agreed price at the end of the
contract. Conceptually, a repo can also be regarded as a form of pledgedcollateral borrowing (or loan).
A typical repo used in creating hedge fund leverage leads to an outflow ofcollateral and an inflow of cash. which is a cash-driven repo. A cash-driven repo is motivated by the desire toraise short-teiin
funding. from overnight up to one year in maturity. From the point of view of the cash lender(who agrees to buy a security), the repo leads to an inflow of collateral and an outflow of cash. which iscalled a reverse repo.
The reverse repo is typically a short-term loan, in which the money can be withdrawneasily by not rolling over the repo 。
Ne χt, instrument leverage is achieved by derivatives such as options, futures, swaps, credit derivativesand structured products. Structured products such as the high-risk portions of coUateralized debt obligations
(CDOs)contain implicit leverage. Structured credit instruments can offer hedge fund investors a multiple of
2 McCrary [2005]introduces ways of creating leverage by hedge funds through day trading, unsettledpositions, stock loan. repo financing, derivative securities・ pp.89-92.
Figure l : Hedge Fund Leverage
Hedge funds
←
「
/' 東=” ” ” =”S ゝ
Source: Author's compilation.
: びsinq:l Derivativel instruments くInstrument leverage> |r'  ̄゛-" … … …-- …- 、 にEepo financing |--ミ=-=====w--〃 I ` 一一-- 一一-・ ゝミ ニミ = = = = =ミ ∽ ム <Fimding leverage > 十I イ
I Ways of creating leverage l
1
W −1
the exposure they would otherwise obtain by directly purchasing an asset through the process of pooling and
tranching, which is called embedded leverage. Instrument leverage is the implicit, off-balance-sheet leverage.while funding leverage are reflected in the balance sheet of hedge funds.
There are a number of measures f)r assessing hedge fiand leverage. Ang, Gorovyy and van Inwegen [2011]introduce three measures of financial statement-based leverage. which are widely used in the industry: longleverage,
gross leverage and net leverage. In their formula. the (absolute)dollar values of long positions,short positions. and equity. are denoted by Vi, V. and V バespectively.
First, gross long is defined as the long position divided by equity.'' Vr _Long stock Position
Long Leverage = 石 = Equity (1)Long leverage is a leverage measure of the reporting requirements of the hedge fund positions by the U.S.
Securities and Exchange Commission (SEC)and involves only long positions. Hedge funds can often useshort selling. Short selling is
one of the basic tools used to implement the various hedge fund strategies andis a trade that allows hedge funds to sell stocks they do not own by borrowing them in the stock loan market.
3 Managed Fund Association [2009]explains that. for portfolios without derivative contracts, leverage may be defined
as the market value of assets relative to the portfolio's capital (i.e., financial statement-based leverage measures), andfor more
complex portfolios or portfolios containing derivatives, it may be more appropriate to estimate leverage byanalyzing the risk of different strategies and understanding the potential for eχtreme losses arising from those strategies(i.e.,
risk-based leverage measures).
4 Capital is the value of claim all investors have on a hedge fund, which is also called equity, net asset vah。e (NAV), orassets iinde・ management (A UM) ・
5 Regulation 13-F filings are required by any institutional investor managing more than $100 million. See Ang, A.,Gorovyy, S. and G. B. van Inwegen [2011] ,p.l04.
The stock owner receives cash in e χchange for the stock and gets it back at a future date. When a hedge fundcarries short positions, those positions show up as liabilities. Therefore,
long leverage could result in a largeunderestimate of
leverage and the hedging effect by ignoring the short position 。
Second, gross leverage is the sum of long and short positions divided by equity, often used as a roughmeasure of hedge fund risk.
Gross Leverage _ 歿+ り ー 晦
Position +Absolute ValueEquityShort Positions (2)
It implicitly treats the long and short positions as separate sources of return and risk. However, grossleverage fails to capture the hedging effect if the short position is used for hedging. In the eχtreme example.if
the long and short positions are invested in the same stock implying that both positions have the same valueand market beta. there is no risk, even though gross leverage is high.
Third, net leverage is the difference between long and short positions divided by equity.
Net Leverage − ≒,り_4 Position−Absolute Value oEquityShort Positions (3)
Net leverage is adequate as a risk measure only under severe restrictive assumptions that the long and short
positions have the same value and market beta. Potential divergences in the values and betas of the long andshort positions in the hedge fund portfolio are not taken into account in this measure.
Leverage for hedge funds is often regarded as a synonym for risk because it may increase the return and
risk of a portfolio compared to a long-only unleveraged portfolio of assets. The neχt question is how the useof leverage impacts the risk of a hedge fund portfolio. To assess the impact of leverage on hedge fund risk,the
normal distribution hypothesis on risk and return ofhedge fund portfolios is assumed.
The expected return for the unleveraged hedge fund portfolio is calculated as the weighted average of the returns ofN assets invested:
E 帽 = どw β( 凡) (4)where the weights, W/ need sum t0 1 (or 100 percent of
the portfolio).
When the fund can borrow money from the prime broker through his margin account to buy more of
the stock. leverage increases. The expected return on the leveraged portfolio is calculated as the weighted average of the returns of the assets in the portfolio minus borrowing costs;
E ら)= Σ>iE( 凡) 一Borrowing Rate x (Σ沁 −1) (5)where the sum of the weights, w,
will eχceed 1. If the portfolio is constructed by only two stocks, A andB,the equation (5)simplifies to:
E(恂)= w^ X £(凡j)十吟 ×£(ゐ) 一Borrowing Rate x (
り 十心 −1)
(6)Portfolio risk is the standard deviation of the portfolio, which is calculated by using its variance-covariancematri χ:
、庶 尚 尚こ
For two stocks, j and B, the equation (7)reduces to:
(7)
り り 回 曙 +2 り り ら,B + 昭 司 = ,/曙 曙 +2 呪AWBCrA<^B)A,B + 回 心 (8)where
p denotes a correlation coefficient.
Suppose the hedge fund portfolio has an expected return of 18% (annual return)and a standard deviationof return equal to 20%, whose norm 犬al distribution is displayed in straight line (see Case A in Figure 2). Incase
of an unleveraged long position, potential losses on the portfolio cannot eχceed the amount of investors 'initial capital since the capital base covers 100% of the market value of long stock. The area to the left of Opercent on the x-a
χis shows the percentage of the probability of the loss of the unleveraged portf)lio. Theinvestment would lose money 18.4% of the time.
The use of leverage directly affects the expected return of any investment strategy, but it may increase the risk of the fund portfolio such as the probability of a loss of a certain magnitude. Let us eχamine the impactsof
leverage on portfolio risk and return taking two cases of margin transactions.
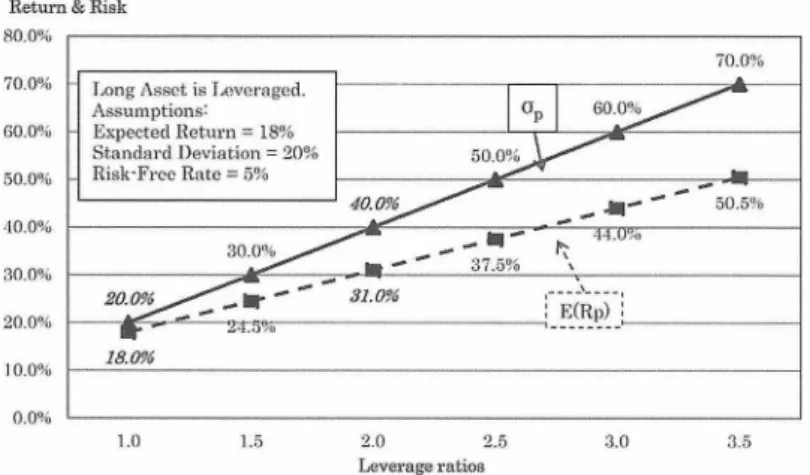
First, consider the case of a hedge fund buying on margin (i.e., borrowing money from a prime broker).A hedge fund manager may create leverage by buying on margin if the eχpected return on an asset is higherthan the borrowing rate (i.e.,
a risk一free rate). Borrowing money to buy more of the same asset can increasesthe expected return on the fund portfolio. however, as well as risk. Figure 2 displays the impact of leveragewhen the borrowed money
is invested in more of the same stock j already held in the fund. When the fundincreases the leverage from 1:1 to 2:1 by borrowing money to buy more of stock A, the standard deviation ofreturn rises from 20
%t0 40% and the expected return also rises from 18% to 31% (see Case B: the
normaldistribution of undiversified
portfolio depicted by the dotted line in Figure 2)/The doubling of portfoliorisk that arises from leveraging leads to a probability of loss from 18.4% to 21.9%. In this case, as itsleverage ratio increases, the hedge fund
can amplify its portfolio return, but also increases its portfolio risk proportionally (Figure 3).
6 Most hedge funds are organized as limited partnerships or limited liability corporations so that potential losses on thehedge
fund portfolio more than 100% of their capital do not affect hedge fund investors. See in more details abouthedge fund business models in McCrary [2005], Chapter 5.
7 Leverage may be quoted as a ratio, percentage or as an incremental percentage. i.e., 3:1 (ratio), 300% (percentage), or200% (incremental percentage. For no leverage. leverage may be quoted as 1:L 100%, or 0% for no leverage.
Figure 2 : Distribution of Returns of Unleveraged and Leveraged Portfolios Probability 2.50 I 2.00 1.50 LOO 0.30 0.00 Case A Un level・a"ecl Portfolio ijevera^e ° 1:1 Expected Return =18%
Stimdard Deviation =20 °iProbabilitv of Loss =18.4 % ふ・= =
249
1 1 1 C a s e C D i v e r s i f i e d P ) r t f o l i t ) L e v e r a g e ° 2 : 1 C o i ヽ r e 】 a t i ( ) n = O . ; { K x p c c t e d R c t u i ・ n = .■ ! ! ‰ S t a n d a i ・ d D e v i a t i o n = 3 2 . 2 り P r o b a b i l i t y o f L o s s = 1 6 . 8 % J I ・』・ J ●ゑ・・・・ I・・● J J,●・・ t ●寓, 丿丿丿庸 s・ 4 ● a &・ a・ I ●・ x 』 一 一 一一 一 一 一 一一 IC a s e B
I Undiversified Portto 】iol Leverage ° 2:l
Expected Return = 'i心 lStundard Deviation = 40%i
' Probabi]ityof Loss =21.g %!
y… ………… _....
S
・80"4 ・60",;. -10% ■2O' 0% 20% 40.'i % (iO %Expected Return
Source: Author's compilation.
8 O ≫ 1 . 1 0 0‰ 120 % 1・10%
However, hedge funds may use the borrowed fund to buy a different stock such as stock B to pursue therisk reduction through portfolio diversification. Suppose the diversified portfolio is composed of stock j and
stock B (Case C), and both stocks have the same risk and return (the expected return is 18%, the standarddeviation is 20%)individually,
but the coiTelation coefficient of stock j and B is 0.3. The e χpected returnof the leveraged and diversified portfolio is 31% and its risk is 32.2%, which can be calculated by usingequations
㈲and (8). The diversification effect significantly reduces the leveraged portfolio risk from 40%t0 32.2% and the probabilities of loss decrease from 21.9 to 16.8%, which is lower than the 18.4% lossprobability of
an unleveraged portfolio (see Case C: the normal distribution of diversified portfolio depictedby the fine dotted line in Figure 2) 。
Ne χt, take the case of a hedged portfolio with long and short positions. Conceptually, selling short is atrade of buying on the margin in the opposite direction to the market. The purpose of selling a stock short is
to hedge a portfolio's market eχposure and/or sector eχposure, profit from stock price declines. and capturerelative value. The combined purchase and sale of stocks (long/short stocks)is one of the most popularhedge
fund strategies。
The risk of a hedge fund portfolio is significantly reduced by constructing it with opposite positions,
i.e., with two nearly identical long- and short positions. For eχample, stocks j and B are assumed to beequal in value at $100 and 80% con・elated. The expected return and the standard deviation of long stockj are 18%
and 20%, respectively, and those of short stock B are 15% and 16%, respectively. (Here, some
Figure 3 : Impact of Leverage on Portfolio Risk and Return
Eetum & Risk
80.0% 70.0 % % % % % ‰0 0 0 0 0 0 0 0 0 06 5 4 3 2 10.0% 0.0% 70、Q% r^ong Asset is Lovor;igc;d.Assumptions:
Expected Return = 18%Standard Deviation =2O%Risk-Froo Rate =O% Op w.iyn,^ ―' 50/ 卜. / −−‘ ̄ ゛t/.yユ´/ 。 ∼‘綱’ ゜”.゜'i> 30.0%/ / 丁こ 一" " 37.5こ 咬、44.U".o
゛シ ダ;T/ 31.0% E
お
口゛ z^.iy/○ −-−‘- −-18.0%− 1.0 1.5Source: Author s compilation.
2.0 2.5 Leverage ratios
3.0 .1.S
assumptions for Case D are different than those for Case B). In addition, the cash generated by the short saleis
assumed to be reinvested at the risk-free rate equal to 5%. The expected return and the standard deviationof the combined portfolio are 8% and 12%, respectively, (see the normal distribution of Case D depictedby the dotted line in Figure 4). While the combined portfolio risk of 12% (Case D)is much lower than theunleveraged portfolio risk of 20%
(Case A), and leveraged diversified portfolio risk of 32.2% (Case C), therisk of loss is 25.2%, higher than the unleveraged- and leveraged diversified portfolios. Nevertheless, itis important to note that the probability of a large loss is much smaller for the unleveraged, and leveraged diversified portfolios.
In summary. there is no simple relationship between leverage and risk of each individual hedge fund
portfolio, while it seems that leverage often tends to create a riskier portfolio. In particular, financialstatement-based leverage by itself is not an adequate measure of a hedge fund portfolio's risk since it does
not shed light on the probability of change occurring or the likely magnitude of change in portfolio value.In short, the impact of using leverage
on risk of hedge fund portfolios should be evaluated by taking intoaccount the size of positions and volatilities. as well as correlations between assets and liabilities. Sometimesleverage can be a very effective
risk management tool if properly employed.
9 The probabilities of 】OSS at the eχpected return (−10%)of the unleveraged, 】everaged and undiversified, leveraged anddiversified, long/short portfolios are 8.1%, 15.3%, 10.1% and 6.7%, respectively.
−250 −
-Figure 4 : Distribution of Returns of Unleveraged and Leveraged L/S Portfolios Probability 3.50 : i . ( ) 0 2.r30 2.00 1.50 1.00 0 . 5 0 ( ) . ( ) ( )
/; \ CaaeDLoveiagcd Portfolio with Long/Short StocksLeverage °2:1Kxpected Return = s‰Standard Deviation =12%Probabi]ity of I刀ss =25.2%
ドダ
-l t
■・=1/1\
/ X Case AUnleverased PortfolioLeverage =1:1Expected Return = 18%Standai'dT)e-\nation = 20%ProbaUbilyofLoss= 18.4% 1 1
/ 八
ダ y
\
ぐ
ノ
゛ χ`、二
-8O% -6O'!i. -40!'<> -20% O" り 20% 40% 60% 80% 100% 120% 140%Expected return
Source: Author's compilation.
Ⅲ. Potential Channels of Systemic Risk
As examined in the previous section. leverage itself is not an independent source of risk. However, theFinancial Services Authority [August, 2012]states that hedge funds did not play a major role in the financialcrisis,
though they do have the potential to pose systemic risks to financial stability if they are individuallyvery large or leveraged. In the conte
χt of global financial stability. how hedge fund leverage affects systemicrisk through market and credit channels has to be e χamined. Hedge funds invest in a number of asset classes,in which they
are significant investors in certain markets. With their active trading styles. they are having aclear impact on global financial market dynamics. 0n the positive side, their trading behaviors have boostedmarket liquidity and enhanced price discovery in financial markets and they reduce the likelihood of pricinginefficiencies.
However, in moments of financial crisis, forced selling (e.g., a fire sale caused by a margincall)may lead downward price adjustments to overshoot. and deplete market liquidity. Accordingly, it is
possible for their collective behavior to be one of the drivers behind disruptions in liquidity and pricing. Thismarket channel is where market dislocations can disrupt liquidity and pricing.
Reported Data
The potential stress within the hedge fund industry to be transmitted through the market channel may be estimated by the hedge funds' gross exposures relative to the size of the global markets they trade. The
data used here is based on the semi-annual report of the Financial Services Authority (FSA), Assessing thePoss,ble Sources of Systemic Risk from Hedge Funds. Figure 5 reports a hedge fund's total gross footprint togive an idea of the scale of its presence in the market. Footprint is defined by the FSA as the long and short
Figure 5 : Hedge Fund Gross Exposures (March 2012)
CDS
curitised products
Loans
(300)(250) (200)(150)(100) (50) 50 1(M 150 200 250 300S Billions ■LMV Source:FSA [2012], August, p.8 ■SMV Net (LMV - SMV)Table l : Hedge Fund Gross Exposure to Relative to Market Size
[%]
Oct-09
Apr-10
Sep-10
Mar-ll
Sep-11
Mar-12
Listed Equities
0.5
0.6
0.6
0.7
0.6
0.8
Corporate bonds
0.3
0.3
0.3
0.2
0.2
0.3
G10 bonds 0-1 year
1.2
0.6
0.6
0.7
0.8
0.9
G10 bonds 1十year
0.8
1.0
1.3
1.6
1.8
1.8
Non-GlO sovereign bonds
0.1
0.2
0.2
0.2
0.2
0.4
Financial institution bonds
0.2
0.1
0.0
0.1
0.1
0.1
Convertible bonds
10.1
8.1
8.3
7.0
6.9
7.3
Structured/securiti S ed products 0.2
0.3
0.3
0.4
0.5
0.9
Credit derivatives
0.8
1.0
1.1
1.4
1.0
1.3
Foreign e
χchange
0.3
2.4
0.8
1.2
1.3
1.4
Interest rate derivatives
2.9
4.7
4.0
3.5
2.8
2.7
Commodity derivatives
2.5
4.8
3.7
5.8
4.4
6.0
Source: FSA, Assessing the Possible Sources of Systemic Riskfro? Hedge Funds, various issues.Note: Derivatives measured based on notional value.
positions (i.e., gross exposure) held in equities. corporate bonds. convertible bonds. sovereign bonds, loans.CDS and structured credit.
In aggregate, surveyed hedge funds have sizable long and short exposures inlisted equities, GIO bonds of one year or greater tenor. and credit default swaps (CDS). FSA [August 2012]points out that hedge funds' gross exposures
are 55% in the U.S. for listed equities. Approximately 5 1%of gross CDS is on indices, 31% is single name CDS, and the rest in exotic positions such as credit defaulttranches.
Figure 5 also reveals a clear tendency of hedge iiinds to use offsetting long and short positions (netexposures), which is one of the features differentiating hedge funds from other parts of the asset managementindustry.
While the growth trajectory of the hedge fund industry is impressive, the size of the gross exposure remainsmall compared to the global markets for equities or debt securities, as shown in Table 1. There are few asset
classes where aggregate gross exposures were greater than 2% of total market size. However, the convertiblebond, interest rate derivative and commodity derivative markets are eχceptional cases. In addition. there aresome financial
instruments in which hedge fund gross exposures have increased remarkably from October
2009 to March 2012:GIO bonds of one year or greater tenor, structured/securitized products and commodityderivatives.
The gross leverage by hedge fund strategies is reported in Figure 6. Aggregate fund leverage (total)hasremained stable
across survey periods at about 3.8 times NAV. In general. hedge funds with 'spread-based'strategies can be expected to have greater gross leverage to those with ' fimdamentals-based' strategies. Asreflected in the results, gross leverage of
員χed-income arbitrage is highest among hedge fund strategies,which decreased from 14 times NAV in the April 2010 survey to 10 times NAV in the March 2011 survey,and was reported at 12 times NAV
in the March 2012 survey. Moreover, multi-strategy has seen an overallincrease m gross leverage 。
It is important to understand the source of hedge fund borrowing to achieve leverage because of thepotential impact on systemic risk through credit channels. According to Figure 7, hedge funds rely onborrowing via repo in aggregate. with 47%
coming from this source in March 2012. The FSA [August 2012]reports that a high portion of repo financing between surveyed banks and their hedge fund counterpartiesconsisted of Gl 0 government bonds as collateral. Hedge
funds increased their borrowing via prime brokerage and their synthetic borrowing from September 2011 to March 2012 。
Figure 8 eχhibits total borrowings classified by hedge fund strategies expressed as a multiple of NAV. Itprovides useful information about hedge funds ' interconnections with creditors such as banks and primebrokers,
which reveals a key channel through which systemic risks may propagate. Typically, fi χed-incomearbitrage,
convertible arbitrage and global macro seek higher leverage via repo financing and other strategies,especially quantitative long/short equities or event driven strategies borrowed from prime brokers. Managedfutures are via cash that goes to an exchange like the Chicago Mercantile E
χchange (CME), and thus not acollateral/ leverage based strategy. Emerging markets do not generally require leverage (Singh[20n]) 。
The intercormectedness has become considerably more complex within the growth of the shadow bankingsystem over the past two decades, in which an intermediation chain binds a variety of non-bank marketparticipants such as hedge funds,
finance companies, etc. into a network through a wide range of securitizationand secured funding techniques. In the context of hedge fund leverage. this interconnectedness can beconsidered
from the view of the collateral chains in secured funding techniques such as repo, and pledged
642 08642011 1 1
3t>ej3A31
Figure 6 : Gross Leverage by Hedge Fund Strategies
Equity Credit FI Eroetging Long/ Long/ Arbitrage Markets Short Short ■Apr-10 Survey GlobaS Managed Multi-MaCTO Futures strategy Selected strategies ■Mar-11 Survey Other Total Har-12 Survey
Source: Financial Service Authority [2012], August, p.l4.
Note: The data originate from Hedge Fund Survey (HFS)conducted in March 2012 by FSA, U.K.
S D U l M O U O g l B J O l 1 0 % お 一 飢 ご 宍 一一一 % % % % %403020100
Figure 7 : Source of Hedge Fund Borrowings
Oct-09 Apr-10
■Borrowing via Repo Borrowing via PB
Sep-10 Mar-11 Sep-11 Mar-12 Survey Date
■Synthetic Borrowing (TRS & CFD )
賠Unsecured Borrowing
Source : Financial Services Authority [2012],August, p.l3.
Note : In synthetic borrowing, TRS and CFD denote total return swaps and respectively.
contracts for difference
collateral borrowing via prime brokers. The assets posted by hedge funds as pledged collateral (i.e., primarycollateral)are continuously re-invested to
ma χimize returns over their maturity tenor. Primary collateral isre-used as collateral that can be re-pledged. The primary collateral can be borrowed against assets that areless liquid,
which also function as collateral, and these less liquid assets in turn can also be borrowed.'"
10 Singh[2012]describes the collateral chains in the intermediation of credit as analogous to the money supply in
254 −
-一 ’ 一 1 4 1210 8 6 42 0
Figure 8 : Total Borrowing as a Multiple of NAV by Hedge Fund strategies
Equity Long/ Short
Credit FI Emerging GLobal Managed Multi- other Total Long/ Arbitrage Markets Macro Futures strategy
Short
Selected strategies
■Apr-10 Survey ‐Mar-ll Survey Mar-12 Survey
Source: Financial Service Authority [2012], August, p.l5.
Notes: Total borrowing is shown as (Borrowing 十Net Asset Value)/Net Asset Value.
Singh[2012]estimates the collateral flows from 2007-2011 (Figure 9). Hedge funds are one of themajor providers of
(primary) collateral to large banks and dealers through leveraging their positions throughrepurchase agreements and loans made under prime broker agreements for finance. The other providers aresecurities lending via custodians on behalf of pension funds, insurers,
official sector accounts and commercialbanks.
The pledged collateral is usually received by the central collateral desk of dealers and large banks."They re-use the collateral (i.e., rehypothecation)to meet the ‘ demand ' from the financial system. Totalcollateral
from primary sources that could be re-pledged by the large dealers was $1.35 trillion (with hedgefunds)plus $1.05 trillion via securities lending. for a total of $2.4 trillion, while total collateral received
by the central collateral desk of large dealers was $6.2 trillion as of end of 2011. Therefore, the velocity ofcollateral was approximately 2.6,
which was calculated as the ratio of the total collateral received to primarysources of collateral. The mark-to market value of total collateral from hedge funds that come to the largedealers is estimated to have been about $1.35 trillion as
ofend-2011, with $700 billion to have come via
prime broker funding and $650 billion from repo funding outside the prime brokers. Table 2 providessummary statistics of how the sources and the collateral chains result in estimating the overall collateral.
traditional banking. The stock of high qua 】ity assets is 'high powered' money, the haircut is the reserve ratio. and thenumber of
times collateral gets re-pledged is the equivalent of the velocity of money. Gordon and Metrick [2009]alsohave said that repos are considered part of the money supply.
n In the U.S., Goldman Sachs, Morgan Stanley, JP Morgan, BoA/Merrill and Citibank are major dealers active in thecollateral industry. In Europe and elsewhere. those dealers are Deutsche Bank, UBS, Barclays, Credit Suisse, SocieteGeneral,BNP Paribas, HSBC,Royal Bank of
Scotland and Nomura. See Singh [2011], p.5.
Figure 9 : The Sources and Uses of Collateral (2007,2010 and 2011)
〈Trillions USD 〉
: 三 回]:
Central Collateral Deskド
u s S I O t r i l l i o n ( 2 0 0 7 ) 回 心 ご お 谷 -。一一 一一 一 一一 一一 - - - S e c u r i t i e s L e n d i n g 一 一一 一− 一 一一 一一 一 一一 - 一 一 一 一ゴ
﹃
圧 三三][三三三 回三 三:
Source: Author‘s compilations from Singh [2012], p. 13 (Figure 6).
Note:* Security lending via custodians for sovereigns/ official accounts. pension, insures,asset managers, ETF 稲nds etc.
Table 2 : Sources of Pledged Collateral, Velocity and Overall Collateral
Year
Sources
Total
Chain
Overall
Hedge Funds
Others
Source
(Velocity)
Collateral*
2007
1.7
1.7
3.4
2.9
10.0
2010
1.3
1.1
2.4
2.4
5.8
2011
1.3
1.05
2.4
2.6
6.2
Source:Singh [2012]p. 13.
Note:*The amount of overall collateral is calculated as “total source" times “chain". IV. Pledged Collateral and Liquidity Risk
Endogenous hedge fund vulnerabilities can be found when a large hedge fund or a group of hedge funds were faced with difficulties or failures, which could lead to far-reaching repercussions for exposed banks and broker-dealers. Hedge fiands can fail in at least two ways: capital insolvency and liquidity insolvency (CRMPG[2005]).
Capital insolvency means that their liabilities exceed assets. Liquidity insolvency means that theyrun out of cash and are unable to raise new funds. which come out of funding liquidity risk and asset liquidityrisk.
Both kinds of insolvency can be amplified through creating leverage by hedge funds。
Liquidity refers to the ability to trade quickly without moving the price丿There are two separate. but
12 From the viewpoint of information theory, Gordon and Metrick [2009]define liquidity as the ability to trade without the fear of adverse selection on either side of the transaction, and thus, liquidity requires symmetric information.
related types of liquidity: market liquidity and funding liquidity. First, market liquidity is the ability toliquidate an asset quickly. and in large volume. without substantially affecting the asset
's price. Thus,market liquidity risk
refers to the risk that a fiind is unable to sell an asset quickly at reasonable price, where
liquidation value of assets may differ significantly from their current mark-to-market values. An illiquid
instrument is, in other words. an asset that cannot be liquidated in a short period of time without substantialloss in asset price. Second,
funding liquidity is the ability to acquire funding in the event of credit impairmentor some other shock.
Therefore, funding liquidity risk refers to the risk that a fund may run out of cash andbe unable to obtain sufficient new funds to meet its various obligations such as margin call to cover losses onassets used to collateral borrowing
。
While distinct. these two types of liquidity are closely related to each other. For e χample, in the case ofabundant
funding liquidity. traders are able to finance their positions easily, trade in higher volume to supportthe price discovery and smooth price shocks. and keep high market liquidity. In contrast, market illiquidityleads to increased price volatility, which often causes margin calls that reduce funding liquidity. In adversemarket conditions. deterioration in market liquidity and a
dry-up in funding liquidity can reinforce each other
(so-called liquidity spirals). This mutual dependence gives rise to the potential stress for market instability.Singh and Stella [2012]have divided the collateral assets (denoted by C)into two categories (denoted byC7and C2).
The first class. Cl is comprised of a class of assets that in all states of the market conditions areaccepted as collateral without losing value. This type is good collateral. which can be
converted to a demanddeposit at almost no haircut. For example. U.
S. T-bills or u. S. Treasuries, which are direct-obligations ofthe central government. fall into this category. The second class, C2 is composed of
other assets considered tobe acceptable as collateral at the time of normal market
conditions. while losing value at the time of distress.
The availability and acceptability of these assets as collateral depend on market sentiment. counterparty fears,the length of collateral chains. and market imposed haircuts. The two classes of collaterals, C/ and C2 can beconsidered liquid and illiquid assets. respectively
。
The collaterals. Cl and C2, can be e χplained as “information-insensitive " and “information-sensitive "assets. respectively, within the framework of information theory.
In a trading context, informationasymmetries
are closely re]ated to the concept of liquidity. Liquidity requires symmetric information, whichis easiest to
achieve when everyone is ignorant. In theory. the coe χistence of uninformed and informedtraders in
one market means asymmetric information, which leads to reduced trade, and liquidity, ultimately.disappears from the market. This process is called
adverse selection. An asset can be regarded as liquid if ithas the characteristic to trade a given amount quickly without moving its prices,
and without an uninformed
trader losing money to a privately informed trader. Dang, Gorton and Holmstrom [2009]have said that this
is one forni of symmetric information; symmetric ignorance. Under symmetric ignorance. the incentive for
private information production about the asset is smallest even if there are informed and uninformed traders
in the market. They identify this type of asset as information-insensitive security. Information-insensitivitymeans that the securities are immune from adverse selection when trading; in other words,
trading can o ccurquickly without
loss to insiders. However, if an economic shock is large enough then security that wasinformation-insensitive becomes information-sensitive. This creates loss of confidence,
and fear of adverseselection reduces liquidity of
the security 。
Under nonnal conditions, the volume of collateral C can support the transactions of collateral borrowing.More important than the sheer size of collateral c, however,
is the behavior of the collateral itself and how itreacts to shifts in market conditions. In times of distressed market, the differentiation of
C2 collateral fromCl collateral will happen. and subsequently lead to
deleveraging. The differentiation of C2 collateral from
Cl collateral can be seen in the changes of margins and haircuts of each asset.'^ Table 3 shows that haircutsvary with different asset classes and rating since they reflect the perceived underlying risk
of the collateral
and protect the lender against a counterparty default. As we have seen, the quantity and quality of assets
comprising C2 changed dramatically in the financial crisis of 2007-2009. In fact. haircuts and margins wentup substantially during the credit crisis of 2008. Even
for us treasuries, the most-credit-worthy and liquidsecurities on the table. haircuts went from 0.25%
to 3%. For less liquid securities like ABS CDOs, haircutswent t0 100%,
which means these securities are no longer accepted as collateral. These sharp increases inmargins and haircuts triggers margin call and aggravated deleveraging pressures, which reinforced interactionbetween valuation and leverage.
In summary, hedge ftinds become more vulnerable to liquidity shocks when they create leverage through
short-term collateralized borrowing with the combination of any structured or illiquid positions (assets)whosefull value cannot be realized in a quick sale."
Difficulties in valuation
go hand in hand with the problems ofilliquidity. Furthermore,
in a volatile market, high levels of leverage increase the likelihood that hedge fundswill fail. It is worth noting that the use of collateral in short-term credit mitigates counterparty risk, but
it canalso increase
liquidity risk because borrowers have to provide additional collateral at short notice if market
13 The difference between the sale and the repurchase prices is the repo rate, which means the interest rate to borrow cash.The sale price of the asset as collateral is below the current market price. The difference between the current marketprice of the asset and the price at which it is sold (coUateralized)in the repo is called
a haircut. The haircut is eχcesscollateral
ization since it means the valuation discount applied collateral placed by counterparty. In effect, the haircutfunctions as an initial margin, or buffer, to protect the cash lender against a loss due to client default. See Adrian and
Shin[2010B],p.l3 and Jorion [2011],p.393.
14 Gordon and Metrick [2009]point out that an important feature of the repo market is that the collateral was oftensecuritized bonds.
Table 3 : Typical Haircut or Initial Margin
April2007
August2008
USTreasuries
0.25%
3%
InvestmentGradebonds
0-3%
8-12%
High-yieldbonds
10-15%
25-40%
InvestmentgradecorporateCDS
1%
5%
Seniorleveragedloan
10-12%
15-20%
Mezzanineleveragedloans
18-25%
35
十
ABSCDOs
AAA
2-4%
95%*んX
4-7%
95%*A
8-15%
95%*BBB
10-20
%
95%*Equity
50%
100 %*AAACLO
4%
10-20
%
PrimeMBS
2-4%
10-20%
ABS
3-5%
50-60%
Source: Joint Working Group of the Financial Stability Forum and the Committee on the Global FinancialSystem[2009], p. 12・
Notes:ABS =asset-backed security; CDO=collateralized debt obligation; CDS=credit default swap;CLO
=collateralized loan obligation; MBS=mortgage-backed security; RMBS =residential mortgage-backedsecurity. *denotes that theoretical haircuts as CDOs are no longer accepted as collateral.
conditions change. The more hedge funds create leverage and widely collateralization is used, the more significant this risk becomes (Singh and Aitken [2009]).
V Concluding Remarks
This paper examines the impact of hedge fund leverage as potential sources of systemic risk. The findingsare as
follows. First, leverage is often regarded for hedge funds as a synonym for risk, but leverage byitself is not an independent source of risk. For an individual hedge fund, there is no simple relationshipbetween the use of
leverage and risk on its portfolio risk. Sometimes leverage can be a very effective riskmanagement tool if properly employed.
Second, in the context of global financial stability, the confluenceof leverage. market risk. credit risk and liquidity risk can give rise to systemic concerns in adverse marketenvironments.
More precisely. leverage influences the rapidity with which changes in market risk, creditrisk and liquidity risk change the value of a hedge fund portfolio. which leads to liquidity spirals. Third,the short-term borrowing for creating leverage with the combination of any structured or illiquid positionsmakes hedge funds more vulnerable
to liquidity shocks. Fourth, the pledged collateral from hedge fundsinduces the collateral chains (so-called rehypothecation), which increases the interconnectedness amongmarket participants.
Fifth, in the process of credit intermediation, a wide range of assets involving illiquidand structured products viewed as information-sensitive assets are used as pledged collaterals. During the
financial crises, their availabilities as pledged collaterals are e χtinguished.
References
Adrian, T. and H. s. Shin [2010A], "Liquidity and Leverage," Federal Reserve Bank of New York Staff Report, No.328.
Adrian, T. and H. s. Shin [2010B] ,"The Changing Nature of Finaneial Intermediation and the Financial Crisis of 200 アー09,"Federal Reserve
Bank of New York Staff Report, No.439.
Ang, A., Gorovyy, S. and G. B. van Inwegen [20111, "Hedge Fund Leverage, ≒Journal of Financial Economics, No.102,pp.102-126.
Bank for International Settlements [2005]Basel Committee on Banking Supervision, The Joint Forum, Credit Risk Tramfer,March.
Bank for International Settlements [2009] ,Joint Working Group of the Financial Stability Forum and the Committee on theGlobal Financial System, “The Role of Valuation and Leverage in Procyclicality," CGSf
Brunnermeier, M. K. and L. H. Pedersen [2007], " Market Liquidity and Funding Liquidity, " Centre for Economic PolicyResearch Discussion P
叩e「, No.6179.
Counterparty Risk Management Policy Group (CRMPG)[2005] ," Towards Greater Financial Stability: A Private SectorPerspective,"
Report of the CPRMGH, Su\y 27.
Dang, T. V・, Gorton, G. and B. Holmstrom [2009], "Opacity and the Optimality of Debt for Liquidity Provision", WorkingPapar.
Financial Services Authority, U.K ・, Assessing the Possible Sources of Systemic Risk from Hedge Funds: A Report on theFindings
of the FSA' s Hedge Fund Swvey and Hedge Fund as Counterparty Survey (various issues). Financial Stability Forum [2000]Report on the Working Gro 叩on Highly Leveraged Institutions,April.
Getmansky, M 。Lo, A. W. and I. Makarov[2004] バAn Econometric Model of Serial Correlation and Illiquidity in HedgeFund Returns," Journal of Financial Economics, No.74, pp.529-609.
Gorton, G. B. and A.Metrick [2009],"Haircuts," NBER Working Paper, No.l5273.
Jagannathan,R., Malakhov, A. and D. Novikov[2010], "Do Hot Hands Exist among Hedge Fund Managers? An EmpiricalEvaluation," Journal of Finance, V・bl. 55, No.l,pp.217-255.
Jorion,P.[2011],Financial Risk Manager Handbook, 嶮ed.,John Wiley & Sons, Inc., New Jersey.
Kambhu, J., Schuermann, T. and K. J. Stiroh [2007], "Hedge Funds, Financial Intermediation, and Systemic Risk," FederalReserve Bank of
New York Economic Policy Review,Vol. 13, No. 3, pp.1-18.
Kambhu, J., Weidman, S. and N, Krishnan[2007], " New Directions for Understanding Systemic Risk √Federal Resei-veBank
of New York Economic Review, Vol.13, No.2, pp.1-83.
Lhabitant, F. s. [2002],Hedge Funds: Myths and Limits, John Wiley & Sons, Ltd., Chichester.
Lo,A.W.[2009], "Regulatory Reform in the Wake of the Financial Crisis of 2007-2008," Journal of Financial EconomicPolicy,
Vol. 1, No.l, pp.4-43.
Managed Funds Association [2009], Sound Practices for Hedge Fund Managers, 2009 ed.
McKinsey Global Institute [2007], The New Power Brokers ・How on. Asia, Hedge Funds, and Private Equity か ■eSh叩'ingGloba/Capital
Markets, McKinsey & Company ・
McCrary, S.A.[2005], Hedge Fund Course, John Wiley & Sons, Inc・, New Jersey・
McGuire. P. and K. Tsatsaronis [2008], "Estimating Hedge Fund Leverage," BIS Working Paper, No.260.
Papademos, L D ・ [2007], " Monitoring Hedge Funds: a Financial Stability Perspective," Hedge Funds (Special Issue) ,Financial Stability Review 10'" ed., Banque de France, pp.113-125.
Pozsar,A., Adrian, T., Ashcraft, A. and H. Boesky [2010] ," Shadow Banking √Federal Resei've Bank of New York StaffReport,
No.458.
Singh, M ・r20121, "The (Other)Deleveraging",IMF Working Paper, 12/179.
Singh, M ・[2011], "Velocity of Pledged Collateral: Analysis and Implications ", IMF Working Paper, 11/256.
Singh, M. and J. Aitken [2009], " Deleveraging after Lehman-Evidence from Reduced Rehypothecation ', IMF WorkingPaper,
09/42.
Singh, M. and p. Stella [2012], "Money and Collateral", IMF Working Paper, 12/95.
Stevenson, P.[2007] ,"Fund of Hedge Funds: Origins, Role and Future," Hedge Funds (Specia口hsiie),Financial StabilityReview 10'" ed.,Banque de France, pp.151-160.


![Figure 5 : Hedge Fund Gross Exposures (March 2012) CDS curitised products Loans (300)(250) (200)(150)(100) (50) 50 1(M 150 200 250 300S Billions ■LMV Source:FSA [2012], August, p.8 ■SMV Net (LMV ‑ SMV) Table l : Hedge Fund Gross Exposure to Rela](https://thumb-ap.123doks.com/thumbv2/123deta/10030623.1432482/11.772.168.589.127.389/figure-exposures-curitised-products-billions-source-august-exposure.webp)
![Figure 9 : The Sources and Uses of Collateral (2007,2010 and 2011) 〈Trillions USD 〉: 三 回]:Central Collateral Deskドu s S I O t r i l l i o n ( 2 0 0 7 )回心ごお谷‑。一一 一一 一 一一 一一 ‑ ‑ ‑ ‑ ‑ ‑ ‑ S e c u r i t i e s L e n d i n g一 一一 一− 一 一一 一一 一 一一 ‑](https://thumb-ap.123doks.com/thumbv2/123deta/10030623.1432482/15.772.175.580.137.439/FigureTheUsesTrillionsDeskドuSt回心ごお.webp)

