INVITED PAPER
Special Section on Electronic DisplaysSpeckle-Free Phosphor-Scattered Blue Light Emitted out of InGaN / GaN Laser Diode with Broadened Spectral Behavior for High Luminance White Lamp Applications
Junichi KINOSHITA†a),Member, Yoshihisa IKEDA†,andYuji TAKEDA†,Nonmembers
SUMMARY Ultra-high luminance lamps emitting white light with a well-scattered blue spectrum from InGaN/GaN laser diodes and a phosphor-converted yellow spectrum show speckle contrast values as low as LED. Spectral behavior of the laser diodes is analyzed to find the reason why such low values are obtained. As a result, the PWM-driven, multi- longitudinal mode with dynamically broadened line-width is found to have a great effect on reducing speckle contrast. Despite using the lasers, such speckle-free lamps are considered to be very suitable for high-luminance and other various lighting applications.
key words: laser diode, phosphor, lighting, speckle, spectral broadening
1. Introduction
InGaN/GaN blue laser diodes (LDs) are quite suitable for light sources of high brightness and high luminance lamps for various applications.
In fact, there have been many challenges to realize such high brightness light sources for automotive headlamps, laser projectors, digital cinema projectors, and even for gen- eral lighting applications.
Particularly, the challenges for general lighting and LCD backlight applications are based on much greater unique features of the LDs than the conventional LEDs [1]–
[5]. For example, the LDs are capable of droop-free light output up to much higher power levels with much narrower beam divergence from a much smaller area than the LEDs.
For display applications, pure spectral behavior of RGB LDs is expected to realize much wider gamut than the other light sources. Meanwhile, for the automotive headlamps and the general lighting applications, the blue LDs are utilized both for blue emission itself and generat- ing phosphor-converted longer spectral emissions, as in the same manner as the conventional white LEDs.
The other advantage of the LDs based the above unique features is to facilitate coupling their high-power output ef- ficiently into silica optical fibers. Therefore, we can realize a concept of remote configuration in which all the LDs and related electronic devices are arranged completely remote from the lamp structure. The ultra-high optical power trans- mitted through all of the fibers can be easily focused on a very small area to realize ultra-high brightness. Particularly
Manuscript received March 12, 2013.
†The authors are with Toshiba Lighting & Technology Corp., Yokosuka-shi, 237-8510 Japan.
a) E-mail: [email protected] DOI: 10.1587/transele.E96.C.1391
for the white lamps using phosphors, we can focus each blue output of the fibers onto a small phosphor-coated area to ultra-high luminance and luminous flux performance.
Heat generation at the lamp is minimally limited only to optical loss, including phosphor-conversion loss for the phosphor lamps.
The authors have developed 4000–5000 lm class white lamps emitting from a very small single phosphor area, us- ing optical fibers for separating the lamp unit from a LD light engine containing 20 pcs of InGaN/GaN high-power blue LDs and their driver circuits. (We call them “super- remote phosphor configuration”.) One of the lamps achieves the maximum center luminance as high as 140 Mcd/m2with luminous flux of 4050 lm [2], [4].
However, there has been a problem relating speckle noise. Laser coherence in general creates speckle noise on a detector surface including human retina when observing a light-diffusing objects illuminated by coherent light sources.
The speckle noise is observed as spatial and temporal varia- tions of intensity.
Therefore, it degrades resolution of laser displays and lighting quality of luminaires. For human eyes, speckle noise is, in most of cases, undesirable and irritating.
From a viewpoint of safety regulations, we have to comply with IEC 60825 as a laser source if it is coher- ent, meanwhile, IEC 62471 if it is incoherent. Particu- larly for lighting applications, the lamps using the phosphor- scattered LD output should be compliant with IEC 62471, as long as their measures for eye-safety risk are at the same level as the conventional light sources. As the best case scenario, if they actually lost coherence, there would be no problem to be categorized as IEC 62471.
Therefore, it is very important for high brightness lamps using LDs to measure speckle noise quantitatively.
For this purpose, we utilize “speckle contrast”, as a practi- cal measure of speckle noise or coherence. It is very popular for various types of laser displays to evaluate speckle noise of [6]–[9].
Considering the current status above, we have mea- sured speckle contrast of our 4000–5000 lm class lamps of
“super-remote phosphor configuration”. As a result, we have demonstrated that speckle contrast can be reduced down to the same value as LED, and concluded that it should be categorized as a lamp compliant with IEC 62471 rather than IEC 60825 [1]–[4].
Copyright c2013 The Institute of Electronics, Information and Communication Engineers
Such speckle-free behavior is considered to be achieved by a combined effect of multi-longitudinal mode operation of the LDs, the number of the LDs, and multiple scattering in the phosphor layers [1]–[4].
However, the speckle contrast values measured at just above the laser threshold currents cannot be suppressed completely down to the same value as LEDs when the LDs are driven by DC-dimming.
It is important for lighting applications to keep such speckle-free behavior throughout the whole dimming range.
For this purpose, it is effective to drive the LDs by PWM (Pulse Width Modulation) [3], [4].
In this work, we evaluate the spectral behavior of the LDs at various PWM dimming levels, compared with the spectral behavior of the corresponding DC dimming levels.
We have found that the line-width broadening of each lon- gitudinal mode has an additional effect on reducing speckle contrast. We also analyze the reason of the line-width broad- ening caused by PWM.
2. Structure
2.1 Entire LD Lighting System
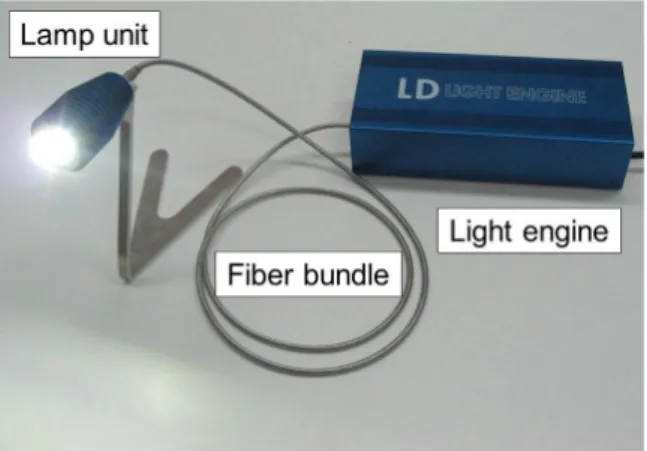
Figure 1 shows a photograph of the prototype of high- brightness LD lighting system consisting of three parts, a lamp unit, a flexible metal tube including the optical fibers, and the light engine containing 20 pcs of LDs.
We have two types of the lamp structure, one is trans- mission type [VV], and the other is reflection type. The lamp shown in Fig. 1 is the reflection type to be explained later. The lamp unit in Fig. 1 is one of the reflection type lamps.
Figure 2 also shows its schematic structure. The light engine is a see-through drawing to explain its inside in the following subsection.
2.2 Light Engine
The high-power InGaN/GaN blue LDs made by Nichia Cor- poration operate up to 1.3 W at the lasing wavelength around 445 nm in multi-transverse and multi-longitudinal modes.
The optical output of each LD is coupled into a step-index silica fiber with a core diameter of 100μm via a lens unit.
2.3 Lamp
The schematic cross-section of the reflection-type lamp is shown in Fig. 3. It is the top-head structure and the fiber inlet tail structure is neglected.
The output from each fiber is incident to the periphery of a piece of unique optics for focusing the blue lights onto the YAG phosphor layer coated on a reflective heat-sink.
The phosphor area has a circular shape with a diameter of 7 mm. The optics changes the direction of the input beams by internal total reflection. Then the beams are guided to the phosphor layer at the center of the optics.
Fig. 1 Photograph of high-brightness LD lighting system.
Fig. 2 Schematics of high-brightness LD lighting.
Fig. 3 Schematic cross-section of the reflection-type lamp unit.
A part of the blue lights is converted into incoherent yellow lights there. The rest of them and the converted yel- low light are mixed together and then scattered and reflected.
As a result, pseudo-white light is emitted with a Lamber- tian radiation profile. In this so-called “reflection-type” LD lamp, the temperature rise due to phosphor conversion loss is minimized by the effective direct heat transfer to the heat- sink. Therefore, the lamp achieves the maximum center luminance as high as 140 Mcd/m2 with luminous flux of 4050 lm (CIE1931 chromaticity:x=0.364,y=0.378). Mean-
while, the transmission-type lamp [1], [2] achieves a lumi- nance of 30 Mcd/m2much lower much lower than the reflec- tion type, limited by higher phosphor temperature caused by higher thermal resistance of the lamp structure.
3. Speckle Contrast
Speckle noise is usually undesirable and irritating for hu- man eyes, and must be suppressed for various laser displays because it degrades their image quality, as previously ex- plained in Sect. 1. Therefore, there have been many works to reduce speckle noise [6]–[9]. For lighting applications, speckle noise would degrade lighting quality as well.
If speckle noise of the lamp using LDs could be sup- pressed down to the same level as the conventional incoher- ent lamps, it should be categorized as a lamp rather than a laser.
We use speckle contrast, Cs, as a measure of speckle noise and/or coherence. It is mathematically defined by the following equation [8].
Cs=σI/J (1)
where,σIis standard deviation, andJis average.
The values ofCs =100% and 0% imply a perfect co- herence, and a perfect incoherence, respectively.
4. Measurement Setup
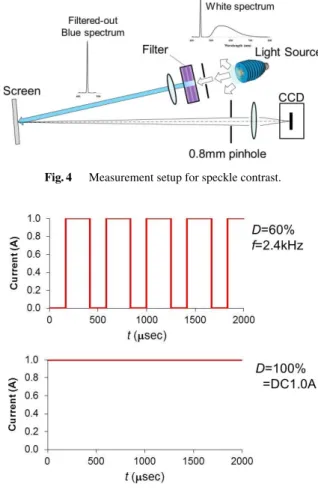
A measurement setup of speckle contrast, Cs is shown in Fig. 4. This measurement system was developed and pro- vided by Oxide Corporation [8]. It is set in a dark room to eliminate background lights as possible.
A conventional high brightness blue InGaN/GaN LED (Philips Lumileds Luxeon Rebel, Peak wavelength: 455 nm) and one of the blue InGaN/GaN LDs used in the light engine are also set here for comparison.
As a lamp using LDs, the reflection type lamp unit is used for the measurement. The pseudo-white light gener- ated by the LD lamp is incident to an optical filter and then only the blue spectrum is filtered out in order to eliminate the effects of incoherent phosphor-converted light.
The blue lights then illuminate a perfect diffuser screen.
Finally,Csis measured by a high performance CCD camera through a pinhole with an aperture of 0.8 mm diameter. The aperture size is determined to simulate human eyes [8], [9].
In order to measure with a full dynamic range from 0% to 100%, the CCD has a very wide range of responsivity.
The upper limit ofCs=100% is calibrated using a stan- dard He-Ne laser oscillating in a single longitudinal mode with a very narrow line width. The lower limit is determined and calibrated to be 1.6–1.8% using a standard LED, which include run-to-run measurement errors.
Each LD of the lamp and the direct laser beam out of a LD are driven with various DC levels in the range from just above the threshold current to the operating current of 1.0 A.
Here the threshold currents are around 0.15 A.
They are also driven with various PWM duty ratios,D,
Fig. 4 Measurement setup for speckle contrast.
Fig. 5 Example of PWM pulse sequence.
with a pulse peak of 1.0 A, corresponding to the DC-current- equivalent dimming levels. The modulation frequency is 2.4 kHz.
The longitudinal mode behavior of one of the blue In- GaN/GaN LDs is also measured changing the applied cur- rents. We use an optical spectrum analyzer (made by ADC Corporation, Model 8341) in this spectral measurement.
The LD output is directly coupled into the above spectrum analyzer. Therefore, it is independent of the speckle con- trast measurements. However, the driving current levels of the LD are exactly corresponding to those of the speckle measurement.
Examples of the PWM pulse sequence are shown in Fig. 5. It should be noted that the PWM sequence corre- sponding to DC1.0A is a kind of NRZ (non-return to zero) continuous line exactly as the same as the DC1.0A itself.
Therefore, theCsvalues for both of the DC and the PWM must agree each other at DC1.0A and PWM (D=100%).
Meanwhile, the PWM pulse sequences less than D=100% are alternating RZ (return to zero) codes which includes the transient responses of pulse rise/fall.
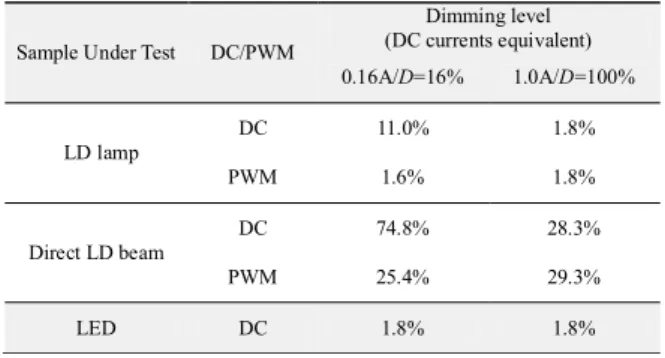
Table 1 Measurement results ofCs(%) at the dimming levels of 0.16 A and 1.0 A.
5. Results
5.1 Speckle ContrastCs
The measuredCsvalues at 0.16 A (DC) and 1.0 A (DC) and the corresponding PWM duty ratiosDfor the both the LD lamp and the direct LD beam are listed in Table 1. The Cs value for the blue LED is also shown in this table for comparison.
Csvalues both for the DC and the PWM must coincide at DC1.0A and PWM (D=100%) as in the previous section.
In case of direct LD beam, theCs=28.3% for DC1.0A and Cs=29.3% for PWM (D=100%).
The slight difference between them is considered to be within a measurement error. The errors tend to be larger if Cs is larger. This is because speckle is a kind of random noise.
MeasuredCsvalues for the various dimming levels are plotted in Fig. 6 for the LD lamp and plotted in Fig. 7 for the direct LD, respectively.
As in Table 1, Fig. 6, and Fig. 7, the measuredCs values just above the threshold current for DC-dimming are obvi- ously higher than the values at higher dimming levels. For the LD lamp, the Csvalues obtained below 0.3 A are not the same as the LED anymore. However, theCs values above 0.3 A are approximately as low as the LED.
Meanwhile, the measuredCsvalues for PWM dimming are all suppressed down to values as low as the LED.
Slightly lower value than the LED is due to the run- to-run error variation of the lower limit of the measurement system. If we change the light source, alignment must be optimized run o run. However, the relative errors through a run of the measurement just changing driving currents are very small.
As a result, it is demonstrated that PWM dimming is much more suitable than DC dimming. We can keepCs values as low as the LED in the whole dimming range.
Compared with Fig. 6 and Fig. 7, the measurement re- sult for the direct LD beam is quite a similar to the LD lamp except the much higherCs values. This suggests that the major reason why we can obtain such lowCsvalues would be related to the characteristics of the LD itself.
Fig. 6 Plot of Cs for the LD lamp (DC and PWM).
Fig. 7 Plot of Cs for the direct LD (DC and PWM).
We have to analyze the reasons for obtaining such low speckle contrast more in detail. A big difference between the DC and the PWM is a transient behavior of the pulse rise/fall.
To analyze the transient effects, we have to use a PWM sequence with lower pulse peak. It is difficult to obtain significant differences if we use the PWM sequence with a pulse peak of 1.0 A. This is because we obtain only the lowestCsvalues around the lower measurement limit in the whole dimming range for the pulse peak of 1.0 A.
If we use a PWM sequence with a pulse peak of 0.2 A, it was expected from Fig. 6 to have a Csvalue around 5%
at D=100%. Therefore, we plot the Cs values for PWM- dimming with a pulse peak of 0.2 A in Fig. 8. The PWM- dimming with a pulse peak of 1.0 A is also plotted for com- parison. As in Fig. 8, for lower duty ratioD, the pulse-top width decreases and the effect of the transient pulse rise/fall becomes more dominant. It is obvious that the transient be- havior has a great effect on reducing speckle contrastCs.
5.2 Spectral Behavior
Temporal coherence is closely related to the spectral behav- ior of laser sources. To analyze the transient effects more in detail, we evaluate the spectra of one of the LDs.
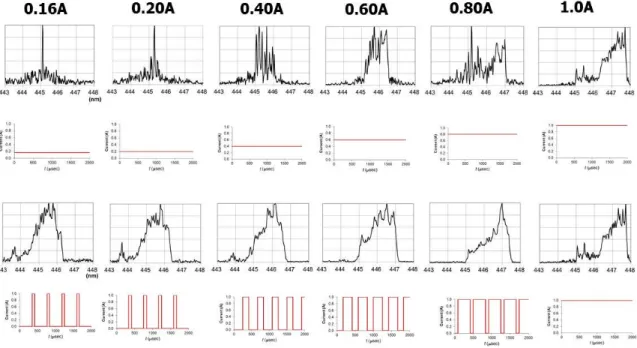
Figure 9 shows the spectra of the direct beam from the LD at the dimming levels of 0.16 A, 0.2 A, 0.4 A, 0.6 A, 0.8 A, and 1.0 A. The spectra in the upper are for the DC dimming. Those in the lower are for the PWM dimming.
The time sequence of driving current for each spectrum is also shown just below it.
We have already known that the spectra for the DC1.0A and the PWM (D=100%) coincide each other. As in the
Fig. 8 Plot of Cs for PWM with a pulse peak of 0.2 A.
Fig. 9 Spectral behavior of one of the LDs for various dimming levels. (Upper: DC dimming, Lower:
PWM dimming)
upper spectral group in Fig. 9, the LD operates in a semi- single longitudinal mode at lower current levels for DC dim- ming. Then the spectral envelope becomes broader from 0.4 A. The fine spectral structure of each line spectrum of the multi-longitudinal mode behavior is still distinguishable.
At 0.8 A, the spectral envelope splits offand has a double- peaking profile. The line-width of each mode looks broader at 1.0 A.
For PWM dimming, the spectral envelope is kept broad in the whole range of dimming. It should be noted that the line-width of each mode seems much broader than that for DC dimming. Multi-longitudinal mode operation occurs even if dimming levels are low.
This is because the pulse peak of the PWM dimming is up to 1.0 A. At least, at the pulse peak at each dimming level, spectral behavior similar to the DC1.0A is coming up. Ad- dition to the stable multi-longitudinal mode operation, the line-width broadening stably occurs because each pulse al- ways includes large transient rise and fall.
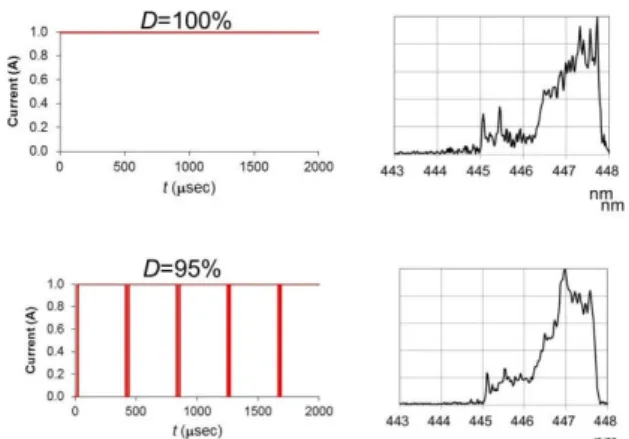
To analyze the transient effects, we make a compari- son between the DC1.0A (equal to PWM:D=100%) and the PWM:D=95%. In Fig. 10, the spectra for the DC1.0A and the PWM (D=95%) are shown together with their current sequences. The PWM (D=95%) is chosen because of its RZ pulse code, whereas NRZ continuous line for the DC1.0A.
The input power levels for the both are very close each other.
Therefore, we can clearly pick up the effect of the transient responses of the transient pulse rise/fall.
As shown in Fig. 10, the envelope spectral profiles for the both sequences look quite similar. However, the fine spectral structure of each longitudinal mode still ob- served for the DC1.0A is not clearly observed for the PWM (D=95%). This implies that the dynamic behavior of the
Fig. 10 Spectral comparison between DC1.0A and PWM (D=95%).
pulse transients cause much stronger line-width broadening of each longitudinal mode.
6. Discussion
6.1 Spectral Effect
Here we discuss why spectral broadening occurs.
For dynamic analysis of spectral behavior of multi- longitudinal mode operation of the LDs, we have to start with rate equations.
However, it is difficult to solve rate equations for the both multi-transverse and multi-longitudinal modes strictly.
It is too complicated to solve them because too many rate equations corresponding to the number of the both modes are needed. For example, the number of the longitudinal modes estimated to be several of tens as in the DC spectra in Fig. 9.
Therefore, for simplicity, we consider the spectral broadening of single mode, neglecting complicated interac- tions among the modes.
The rate equations for single mode are simply ex- pressed as follows.
dN dt = I
eV − N τn
−GS dS
dt = Γ
G− 1 τn
S +βN
τn
(2) where,Nis the carrier density,Sis the photon density,Iis the applied current, eis the electron charge, Vis the vol- ume of the active region,τnis the carrier lifetime,τpis the photon lifetime,Γis the optical confinement factor,βis the spontaneous emission factor,Gis the gain coefficient.
The dynamic wavelength shift of single longitudinal mode can be analyzed using the rate Eq. (2). It is well- analyzed in the field of optical communication systems, known as “wavelength chirping” expressed as the following equation.
λ(t)−λ(0)= Γλ(0) neff
dn
dN{N(t)−N(0)} (3)
where, λis wavelength,neff is effective refractive index of the active region, and dn/dNis differential refractive index expressing a change rate of the refractive index when car- rier density Nchanges. The refractive index of the active region changes by the free-carrier plasma effect. The vari- ables,N(t) andλ(t) are time-dependent functions.N(0) and λ(0) are the initial values.
Rapid increase of carrier density in the active region of the LD at the pulse rise/fall of PWM dimming will cause a change of refractive index. The carrier-induced refractive index change of the active layer will then cause a change of lasing wavelength. As a result, the pulse rise and fall cause a line-width broadening.
For higher carrier density, chirp-induced line-width broadening becomes larger as in Eq. (3). Therefore, higher applied currents cause larger line-width-broadening.
As in Fig. 9, even for DC dimming, the broadening to some extent occurs at 1.0 A, which is larger than lower DC currents. It is considered to occur because the mode power is exchanged interactively from mode to mode even if there are no intentional pulse transients. Such interaction must be analyzed by many of rate equations for multiple modes, which we have skipped for simplicity.
The longitudinal modal spacing is approximately given by,
Δλ≈ λ2
2neffL (4)
where,Lis the cavity length. The chromatic dispersion term is neglected for simplicity.
Assuming, L = 1 mm, λ = 450 nm, neff = 2.4, the mode spacing of the blue LD is estimated to be 0.042 nm.
This value well agrees with actual modal spacing in Fig. 9.
If we assume, dn/dN = 5.5 nm3, Γ = 0.2, N(t)− N(0) = 1018cm−3 and 1019cm−3, the wavelength chirp λ(t)−λ(0) calculated using Eq. (3) is approximately 0.2 nm for 1018cm−3and 2 nm for 1019cm−3, respectively.
This implies that the line-width broadening due to the dynamic wavelength shift (chirp) completely cover the modal spacing. In fact, we cannot observe the fine mode structure in the spectra for the PWM dimming. As a re- sult, such line-width broadening is considered to occur due to multi-mode operation including mode-to-mode interac- tions, and the transient behavior of pulse modulation greatly enhances the broadening. Such dynamic spectral behavior of the LDs has a great effect on reducing speckle contrast Cs.
6.2 Superposition Effect
Another contribution to reducing speckle contrastCsis the number of the LDs. This superposition effect is well-known and is expressed as follows [10].
C s∝1/m1/2 (5)
where,mis the number of LDs.
Fig. 11 Quantitative analysis of the three major effects on reducingCs.
The lamp systems usually use 20 pcs of LDs. There- fore,Csreduces down to 22.4% of that using only one piece of LD. Actual spectral behavior is a result of supposing the spectral behaviour of each LD shown in the previous sub- section.
6.3 Additional Scattering Effect
Both of the spectral and the superposition effects are not sufficient for reducingCsas low as the LED level.
In fact, the multi-mode effect reduces Cs down to around 28% from 75% for single use of LD. The super- position effect using 20 pcs LDs is 22.4% as in the above discussion. Therefore, the total reduction ofCsby the both effects is estimated to be 6.3%, not reaching the perfect re- duction ofCsdown to 1.8%. We have to consider additional effects for explaining the perfect reduction of Cs. (These quantitative analysis is shown in Fig. 11.)
We consider that multiple scattering by the phosphor layer and the other lamp structure is the additional effect.
First of all, the depolarization effect by scattering reducesCs
by 1/√
2, reaching 4.5%. However, we have to still consider furthermore. The further effects of the multiple scattering by the phosphor layer will be discussed more in detail in our future work [11].
7. Conclusion
Ultra-high luminance lamps emitting white light with a well-scattered blue spectrum from InGaN/GaN laser diodes and a phosphor-converted yellow spectrum are expected for various lighting applications.
We have measured speckle contrast of the blue scat- tered light out of such lamps using the blue laser diodes for evaluating lighting quality relating laser coherence.
Speckle contrast as low as a LED is obtained except just above the threshold current for DC dimming. We have
also found that PWM dimming is very effective to overcome the relatively high speckle contrast close to the threshold in the case of DC dimming.
In this work, we have analyzed the reason why PWM- dimming is capable of suppressing speckle contrast so effec- tively. Spectral behavior of the laser diodes is also analyzed in detail for this purpose.
As a result, multi-longitudinal mode operation of the laser diodes with dynamically broadened line-width is found to have a great effect on reducing speckle contrast. Particu- larly, at the transient pulse rise/fall, rapid increase of carrier density in the active region of the LD causes a change of re- fractive index. The carrier-induced refractive index change then cause a line-width broadening via wavelength chirp.
The rest of the effects for obtaining the perfect reduc- tion of speckle contrast down to the LED level are also ana- lyzed quantitatively. The superposition effect of using many lasers, and the scattering effect in the phosphor layer are dis- cussed briefly. The scattering effect will be more in detail in our future work.
The LD lamps using blue LDs are quite suitable for high-brightness lighting applications without any lighting quality degradation by speckle noise. They should be cat- egorized as “lamps” in IEC 62471 rather than “lasers” in IEC 60825 because they are actually incoherent due to their completely speckle-free capability.
Acknowledgments
Authors would like to thank Dr. S. Kubota and Mr. T. Fukui, Oxide Corporation for supporting speckle-contrast measure- ments and useful discussions.
References
[1] Y. Ikeda, Y. Takeda, M. Ueno, Y. Kawasaki, Y. Matsuba, A. Heike, and J. Kinoshita, “Very low speckle contrast of high-brightness white light source using blue laser diodes,” 1st Laser Display Con- ference Digest of Technical Papers, LDC8-4, 2012.
[2] Y. Ikeda, Y. Takeda, M. Ueno, Y. Kawasaki, Y. Matsuba, A. Heike, and J. Kinoshita, “Incoherentized high-brightness white light gener- ated using blue laser diodes and phosphors,” Digest of the 5th Light- ing Conference of China, Japan and Korea, Oral-6, 2012.
[3] J. Kinoshita, Y. Ikeda, Y. Takeda, M. Ueno, Y. Kawasaki, Y.
Matsuba, and A. Heike, “Suppressed speckle contrast of blue light emission out of white lamp with phosphors excited by blue laser diodes for high-brightness lighting applications,” Optical Review, vol.19, no.6, 2012.
[4] J. Kinoshita, Y. Ikeda, Y. Takeda, Y. Kawasaki, Y. Kawasaki, Y.
Kawasaki, M. Ueno, Y. Matsuba, and A. Heike, “Speckle contrast as low as LED for high luminance phosphor-converted lamp excited by InGaN/GaN blue laser diodes,” Proc. International Display Work- shops, vol.19, PRJ3-2, 2012.
[5] J. Kinoshita, Y. Kawasaki, Y. Takeda, and M. Ueno, “New light- bar emitting phosphor-converted white line light pumped by In- GaN/GaN laser diode for edge-lit backlight unit applications,” 2011 SID International Symposium Digest of Technical Papers, 53.4, 2011.
[6] S. Kubota, “Spatial coherence measurement of a scanning laser sys- tem and applicability of the zernike’s approximation to the exit pupil on the scan mirror,” 1st Laser Display Conference Digest of Techni-
cal Papers, LDC8-1, 2012.
[7] F. Shevlin, “Speckle mitigation in laser-based projectors,” 1st Laser Display Conference Digest of Technical Papers, LDC8-2, 2012.
[8] T. Fukui, K. Ito, K. Suzuki, H. Tokita, Y. Furukawa, and S. Kubota,
“Effective calibration method for absolute speckle contrast measure- ment,” 1st Laser Display Conference Digest of Technical Papers, LDC8-3, 2012.
[9] S. Kubota and J.W. Goodman, “Very efficient speckle contrast reduc- tion realized by moving diffuser device,” Appl. Opt., vol.49, no.23, pp.4385–4391, 2010.
[10] K. Kuroda, K. Yamamoto, and S. Kurimura, Laser Display (Optron- ics, Tokyo, 2010) Chap.3.
[11] Y. Ikeda, Y. Takeda, M. Ueno, Y. Matsuba, A. Heike, Y. Kawasaki, and J. Kinoshita, “Incoherentized high-brightness white light gen- erated using blue laser diodes and phosphors — Effect of multiple scattering,” Journal of Light & Visual Environment, vol.37, 2013, To be published.
Junichi Kinoshita received the B.S. and M.S. degrees in Electronic Engineering from Hokkaido University in 1977 and 1979, re- spectively. He received doctoral degree in En- gineering from Hokkaido University in 1996.
He joined Toshiba Corporation in 1979, then moved to Harison Toshiba Lighting Corpora- tion in 2003. He is now with Toshiba Lighting
& Technology Corporation after the merger in 2012.
Yoshihisa Ikeda received the B.S. and M.S.
degrees in Electronic Engineering from Ehime University in 2001 and 2003, respectively. He received doctoral degree in Engineering from Ehime University in 2013. He joined Harison Toshiba Lighting Corporation in 2003. He is now with Toshiba Lighting & Technology Cor- poration after the merger in 2012.
Yuji Takeda received the M.S. degrees in Electronic Engineering from Ehime University in 1997. He joined Harison Electric Co. Ltd.
in 1997. The company was reorganized as Hari- son Toshiba Lighting Corporation in 2000. He is now with Toshiba Lighting & Technology Cor- poration after the merger in 2012.