Effect of charcoal on water purification
Hirotaka Suzuki
1and Tatsuo Kawahigashi
21
School of Science and Engineering, and
2Institute for Science and Technology, Kinki University, Kowakae, Higashi-Osaka 577-8502, Japan
(Received 21 December, 2013)
Abstract
A natural basin system purifies water through self-purification, but the water pollution load of a river might exceed its self-purification capacity. Charcoal, which is used for other uses aside from heating, such as air purification, was evaluated experimentally for water quality purification. The experiment described herein is based on simple water quality measurements. Some experimentally obtained results are discussed.
Key words: water purification, charcoal, adsorption, porous, nutrient
1 Introduction
This report describes water quality purification through the water quality purification process of a purification plant [1] and the effects of aquatic plants on water purification [2].
This research was done in several parts.
Purification effects were originally assessed for a river.
River pollutants are extracted through physical, chemical, and biological action, with dilution, adsorption, precipitation, and biodegradation.
However, water pollution has become a severe
problem in recent years: the loads exceed the purification capacity of rivers.
Charcoal, used mainly for heating, is applied also in many cases for deodorization and air purification.
Nevertheless, such methods have not been clarified for rivers.
To estimate the charcoal purification mechanism, analyses were conducted to investigate changes of water under some set conditions. [3]
2 Experimental Outline
Materials, measurement items, and environmental conditions are presented in Table 1, Table 2, and Table 3.
Sample water was pumped up from the Seta River at the southernmost end of Lake Biwa.
Environmental conditions are set by combining some factors affecting water quality purification.
Water and water purification materials (sand and charcoal) were set to each tank under each condition. Water temperature was maintained at 20°C±1 in each tank. Each measurement was done for two weeks [4][5][6].
3 Results
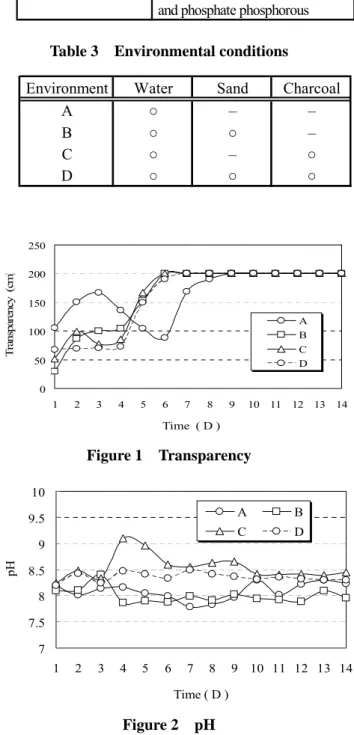
3.1 Transparency
Results of transparency assessments are shown in Figure 1.
Transparency is an indicator of water purity and impurity. A higher value indicates that water is clear.
Although the value of time progress of the tank with no materials added shows a large change, all tanks with added sand and charcoal show a similar tendency.
No other remarkable differences exist. The transparency of all tanks amounts to 200 cm within 10 days. No effect of charcoal was found from these results.
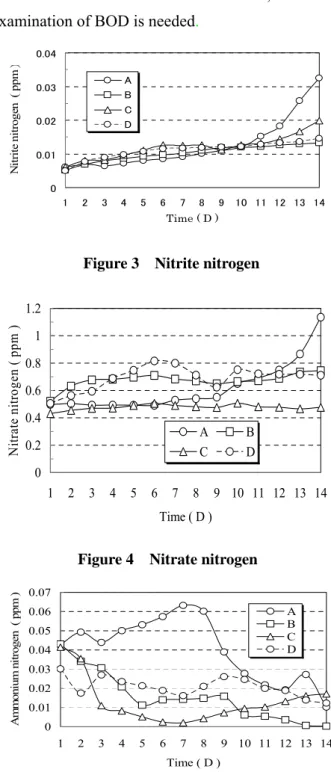
3.2 pH
Results of pH are shown in Figure 2.
pH is one index expressing the character of a water solution. Although pH shows no specific degree of contamination, it is closely related to the possibility of habitation of an aquatic microorganism. In the environment, pH of Cases A and B is high and similar. However, pH of Cases C and D is low and similar.
These results demonstrate that the existence of charcoal raises pH. The relation of pH and charcoal suitable for the microbe habitation
described previously cannot be inferred from these results.
Table 1 Materials
W a te r
S a n d c o m m e rc ia l sa n d (fro m riv e r) C h a rc o a l u se g ra n u la r (2 -5 m m )
C O D , p h o sp h o ro u s, n itro g e n (re a g e n t se t fo r a n a ly ze r)
w a te r sa m p lin g fro m th e S e ta R iv e r a t th e so u th sid e o f L a k e B iw a
R e a g e n t
Table 2 Measurement items
transparency, pH, DO, and COD/BOD
nitrite nitrogen, nitrate nitrogen, ammonium nitrogen,
and phosphate phosphorous Nutrient
Measurement items
Table 3 Environmental conditions
Environment Water Sand Charcoal
A ○ – –
B ○ ○ –
C ○ – ○
D ○ ○ ○
0 50 100 150 200 250
1 2 3 4 5 6 7 8 9 10 11 12 13 14 Time ( D )
Transparency (cm)
A B C D
Figure 1 Transparency
7 7.5 8 8.5 9 9.5 10
1 2 3 4 5 6 7 8 9 10 11 12 13 14 Time ( D )
pH
A B
C D
Figure 2 pH
3.3 Dissolved inorganic nitrogen
An indispensable element is called a necessary element for microbe growth.
Plants and microbes of a river take nutrition from a river from elements in ionic form [7].
Nitrate nitrogen is generated when ammonium nitrogen is oxidized by microbes. Nitrite nitrogen is an intermediate.
Ammonia in raw water increases until day 7 and decreases thereafter (Figure 5).
In contrast, the nitrate nitrogen and nitrite nitrogen concentrations increase gradually up to 7-day, the concentration increases rapidly thereafter.
These results are presumably dependent on nitrification activities by microbes.
In the tank with added charcoal, concentrations of nitrite nitrogen and nitrate nitrogen are unremarkable.
Therefore, it is inferred that using charcoal has some effect (Figs. 3, 4, 5).
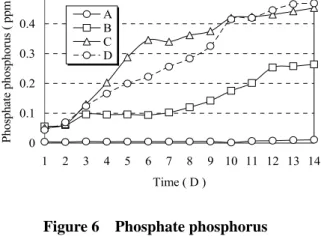
3.4 Phosphate phosphorus
Figure 6 presents the amount of change of phosphorous. Although the value rises slightly in the tank without charcoal, it increases greatly in the tank which has charcoal.Elution from the charcoal and sand is almost total, but no adsorption of phosphorus is shown.
3.5 Dissolved oxygen
Figure 7 presents results of dissolved oxygen (DO). Concentrations of DO in respective tanks show a rising trend because the tanks were not shielded. Photosynthesis exceeded the respiration of microbes.
3.6 Chemical oxygen demand
Figure 8 shows changes of chemical oxygen demand (COD).
COD is the amount of oxygen consumed when oxidized by a substance in which underwater organic matter is oxidized. This value is used as an index of water pollution. A high value can indicate
a state of eutrophication.
No case showed a fixed tendency until time had progressed for five days, but overall, a tendency of gradual decrease is apparent.
The tendency for COD of Case C to decrease is especially strong. An effect of charcoal on eutrophication reduction is accepted.
On the other hand, it is difficult to infer the features of each case and verification among cases from results on BOD. Therefore, further examination of BOD is needed.
0 0.01 0.02 0.03 0.04
1 2 3 4 5 6 7 8 9 10 11 12 13 14 Time ( D )
Nitrite nitrogen ( ppm )
A B C D
Figure 3 Nitrite nitrogen
0 0.2 0.4 0.6 0.8 1 1.2
1 2 3 4 5 6 7 8 9 10 11 12 13 14 Time ( D )
Nitrate nitrogen ( ppm )
A B
C D
Figure 4 Nitrate nitrogen
0 0.01 0.02 0.03 0.04 0.05 0.06 0.07
1 2 3 4 5 6 7 8 9 10 11 12 13 14 Time ( D )
Ammonium nitrogen ( ppm )
A B C D
Figure 5 Ammonium nitrogen
0 0.1 0.2 0.3 0.4 0.5
1 2 3 4 5 6 7 8 9 10 11 12 13 14 Time ( D )
Phosphate phosphorus ( ppm )
A BC D
Figure 6 Phosphate phosphorus
0 2 4 6 8 10 12
1 2 3 4 5 6 7 8 9 10 11 12 13 14 Time ( D )
Dissolved Oxyge ( ppm )
A B
C D
Figure 7 Dissolved Oxygen
0 1 2 3 4 5
1 2 3 4 5 6 7 8 9 10 11 12 13 14 Time ( D )
COD ( ppm )
A B C D
Figure 8 COD
Conclusion
The following conclusions were obtained from the results described above.
1) Results of pH and transparency do not show remarkable characteristics of charcoal.
2) However, the charcoal effect is proved from the results of inorganic nitrogen and COD.
Acknowledgement
We appreciate the support of Professor Yuzuru Nakaguchi, School of Science and Engineering, Kinki University.
References
[1] K. Yanagida and T. Kawahigashi:Ionic behavior of treated water at a water purification plant, Annual Reports by RIST, No. 24, 39-43 (2012) [2] K. Morimitsu and T. Kawahigashi: Purification of Water by aquatic plant, Annual Reports by RIST, No. 25, 31-35 (2013)
[3] Sandhya Babel:Cr(VI) removal from synthetic wastewater using coconut shell charcoal and commercial activated carbon modified with oxidizing agents and/or chitosan, Chemosphere, Volume 54, Issue 7, 951–967 (2004)
[4] H. Harino and E. Yatsuka: Water purification of using a charcoal, Volume 59, No. 2 Kobe University Joshigakuin Journal, 35-46 (2012)
[5] H. Oshima: Use technology as a water purification agent by charcoal from waste wood, Applications spread of technology use porous carbon and production of charcoal, NTS Inc., 236-248 (2009)
[6] K. Ishimaru: The surface analysis by ESCA and direct observation by TEM microstructure formed in the charcoal during, Academic Conference Proceedings, 50, 314-315 (2001)
[7] S. Yoshizawa: Proven case of wastewater treatment and growth of microorganisms by charcoal – microbial treatment of wastewater by coal carrier –, Applications spread of technology use porous carbon and production of charcoal, NTS Inc., 171-179 (2009)