Changes in Demographics and Response to Longevity Risks in Japan
Shigenori ISHIDA
■Summary
The objective of this paper is to analysis public policies on the in-
come security of the retired in Japan and point out some problems in comparison with public policies in U.S. and U.K. We would give suggestions for the policy to induce the demand for insurance prod-
ucts and individual annuities.
After the public pension reform 2004in Japan, it is expected that the income replacement ratio and the percentage of the amount of benefit paid of total after-tax income of existing employees will decrease, as population aging progresses and the birthrate keeps declining.
It is crucial for us to supplement the reduced benefit of public pensions to keep the income level of the retired constant. I think it is effective for promoting the retirement saving to utilize tax expenditures.
In Japan, individual annuities and DC type plans are not prevailing owing to insufficient tax preferred treatments, especially comparing with the status in U.S. and U.K. We point out the tax expenditure
*This article was originally presented at the Annual Conference of Korean Insurance Academic Society on May 13,2011.
/Acceptance on May11,2012.
←国名を泣き 別れにしない ため,イレジ ュラー処理を しています。
訂正時注意
budget in Japan is extremely unbalanced and biased toward tax exemptions of housing. I think itʼ s important to resolve this unbal-
ance to induce people in work to preparing for post-retirement life properly. At the same time, it is most important to evaluate the tax expenditures to utilize the promotion of private pensions, individual annuities to overcome longevity risks in Japan.
■Keywords
longevity risk, pension reform, tax expenditure
1.On Public Pension Reform 2004 in Japan
The2004revisions of Japanʼs pension law focused on the basic frameworks of public pension plansʼbenefits and contributions, and mainly the employeesʼpension schemes were shifted from the Fixed Benefit type toward the Fixed Contribution (Premium)type. In the conventional Fixed Benefit type, the premium rate was determined for each stage using pension actuarial calculation with certain for-
mula and income replacement ratio. If an unexpectedly low birthrate and longevity are reported at the actuarial review every five years,
the premium is raised. The future contribution rate, therefore, is not clearly defined due to the unforeseen of the world. The newly-
introduced Fixed Contribution type, on the other hand, has defined maximum future pension contribution rates, within which benefits are granted. However, as population aging progresses and the birth-
rate keeps declining, the income replacement ratio, or the percentage of the amount of benefit paid of total after-tax income of existing employees will decrease. The shift made to the basic framework of public pension plans has pressed for a change in the existing princi-
ple, which is designing institutional arrangements either from pension benefits that are to support post-retirement lives or from the limits of obligations and contributions. If the conventional method persists in the current pay-as-you-go pension system, the amount of pension contributions increasingly exerts pressure on the shrinking young working generations. In the new method, however, the amounts of benefits paid depend on the size of the working generations, and therefore, a slow reduction in the amounts is inevitable. In this paper, both types are compared, and the validity and potential amendments of them will be studied. If a conclusion is rushed, the Fixed Benefit type will more benefit a generation bigger in size than the adjacent generations. It will be also advantageous to the genera-
tion that endures low wage rates and severe budget constraints due to its size. If the Fixed Premium type is used, however, the genera-
tion smaller in size than the adjacent generations, or the generation that enjoys higher wage rates and more moderate budget constraints because of its size, will benefit.
However, if the Fixed Contribution type is adopted, a pension financing balance sheet is used to fix the amounts of income. In that case, a framework of coordination of benefits will be required so that certain amounts of expenditures and of pension benefits will be secured. As a realistic measure, the pre-decision Pay-Based Sliding System and the post-decision Indexation are coordinated. In the Ma-
croeconomic Sliding method, a total wage is calculated by an aver- age wage per laborer multiplied by the number of active workers, and the sliding scale is adjusted with variation of the total wages (i.
e., slide adjustment rate). If the active population is decreasing, the pension benefit actually declines in value with the adjusted slide
保険学雑誌 第 618号
rate. As a result, the benefit and income replacement ratio will be decreasing. However, a reduction of impact will be attempted by set-
ting lower limits on these rates and bringing forward or averaging the future variation rates.
2.Public Pension Plans and Differences in Benefit and Con- tribution Amounts between Generations
In this section, a simple three-generation model is used to study differences in internal rates of returns between the generations and the redistribution structures of the Fixed Benefit type (Plans)and Fixed Contribution type(Plans). The virtual demographic model is composed of the young, middle, and aged generations in the below ratios. Aging rapidly progresses in and after the fourth period,
when the maturity of the system and the burden of supporting older generations increase.
Set representative individuals in the young generation in the sec- ond period as Generation A. Generation A, then Generations B, C,
Period Demographic Ratio
(Young :Middle:Aged) Maturity 0.50 0.50 0.33 0.25 0.67 1.00 0.50 1 : 1 : 1
1 : 1 : 1 2 : 1 : 1 2 : 2 : 1 1 : 2 : 2 1 : 1 : 2 1 : 1 : 1 First
Second
Third
Fourth
Fifth
Sixth
Seventh
and D successively participate in pension schemes. Then the internal rates of returns and benefit and contribution rates are compared in each of the Fixed Benefit Plan and Fixed Contribution Plan. The interest rate is not set, but the wage growth rate is 100% to make it simple. Table1shows a case where the benefit rate is set at
20%. The premium rate is set at 10% in Table2.If the pension benefit in the second period is100, then the other values are as fol-
lows.
Table 1:Internal Rates of Returns in the Fixed Benefit Plans Fixed Benefit Plan Shifts of Internal Rates of Returns from Generation A to Generation D (The benefit rate set at 20%)
Period 1 2 3 4 5 6 7
10 16000 (‑1600) 16000 (‑1600) D3200 D37 20 8000 (‑1600) D8000 (‑1600) C1600 C114 13.3 D4000 (‑533) C4000 (‑533) B800 B180 5.0 C2000 (‑100) B2000 (‑100) A400 A125 6.67 B1000 (‑66.7) A1000 (‑66.7) 200 300 10 A500 (‑50) 500 (‑50) 100
∞ 0 250 0 250 0 0 0 Premium Rate(%)
Young/Wage Young/Premium
Middle/Wage
Middle/Premium
Aged/Pension Benefit
Internal Rate of Returns(%)
Generation D
Generation C
Generation B
Generation Generation A
37 114
180 Internal Rate of Returns(%) 125
1.5 2.5
Contribution Rate 3.4 4.8
2133 633
166.7
Premium Total 116.7
3200 1600
800
Benefit 400
保険学雑誌 第 618号
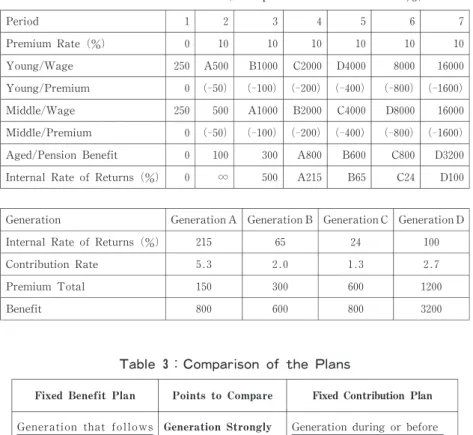
Table 2:Internal Rates of Returns in the Fixed Contribution Plans Fixed Contribution Plan Shifts of Internal Rates of Returns from Generation A to Generation D ( The premium rate set at10%)
Period 1 2 3 4 5 6 7
10 16000 (‑1600) 16000 (‑1600) D3200 D100 10 8000 (‑800) D8000 (‑800) C800 C24 10 D4000 (‑400) C4000 (‑400) B600 B65 10 C2000 (‑200) B2000 (‑200) A800 A215 10 B1000 (‑100) A1000 (‑100) 300 500 10 A500 (‑50) 500 (‑50) 100
∞ 0 250 0 250 0 0 0 Premium Rate(%)
Young/Wage Young/ Premium
Middle/Wage
Middle/Premium Aged/Pension Benefit
Internal Rate of Returns(%)
Generation D
Generation C
Generation B
Generation Generation A
100 24
Internal Rate of Returns(%) 215 65
2.7 1.3
Contribution Rate 5.3 2.0
1200 600
Premium Total 150 300
3200 800
Benefit 800 600
Table 3:Comparison of the Plans
Fixed Benefit Plan Points to Compare Fixed Contribution Plan
Generation that follows the peak of generation aging
High, stable internal rate of returns for aging groups
High-benefit-high-contri- bution approach from necessity
Generation Strongly Affected by
Demographic Changes
Extent of Changes of Internal Rate of Returns
Benefit Designs
Generation during or before the peak of generation aging
Severe drop of internal rate of returns for aging groups
M oderate-benefit-moderate- contribution approach from contribution constraints; finan- cial burdens not forwarded to the future; obligation shared
Comparison of these tables helps weigh the Fixed Benefit Plans and Fixed Contribution Plans.(Refer to Table 3)
1) The generation that is strongly affected by demographic changes is the one that follows the peak of population aging when the Fixed Benefit Plans apply and the one during or before the peak of population aging when the Fixed Contribu-
tion Plans are implemented.
2) As for the internal rate of returns and the extents of the benefit-contribution rate changes, the aging population groups enjoy stable, high rates with the Fixed Benefit Plans but expe-
rience severe drops of the rates with the Fixed Contribution Plans.
3) For the Fixed Benefit Plans, the beneficiary receives high ben- efits from high contribution, designed from necessity, whereas for the Fixed Contribution Plans, the beneficiary is granted
Fig.1 Real Internal Rate of Returns (%)
保険学雑誌 第 618号
moderate benefits from moderate contributions due to contribu- tion constraints. For this plan, financial burdens are not for- warded to future generations, and obligations are shared by multiple groups.
3.On the Means of Promoting the Retirement Saving
After the pension reform2004, the level of living standards for the retired depends on the degree of the population aging. It is crucial for us to supplement the reduced benefit of public pensions to keep it constant.
I believe it is effective for promoting the retirement saving to uti- lize tax expenditures.
The tax expenditure budget comprises the estimated revenue losses due to various exclusions, exemptions, preference rates in the tax code. These provisions reduce the income tax liabilities of individual and companies undertaking certain types of activities. This policy is evaluated depending on whether it serves a public purpose in the best manner.
In Japan, it is crucial to discuss how to use a preferred tax treat- ment for retirement savings effectively to promote private pensions and individual annuities. Especially tax allowance, tax exclusion tar-
geted to low income household, employees belong to small companies like private defined contribution plans.
In compare with the tax expenditure budget in U.S., we point out the tax expenditure budget in Japan is extremely unbalanced and biased toward tax exemptions of housing (Fig.2, Fig.3). I think itʼs important to resolve this unbalance to induce people in work to pre-
pare for post-retirement life properly.
At the same time, it is essential to discuss policies after inquiring tax expenditures. However, it is unfortunate that tax expenditures budgets have not been introduced in Japan different from other in-
dustrialized countries. It is very crucial for Japanese government to create tax expenditures budgets to judge the accuracy of tax expenditures and utilize them to achieve political goals more effec-
tively.
Fig.2 Tax Expenditure Budget 2008 by U.S.Government
Source; U.S.Department of Labor(2009),Pension & Welfare Benefits Administration (www.dol.gov/pwba)
保険学雑誌 第 618号
4.Current Situations of Life Insurance and Private Pension
In the super-aging society, income guarantee and savings aspects of life insurance are increasingly important. Savings-based life insur-
ance products are purchased for the purpose of savings, and some types of such products feature an aspect for long-term wealth accu-
mulation. Some examples of these programs are savings-type insur- ance, endowment insurance for preparing for post-retirement life, and individual annuities. On the other hand, non-refundable insurance products cannot be used for savings purposes but assume the roles of providing financial security to the families of deceased members and providing medical security. Such insurance products include term insurance to serve as financial security for the deceased memberʼ s family for a certain period of their most productive time; permanent insurance that guarantees lifetime financial security to the deceased
Source; Uemura, T.(2008)ʼAn Estimation of Tax Expenditure in Japanese Income Taxʼfor special taxation measures of the Ministry of Finance
Fig.3 Tax Expenditure Budget 2006 by National Economic Survey in Japan
memberʼs family with an aspect of savings equivalent to the cash surrender value; and private medical insurance and accident insur-
ance that supplement public medical insurance. Due to the struc- tural characteristics of the products for “mutual assistance”, these insurance products have the advantage of payment of relatively large benefit amounts guaranteed with small premiums.
With respect to savings, the number of life insurance products pur- chased as financial products is increasing and has recently overwhel- med bank and postal term deposit products. Today it has been slow- ing slightly but the trend is still continuing (Fig.4, Fig.5).
Observing the trend by insurance products type also reveals that the ratio of term insurance and endowment insurance products pur-
chased is continuously decreasing, and on the other hand, the number of savings-based permanent insurance products purchased is increas-
ing. Also, the ratio of medical insurance products purchased in all types of new contracts is growing, from 27.1% in2001to 42.6% in
2008. At the same time, the number of private pension plans pur- chased for post-retirement financial security is also steadily growing, from slightly over 13million in 2001to over 17million new con- tracts. This trend is also observed in the data of net premium in- come by year. The total income from premiums paid for medical insurance in all new contacts grew from 8.2% in 2001to23.3% in
2008. These numbers of new contracts, contracts in force, and pre- mium income clearly show that the volumes of private sector, re- presented by private pension plans and medical insurance are grow- ing. Also, as for the aspects of life insurance programs as financial products, lifetime formation of “quasi-bequests”due to greater lon-
gevity and wealth accumulation for post-retirement are emphasized.
保険学雑誌 第 618号
Fig.4 Amounts of business in force in Japan (unit 10million)
Source; OECD(2010),Private Pensions Conference 2009, OECD Publication Office, Japanese Association of Life Insurance (2010),Life Insurance Factbook
Fig.5 Ratio of premium revenue by types in Japan (%)
Source:OECD, op. cit.
5.Conclusion
In Japan, individual annuities and DC type plans are not prevailing owing to insufficient tax preferred treatments, especially comparing with the status in U.S. & U.K.(Fig.6 , Fig.7, data source is same as Fig.4). At the same time, the demand for individual annuities has been limited to high income level households and public servants. It is most important to evaluate the tax expenditures to utilize the promotion of private pensions, individual annuities to overcome lon-
gevity risks.
There arises the situation that the retirement period continues to be prolonging. Then it is crucial for insurance companies to intro-
duce valuable annuities with GM DB, GM IB, GM WB and GIC type plans to cope with longevity risks in Japan. For such new type annuity products, these companies have to co-ordinate with another financial companies or institutes in place of sales activities and the fund management. In fact, the sale of insurance products has been permitted to banks. Recently, the role of the production of insurance products and their sales has been separated.
At the same time, it improves the skill of investing the funds and the way of financial risk management, especially the liquidity risks due to the flexibility of such annuities. On the other hand, central government properly regulates such annuities to protect the rights and benefits of insurance consumers, policyholders.
保険学雑誌 第 618号
Fig.6 Ratio of type of contracts in force in U.S. (%)
Fig.7 Ratio of type of contracts in force in U.K. (%) Source:OECD, op. cit.
Source:OECD, op. cit.