Acta Med. Nagasaki 37:146-149
Significant Level of Environmental Radioactivity in Sasebo Area
Masahiro Yoshida and Yutaka Okumura
Department of Radiation Biophysics, Atomic Disease Institute, Nagasaki University School of Medicine, Sakamoto-machi, Nagasaki 852, Japan
Summary: Environmental radioactivity in Sasebo area in Nagasaki Prefecture was surveyed for 25 years from 1964 to 1989. Samples of sea water, sea sediment, marine organisms and rain including dry fallout were collected twice a year from various places in and out of Sasebo Bay. Radioactivity of those samples were measured with a low background counter. The results clearly demonstrated that the China nuclear tests and the Chernobyl accident influenced the environ- mental contamination of radionuclides. From the values surveyed for a long period, we proposed the significant level of radioactivity indi- cating environmental contamination.
Introduction
Radioactive fallout from repeated nuclear tests and from accidents of nuclear reactors have affected environmental radioactivity. As industrial use of nuclear energy and of radioactive substances is increasing yearly, it is important to survey the environmental radioactivity in areas where we live and to evaluate annual change in the radioactivity for a long preiod.') This is a report of environmental radioactivity surveyed for 25 years from 1964 to 1989 in Sasebo area, Nagasaki Prefecture, Japan.
Materials and Methods
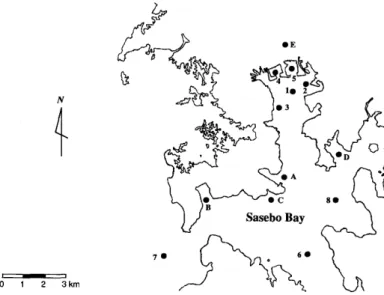
Sea water, sea sediment, marine organisms and rain includ- ing dry fallout were sampled in Sasebo area. Sampled places for sea water and sea sediment were at 8 points, from points 1 to 8 in and out of the Sasebo Bay in Nagasaki Prefecture as shown in Fig. 1. Sampled time was twice a year, in May and November. One liter of sea water was collected from different depths; surface, intermediate layer and bottom of sea at each sampling point. The amount of samples for sea sediment was 500 g. Fish, shellfish and seaweed for marine organisms were sampled of the season.
Sampled places for shellfish were at 4 points, from points A to D, as shown in Fig. 1. For fish and seaweed, sampled places were not restricted. Sampled time for marine organ- isms was twice a year, in March and September. Rain including dry fallout was collected monthly on a sampling
tray, 1,007 cm' in area, located on the housetop of the Public Health Center of Sasebo City, point E in Fig. 1.
Sampled sea water was treated by the ion barium meth- od') during a period from 1964 to 1979, and by the cobalt sulfide coprecipitation method') since 1980. The ion barium method has been applied for the analysis of short life fission products from nuclear weapon tests. The procedure was as follows in brief: 10 mg of ion and 10 mg of barium were added to 1 liter of sea water, and acidified weakly by adding a small amount of diluted hydrochloric acid. After adding 2 g of ammonium chloride, samples were heated at 80 °C and then ammonia water was added. The samples were kept at a room temperature until precipitates were observed. The precipitation was collected by filtering the solution through a filter. The filter was dried under an infrared lamp, and was applied for the measurement of radioactivity. The cobalt sulfide coprecipitation method has been applied for monitoring radioactivity in areas around nuclear power stations. The procedure was as follows in brief: 1 ml of diluted hydrochloric acid and carrier cobalt
D
is
• 3
7 •a or (
\(...)\
0 1 2 3 km
Fig. 1. Sampling points in and out of Sasebo Bay.
Point 1.to 8 are for sampling sea water and sea sediment, points A to D for sampling marine organisms, and a point E for sampling rain.
M. Yoshida et al.: Environmental Radioactivity
was added to I Iiter of samples, and alkalized to pH 9.7 by adding ammonia water. Samples were stirred after adding 30 ml of thioacetamide. After samples were heated at 90‑95 C for 2 hours, the supernatant solution was filtered through a filer. The filer was dried under an infrared lamp, and was applied for the measurement of radioactivity.
Sea sediment was treated by the cold hydrochloric acid extraction method. The procedures were as follows in brief:
Samples were passed through a 2 mm sieve and were dried at I 10 ) . Two hundred milliliter of hydrochloric acid was added to 20 g of sample. After stirring, the sample was kept overnight. The super natant of the solution was filtered, and
was neutralyzed with ammonium water and warmed in a hot water bath, and was precipitated by adding ammonium carbonate. After overnight holding of the sample, the precipitate was filtered and dried, then ashed at 500 C Five hundred grams of samples were applied for the measurement of radioactivity.
Marine organisms were dried at 70‑110 C for several hours, then ashed at 500 C . Five hundred grams of sam‑
ples were applied for the measurement of radioactivity.
Rain was dried and the residual was applied for the measurement of radioactivity. Acetone solution of Ceme‑
dine was added to samples of sea sediment, marine organ‑
isms and rain for fixation.
Radiations of beta rays and gamma rays from the sam‑
ples were counted with a low background counter, LBC‑451 (Aloka, Tokyo) for 20 min. A standard source of U30*, 440 Bq, was used for calibration of measurement of radioactivity of sea water and rain, 7.39 Bq of KCI 500 mg for sea sedimentation and marine organisms. The counting efficiency was 32‑34 % for sea water and rain, 22‑24 % for sea sedimentation and marine organisms.
Results and Discussion
1. Sea Water
Radioactivity of sea water from 1 964 to 1989 was shown in Fig. 2. The values of radioactivity of sea water at 8 differ‑
ent points in Fig. I were averaged. The mean values for sea water collected from the surface, intermediate layer and bottom of sea water were shown. There were correlated changes among different depths. The value of radioactivity of sea water in September 1964 indicated the same value with the recent level, but high radioactivity was shown during 1965 to 1979 by nuclear tests in China.') The radio‑
activity has decreased after 1 980 because of halting the terrestrial nuclear tests. Our results clearly demonstrated that China nuclear tests gave significant influence on envi‑
ronmental radioactivity. This decrease was consistent with observation on the beta ray measurement of glaciers in Alps.*") There were two peaks of radioactivity in 1 982 and l 986. The increase in the radioactivity observed in July
200
'¥ 150
:l
‑ I OO
;:l
5‑ 50
o o
e o o‑
o o
ooo o o e
Sea Water
H:h
O
Surface intermediate Botom
1 47
1 965 1975 1980
1970Year
Fig. 2. Change in radioactivity of sea water.
The values of radioactivity at 8 points were mean values were indicated, for the depths mediate layer and bottom of sea.
1 985 l 990
averaged, and the of surface, inter‑
1982 was due to a flood recorded at Sasebo. It was consid‑
ered that terrestrial water containing a natural radionuclide in soil, such as *3'Cs, flowed into sea by heavy rain.
Another peak in 1986 was due to the accident of the nuclear power station occurred in May 1986 in Chernobyl.
The radioactivity of sea water at different sampling points averaged from 1964 to 1989 is shown in Fig. 3. There was no difference among them.
IOO l
,, C:1 Q , >1 50 ,
'
cL) c:$
O
;5 e a3
o
3 5
Sampling Points
Fig. 3. Radioactivity of sea water at different sampling points averaged from 1964 to 1989.
2. Sea Sediment
In Fig. 4, change in radioactivity of sea sediment is shown.
The values of radioactivity at 8 different points in Fig. 1 were averaged. Until 1966 the influence of China nuclear tests on radioactivity was observed. Radioactivity of sea sediment collected from 1964 to 1 989 were averaged for different sampling points, and is shown in Fig. 5. Radioac‑
tivity for sampling points 5 to 8, was larger than for sampling points I to 4, but the difference was small.
1 48
:'
O
Q
:
c $0
; ;
0 1000
800
600
400
200
o
Sea Sediment
1965 1970 1975 1980 1990
1985Year
Fig. 4. Change in radioactivity of sea sediment.
The values of radioactivity of 8 points were averaged, and the mean values were indicated.
M. Yoshida et al.: Environmental Radioadtivity
̲ 200
:'
150
c' :l
‑ roo
. >
. $ 50
.* o $
O : o c:$
7 5
2 3
Sanrpling points
Fig. 5. Radioactivity of sea sediment at different sampling points averaged form 1964 to 1989.
3. Marine Organisms
The value of radioactivity in marine organisms can be affected from that of sea water and sea sediment.1,8) Seaweed, shellfish and fish consisted a food chain of radionucldies.7, 8) Change in radioactivity of marine organ‑
isms is shown in Fig. 6, for Tapes Japonica (short necked
clam), Monacanthus Cirrhlfer (file fish), Parapristipoma Trilineatum (grunt), Sebastiscus Marmortus (scorpion fish), Undaria Pinnatlfida (wakame seaweed). A signif‑
icant change was not observed in them except for Undaria Pinnatlfida. The radioactivity of Undaria Pinnatifida in‑
creased with time (Fig. 7), which is indicated by Y = 0.0212 X ‑ 388.3
' q)
.¥ o
>1 '>
;5
cs e(I
500
400
300
200
100
o
o o
Marine Organisms
D Do
o (yo o V ii DdL e ' D dl.D. ]tJ:!Eb.
DD
[ ・・c l
EbD o
v
o
D
Tapes Phi,ippinarum Monacanthus Cirrhifer Paraprlslpoma Tri!ineatum Sebastiscus Marmortus Undaria Pinnatifida
r)
1965 1975 1990
1970 Year 1 980 1985 Fig. 6. Change in radioactivity of marine organisms.where, Y is radioactivity, X is time in year. The correlation coefficient (r) was 0.726. This increase in radioactivity is presumably due to *3'Cs incorporation from sea water to Undaria Pinnatlfida. Hirano et al. have reported that '9Tc was detected in algae.') Radioactivity of marine organisms averaged from 1964 to 1989 is shown in Fig. 8. Undaria Pinnatifida had high radioactivity compared with other marine organisms. Change in radioactivity of Tapes Japon‑
ica sampled at different points, A to D in Fig. 9. A small influence on the radioactivity by China nuclear tests was detected .
‑ 500
edo 400
C q 300
h
t:: 200
C:
1 OO
; ;
e O
e e
eee
, e
Undaria Pinnatlfida
e e
e
1965 1970 1975 1980 1985 1990
Year
Fig. 7. Increase in radioactivity of Undaria Pinnatlfida.