Acta Med. Nagasaki 39: 114-118
Effect of Acute Hyperoxia and Hypoxia on the Central Blood Volume in Patients with Chronic Pulmonary Diseases
Satoshi IKEDA, Yoshiyuki MIYAHARA and Tatsuji NAITO
The Second Department of Internal Medicine, Nagasaki University, School of Medicine
To investigate whether the central blood volume (CBV) reflects the pulmonary vasculature, we measured CBV before and after the inhalation of 100 % or 13 %O2 for 15 min in patients with chronic pulmonary diseases. Using the Stewart-Hamilton technique, we measured CBV using a lung water computer, employing sodium as an indicator. Thirteen
patients inhaled 100 % O2, while 8 patients breathed 13 % O2.
Hyperoxia increased CBV significantly and the delta change
in CBV(△CBV)correlated significantly with the change in total pulmonary resistance index(△TPPI;r=‑0.65,
p<0.02),the change in mixed venous oxygen tension(△PvO2;
r = - 0.58, p < 0.05) and the change in the coefficient of
oxygen delivery (△COD;r=0.71, p<0.02). Hypoxic
breathing caused little or no change in CBV, but △CBV correlated well with△TPRI(r=‑0.74, p<0.05)and△PvO2
(r=0.85,p<0.01)。 Our results suggest that△CBV provides
a good index of the pulmonary vascular bed, on which efficient gas-exchange occurs.
Key words : Central blood volume, hyperoxia, hypoxia, pulmonary vascular bed, pulmonary hyperten-
sion.
INTRODUCTION
The central blood volume (CBV), a concept first intro- duced by Steward) and Hamilton'), is calculated by multi- plying the mean circulation time of a non-diffusible indicator to the extravascular tissue, by the pulmonary blood flow. This volume strictly includes the blood in those vessels between the injection and collection points, although the majority of the volume is occupied by blood present in the heart and lung. Beckett et al.') reported that the induction of pulmonary embolism in dogs, using 0.15^-0.2 mm glass beads, in a minimal dose of 0.32 gm/
kg, caused a reduction in CBV, as measured by indocyanine green (ICG), to approximately 2 ml. They concluded that the CBV could, therefore, detect small changes in pulmo- nary blood volume. Furthermore, Noble et al').described a sharp increase in CBV following the injection of dextran in dogs and the induction of pulmonary edema. Bock et al.') also reported a change in CBV with a change in blood body posture. These results suggest that the CBV has a good
sensitivity. We investigated in the present study whether CBV reflects the status of the pulmonary vasculature in patients with chronic pulmonary diseases, before and after acute hyperoxia or hypoxia.
SUBJECTS AND METHODS
Subjects (Table 1). We studied 21 patients who had been admitted to Nagasaki University Hospital. They consisted of 8 patients with pulmonary emphysema, 10 patients with pulmonary fibrosis and 3 patients with bornchial asthma.
The diagnosis was based on medical history, physical examination, chest X-ray, chest CT, pulmonary tests, and histological examination of tissue specimens obtained by transbronchial or open lung biopsy. No patients had symptoms or signs of right-sided heart failure. Thirteen patients participated in the acute hyperoxic experiments while 8 patients were exposed to acute hypoxia. An in- formed consent was obtained from each patient before the study.
Methods. With the subject in the supine position, a 7-Fr.
Swan-Ganz thermodilution catheter (Baxter Co. TF002H- 7F) was placed percutaneoulsy into the main pulmonary artery using the Seldinger technique. A 5-Fr. lung water catheter (Elecath HE 2900) was inserted into the femoral
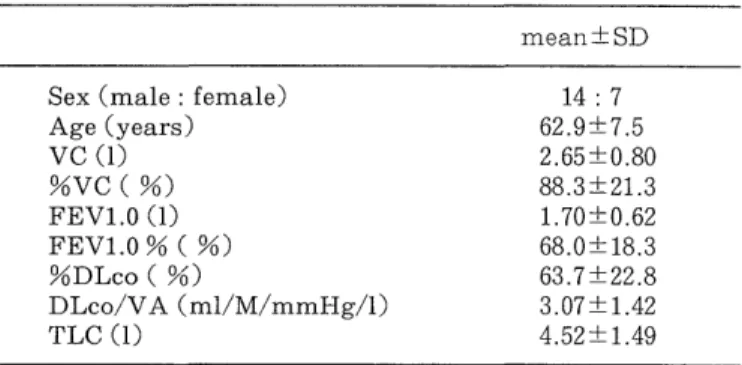
Table 1 Pulmonary function tests of subjects
mean SID
Sex (male : female) 14 : 7
Age (years) 62.9±7.5
VC (1) 2.65 ±0.80
%VC ( %) 88.3 ±21.3
FEV1.0 (1) 1.70±0.62
FEV1.0 % ( %) 68.0±18.3
%DLco ( %) 63.7±22.8
DLco/VA (ml/M/mmHg/1) 3.07±1.42
TLC (1) 4.52±1.49
%DLco, predict diffusing capasity for CO; DLco/VA,
diffusing capasity for CO per alveolar volume
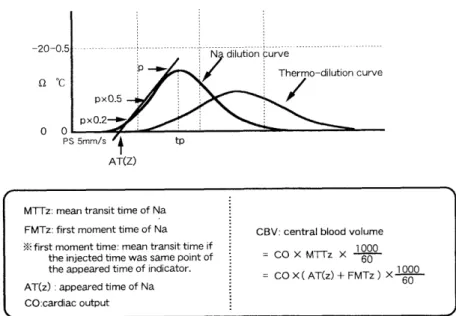
MTTz: mean transit time of Na FMTz: first moment time of Na X first moment time: mean transit time if
the injected time was same point of
the appeared time of indicator.
AT(z) : appeared time of Na CO:cardiac output
CBV: central blood volume
= CO X MTrz X 1000 (7
= CO X (AT(z) + FMTz) X 1000
Figure 1. Calculation of CBV using the Na dilution curve.
artery and positioned at the level of the first lumbar spine in the abdominal aorta. Arterial and mixed venous blood gas samples were collected simultaneously and analyzed using a Ciba-Corning 288pH/Blood Gas Analyzer with a co-oxymeter 2500. The coefficient of oxygen delivery (COD)s' was calculated using the following equations :
COD = Ca02 /(Ca02-Cv02)
Where Ca02 = 1.34xHb x Sa02+0.0031 x Pa02 and CvO2 = 1.34xHb x SaO2+0.0031 X Pv02
Hb, concentration of hemoglobin ; Sa02 , arterial 02 saturation ; Pa02, arterial 02 tension ; SvO2, mixed venous 02 saturation; PV02, mixed venous 02 tension.
We also measured the cardiac output (CO) by the thermodilution technique, using a REF-1 ejection fraction/
cardiac output computer (Edwards Critical Care Medi- cine). A sodium dilution curve was obtained, using a lung water computer (MTV-1100, Nihon Koden), by injecting
10 ml of O V, 3 % NaCl into the right atrial lumen of the Swan-Ganz catheter. The central blood volume was calcu- lated from the Na dilution curve, as illustrated in Figure 1.
The total pulmonary resistance index (TPRI, resistance units, RU/m2) was calculated by diving the mean pulmo- nary arterial pressure (MPAP, mmHg) by the cardiac index (Cl, 1/min/m2). The percent change in CBV, 0 CBV, was calculated as follows ;
A CBV = (test CBV-control CBV)/ control CBV x 100 The change in other parameters was also calculated as mentioned above. Pulmonary function tests were per- formed with the patient in the sitting position, using the
Autospirometer System 9 (Minato Medical Co.).
Protocol. After measuring pulmonary hemodynamic variables, blood gas data and CBV, the subject inhaled 100% 02 (13 patients) or 13%02 with 87 % N2 (8 pa- tients) for 15 min, from a 150L Douglas bag, using a tight-fitting face mask. The test was repeated after a resting period of 15 min. No patient complained of dyspnea or palpitation or other symptoms during hypoxic and hyperoxic breathing.
Satistical analysis. The signed rank Wilcoxin test was used to examine for significant differences between control and test data. The correlation coefficient between CBV and the tested parameter wad determined using the linear regres- sion analysis. A differece was considered statistically significant when the p value was < 0.05. The average of triplicate measurements of CBV, CI and TPRI was used for each subject. Values are expressed as mean±SD.
RESULTS
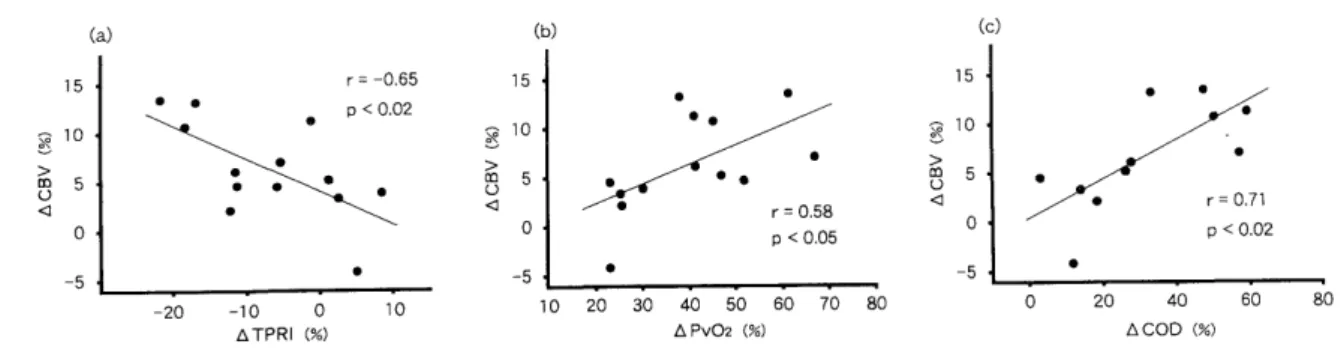
1) Inhalation of 100 % 02 (Table 2) : Acute hyperoxia reduced MPAP significantly, and increased PaO2, Pv02 and COD significantly. The mean CI and TPRI tended to decrease, albeit insignificantly. Inhalation of hyperoxic gas mixture increased the mean CBV significantly, com- pared with the control. The increase in CBV was observed in all but one patient (Fig. 2). Furthermore, the A CBV correlated significantly with ATPRI (r = -0.65, p<0.02),
0PV02 (r = 0.58, p<0.05) and ACOD (r = 0.71, p <0.02) (Figs. 3).
2) Inhalation of 13 %02 (Table 3) : Hypoxic breathing
increased MPAP, CI and TPRI significantly and caused a
Table 2 CBV, homodynamic variables and blood gas data before and after 100 % oxygen inhalation.
Table 3 CBV, homodynamic variables and blood gas data before and after 13 % oxygen inhalation.
Before After
CBV (ml/kg) 14.0±3.5 14.9±3.6*
MPAP (mmHg) 14.8±2.7 13.4±3.8*
C1 (1/min/ m2) 4.3±1.2 4.1±0.9
MBP (mmHg) 131.0±28.5 113.5±17.7
TPRI (RU/m2) 3.75±1.44 3.53±1.52
HR (bpm) 82.4±10.5 79.2±9.5
Pa02 (torr) 85.8±14.7 421.4±53.7*
PaCO2 (torr) 34.9±4.1 35.5±5.5
Pv02 (torr) 40.5±4.6 56.6±8.7*
COD 4.87±1.16 6.39±1.66*
*P<0 .05
MPAP, mean pulmonary pressure ; CI, cardiac index ; MBP, mean body pressure ; TPRI, total pulmonary resistance index, HR, heart rate; Pa02 , arterial 02, tension ; PaC02, arterial CO2 tension ;Pv02, mixed venous 02 tension ; COD, coefficient of oxygen deliveryBefore After
CBV (ml/kg) 19.0±4.6 18.7±4.0
MPAP (mmHg) 15.3±4.7 19.3±5.6*
C1 (1/min/ m2) 3.5±1.0 3.8±1.0*
MBP (mmHg) 100.4±21.4 96.3±20.4
TPRI (RU/m2) 4.80±2.23 5.44±1.98*
HR (bpm) 69.1±11.6 71.9±10.7
Pa02 (torr) 83.6±8.0 40.0±3.5*
PaC02 (torr) 34.7±4.8 33.3±3.7
Pv02 (torr) 37.7±2.3 28.3±2.1*
COD 3.78±0.55 3.46±0.47
*P < 0 .05
MPAP, mean pulmonary pressure ; CI, cardiac index ; MBP, mean body pressure ; TPRI, total pulmonary resistance index, HR, heart rate; Pa02 , arterial 02, tension ; PaC02, arterial C02 tension ; Pv02, mixed venous 02 tension ; COD, coefficient of oxygen deliveryFigure 2. The change in CBV before and after administra- tion of 100 % oxygen.
Figure 4. The change in CBV before and after inhalation of 13 % 02.
Figure 3. The relationship between o CBV and A TPRI (a), A Pv02 (b), and 0 COD (c) during breathing of 100 %02.
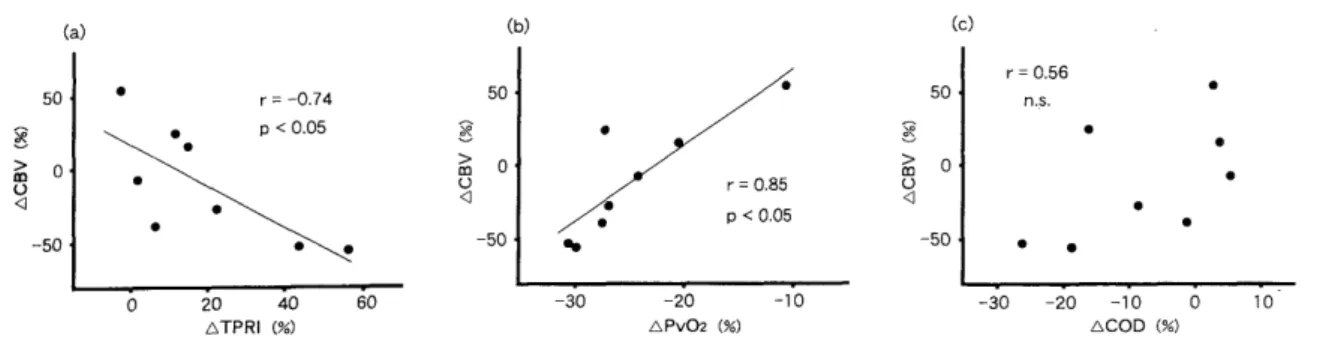
Figure 5. The relationship between o CBV and A TPRI (a), o Pv02 (b), and o COD (c) during inhalation of 13 %02
fall in PaO2 and PvO2. The CBV tended to decrease, albeit insignificantly, although it increased in 3 patients (Fig.
4). The A CBV increased with decreases in A TPRI (r = - 0 .74, p<0.05), while it correlated positively with APv02 (r = 0.85, p <0.01) (Figs. 5a and 5b). In contrast, there was no relationship between A CBV and A COD (Fig.
5c). There was also no relationship between the control CBV level and other parameters, such as pulmonary function tests, blood gases and hemodynamic variables.
DISCUSSION
Sodium was used as the non-diffusible indicator in the present study for the following reasons, (a) the simple operation of the lung water computer (MTV-1100), (b) a satisfactory reproducibility of measurements", (c) accu- racy of measurements, compared with those made using other indicators. Noble et al.') reported that the volume of sodium leaking to the extravascular tissue was less than that of ICG, and that CBV measured with Na (CBVNa) correlated well with CBV measured using ICG (CBVICG) although the level of CBVNa was slightly higher than that of CBVICG.
1) Inhalation of 100 % 02. The beneficial effect of oxygen therapy has already been demonstrated in patients with chronic pulmonary diseases ans pulmonary hypertension (PH)8) 9). Not only this effect has been proved in long term use of oxygen, but also after a short term administration.
In this regard, Ashutosh et al.") suggested that the effect of acute hyperoxia was one of the important prognostic factors during treatment of patients with chronic pulmo- nary diseases. Holt et al." reported that inhalation of 02 caused a significant decrease in pulmonary arterial pres- sure and pulmonary vascular resistance, together with a small fall in the cardiac index, as tested in 13 patients with pulmonary emphysema. The investigators concluded that oxygen reduces pulmonary vasoconstriction. Wilson and Dempsey12) demonstrated that acute hyperoxia decreased
the pulmonary arterial pressure in part due to a fall in the cardiac output and a decrease in pulmonary vascular resistance. Our results of a significant decrease in MPAP and the small reduction in CI and TPRI confirm these early findings. Furthermore, Hunt et al.") demonstrated in 17 COPD patients that the administration of 100% 02 increased the ratio of dead-space to tidal volume (VD/
VT), causing a redistribution of pulmonary blood flow from the well ventilated areas to the poorly ventilated areas, as a result of a reduced hypoxic pulmonary vasocon- striction. Uchida et al.') also demonstrated a redistribu- tion of the pulmonary blood flow during the inhalation of 90 % oxygen, as measured by the Krypton-81 m perfusion images. Our results demonstrated a significant increase in
CBV in response to hyperoxia, and that A CBV correlated well with A TPRI, A PvO2 and 0 COD. These results suggest that a change in CBV due to hyperoxia reflects an increased pulmonary vascular bed due to a redistribution
of blood flow.
2) Inhalation of 13 %02- In 1946, von Euler et al.") were the first group of researchers to demonstrate the development
of hypoxic pulmonary vasoconstriction and pulmonary hypertension during exposure of cats to 10% 02. Several studies have also examined the vasoconstrictive effect of
acute hypoxia on the pulmonary vasculature in humans'), 1°), 16-22) In general, the results of these studies indicate that acute hypoxia increases pulmonary arterial pressure. While Weitzemblum et al.22) reported a similar increase in pulmonary resistance, they also reported a large inter-individual variability.
On the other hand, exposure to hypoxia induces other
cardiovascular changes. For example, Doyle et al.") de-
scribed a slight increase in CO in both normal adults and
patients with cardiopulmonary diseases following the
administration of 10% 02. Furthermore, Naeije et al.")
reported that hypoxic breathing increased CO in normal
subjects due to a lack of change in 02 transport. It is of
interest that patients with severe PH respond to acute
hypoxia by increasing CO without modifying the
pulmonary vascular resistance while patients with a less severe PH develop a more severe vasoconstriction and increased vascular resistance without changing CO"). In contrast, Motley et al.'s) described a descrease in CO in four normal subjects and one patient with aortic valve regurgitation following inhalation of 10 % 02. Thus, there is a discrepancy regarding the effect of acute hypoxia on CO. In present study, hypoxia increased MPAP, CO and pulmonary vascular resistance. However, hypoxia did not increase these parameters in all patients. Furthermore, the mean change in CBV was a decrease in its value, albeit insignificantly, although three patients did not develop a decrease in CBV while breathing 13 %02 . A lack of a clear-cut effect of hypoxia on CBV was also reported by Fretts et al.") and Doyle et al."). We believe that the variability of 0 CBV in our study was due to (a) inter- individual differences in the extent of pulmonary vascular constriction 22), (b) differences in the extent of pulmonary vascular involvement within the lung"), (c) the recruit- ment of new lung regions caused by increased CO.
Our results indicated the presence of a significant correlation between 0 CBV and A TPRI and A Pv02.
Furthermore, changes in PvO2 correlated with changes in the volume of oxygen delivery. On the other hand, Pv02 reflected the level of P02 at the end of tissue capillaries2').
We assumed that 0 CBV represented an increase or de- crease in the pulmonary vascular bed, on which efficient gas-exchange occurred. Furthermore, we believe that the lack of a correlation with A COD was probably due to a lack of effect of acute hypoxia on COD'''.
The control level of CBV did not relate with pulmonary function tests and pulmonary circulation. This is probably due to a large variability among subjects, age and their disease state.
CONCLUSIONS
We measured the contral blood volume using the Stewart-Hamilton dilution technique and sodium as an indicator, while 100 % or 13 % 02 was inhaled by patients with chronic pulmonary diseases. The A CBV correlated well with A TPRI and A Pv02. Our results suggest that 0 CBV is a good index of the pulmonary vascular bed, on which efficient gas-exchange occurs.
ACKNOWLEDGEMENTS
We gratefully acknowledge Professor Kohei Hara for reading the manuscript and for his invaluable comments.
REFERENCES
1) Stewart GN.: Researches on the circulation time and on the influences which affect it. The output of the heart. J Physiol. 22: 159-183 (1897).
2) Hamilton WF, Moore JW, Kinsam JM, Spurling, PG.: Simultaneous
determination of the pulmonary and systemic circultion times in man and of a figure related to the output. Am J Physiol. 84: 338-344
(1928).
3) Beckett RC, Gray BA.: Effect of atelectasis and embolization on extravascular thermal volume of the lung. J Appl Physiol. 53:
1614-1619 (1982).
4) Noble WH, Obdrzalek J Kay JC : A new technique for measuring pulmonary edema. J Appl Physiol ; 34: 505-512 (1973).
5) Bock J, Hoeft A, Korb H, de Vivie R, Hellige G.: Determination of central blood volume and extravascular lung water. Thorac Cardiovasc
Surgeon. 35: 53-56 (1987).
6) Mithoefer JC, Holford FD, Keighley JFH.: The effect of oxygen administration on mixed venous oxygenation in chronic obstructive
pulmonary disease. Chest. 66: 122-132 (1974).
7) Watanabe A, Tanaka A, Kimura N, Watanabe N, Kusajima K, Abe T, Komatsu S.: Accuracy and clinical problems involved in the measure-
ments of extravascular lung water, using the thermal-sodium double
indicator dilution technique. Kokyu to Junkan. 39: 66-36 (1991)
(Japanese).
8) Nocturnal Oxygen Therapy Trial Group.: Continuous or nocturnal oxygen therapy in hypoxemic chronic obstructive lung disease : a
clinical trial. Ann Intern Med. 93: 391-398 (1980).
9) Medical Research Council Working Party.: Long term domiciliary oxygen therapy in hypoxemic cor pulmonare complicating chronic
bronchitis and emphysema. Lancet. 1 : 681-686 (1981).
10) Saadjian A, Philip- Jet F, Levy S, Arnaud A.: Vascular and cardiac reactivity in pulmonary hypertension due to chronic obstructive lung
disease : assessment with various oxygen concentrations. Eur Respir J.
5: 525-530 (1992).
11) Holt JH, Branscomb BV: Hemodynamic responses to controlled 100 oxygen breathing in emphysema. J Appl Physiol. 20: 215-220 (1965) 12) Wilson RH, Hoseth W, Dempsy ME: The effect of breathing 99.6 oxygen on pulmonary vascular resistance and cardiac output in
patients with pulmonary emphysema and chronic hypoxia. Ann Intern
Med. 42: 629-637 (1955).
13) Hunt J, Copland J, McDonald CF, Barter CE, Rochford PD, Pierce RJ : Cardiopulmonary response to oxygen therapy in hypoxacmi(
chronic airflow obstruction. Thorax. 44: 930-936 (1989).
14) Uchida K, Ashitaka T, Kawamura Y : Effect of oxygen the regional distribution of ventilation-perfusion in the lung and the right ventricu-
lar ejection fraction -Assessment using Xe-133 and Kr-81 m-. Jap J
Thorac Dis 24: 985-990 (1986) (Japanese).
15) Von Euler US, Liljestrand G : Observations on the pulmonary arterial blood pressure in the cats. Acta Physiol Scandinav. 12: 301-320 (1946).
16) Motley HL, Cournand A, Werko L, Himmelstein A, Dresdale D.: The influence of short periods of induced acute anoxia upon pulmonary
artery pressure in man. Am J Physiol. 150: 315-320 (1947).
17) Naeije R, Melot C, Mols P, Hallemans R.: Effect of vasodilators on hypoxic pulmonary vasoconstriction in normal man. Chest. 82: 404-41(
(1982).
18) Fritts HW, Odell JE, Harris P, Braunward EW, Fishman AP.: Effect of acute hypoxia on the volume of blood in the thorax. Circulation. 22
216-219 (1960).
19) Fishman AP, Frittes HW, Cournand A.: Effects of acute hypoxia and exercise on the pulmonary circulation. Circulation. 22: 204-215 (1960), 20) Westcott RN, Fowler NO, Scott RC, Hauenstein VD, McGuire J.
Anoxia and human pulmonary vascular resistance. J Clin Invest. 30 957-970 (1951).
21) Doyle JT, Wilson JS, Warren JV.: The pulmonary vascular responses to short term hypoxia in human subjects. Circulation. 5: 263-27C
(1952).
22) Weitzenblum E, Schrijen F, Mohan-Kumar T, Colas des France V.
Lockhart, A.: Variability of the pulmonary vascular response to acute
hypoxia in chronic bronchitis. Chest. 94: 772-778 (1988).
23) Fowler K, Read J.: Effect alveolar hypoxia on zonal distribution of pulmonary blood flow. J Appl Physiol. 18: 244-250 (1963).
24) Kishi F.: Mixed venous oxygen tension. Respiration Research. 4 165-170 (1985) (Japanese).